Deck 12: Estimation: Comparing Two Populations
Full screen (f)
Question
Question
If two random samples of sizes  and
and  are selected independently from two populations with variances
  and
and  , then the standard error of the sampling distribution of the sample mean difference,
  , equals:
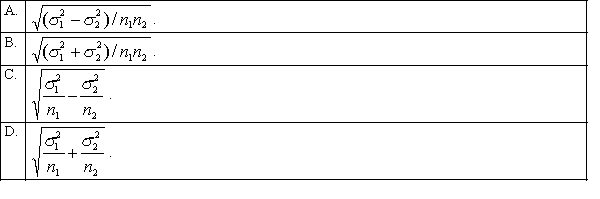
and are selected independently from two populations with variances and , then the standard error of the sampling distribution of the sample mean difference, , equals: Question
If two populations are not known to be normally distributed, the sampling distribution of the sample mean difference,  , will be:
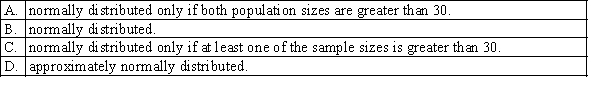
, will be: Question
Question
Two independent random samples of 25 observations each are drawn from two normal populations. The parameters of these populations are: 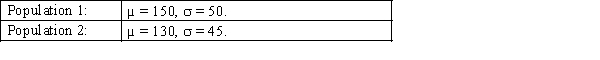 Find the probability that the mean of sample 1 will exceed the mean of sample 2.
Find the probability that the mean of sample 1 will exceed the mean of sample 2. Question
Question
Two independent random samples are drawn from two normal populations. The sample sizes are 20 and 25, respectively. The parameters of these populations are: 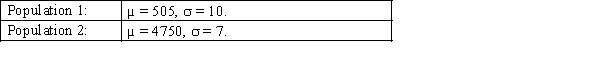 Find the probability that the difference between the two sample means (X1-bar - X2-bar) is between 25 and 35.
Find the probability that the difference between the two sample means (X1-bar - X2-bar) is between 25 and 35. Question
Question
Two samples are selected at random from two independent normally distributed populations. Sample 1 has 49 observations and has a mean of 10 and a standard deviation of 5. Sample 2 has 36 observations and has a mean of 12 and a standard deviation of 3. The standard error of the sampling distribution of the sample mean difference,  , is:
, is: 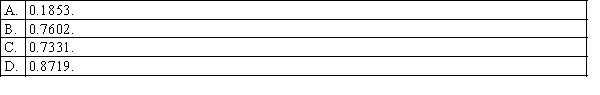
, is: Question
Question
Question
Which of the following statements is correct when estimating the difference between two population proportions p1 − p2? 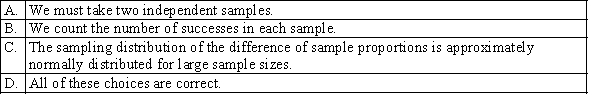
Question
If two random samples of sizes  and
and  are selected independently from two non-normally distributed populations, then the sampling distribution of the sample mean difference,
  , is:
, is: 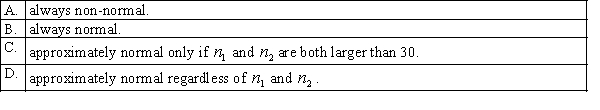
and are selected independently from two non-normally distributed populations, then the sampling distribution of the sample mean difference, , is: Question
Question
In constructing a confidence interval estimate for the difference between the means of two normally distributed populations, using two independent samples, we: 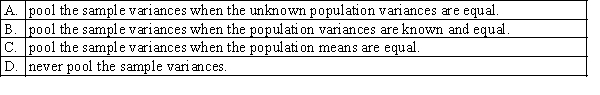
Question
In constructing a 99% confidence interval estimate for the difference between the means of two normally distributed populations, where the unknown population variances are assumed not to be equal, summary statistics computed from two independent samples are as follows: 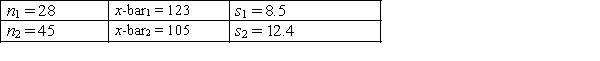 The lower confidence limit is:
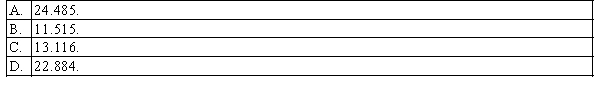
The lower confidence limit is: Question
If two random samples of sizes  and
and  are selected independently from two populations with means
  and
and  , then the mean of the sampling distribution of the sample mean difference,
  , equals:
 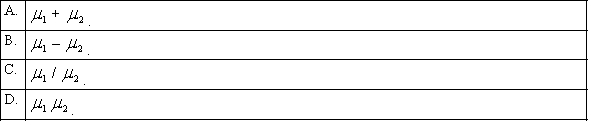 :
:
and are selected independently from two populations with means and , then the mean of the sampling distribution of the sample mean difference, , equals: : Question
Question
The expected value of the difference of two sample means equals the difference of the corresponding population means: 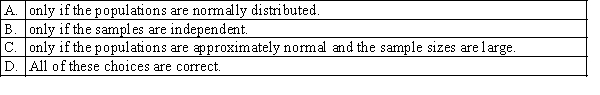
Question
In constructing a confidence interval estimate for the difference between two population proportions, we: 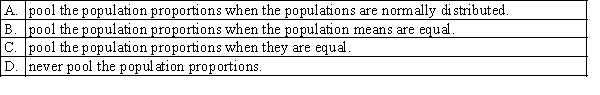
Question
Question
Question

Unlock Deck
Sign up to unlock the cards in this deck!
Unlock Deck
Unlock Deck
1/23
Play
Full screen (f)
Deck 12: Estimation: Comparing Two Populations
1
In order to draw inferences about p1 − p2, we take two independent samples − a sample of size n1 from population 1 and a sample of size n2 from population 2.
True
2
If two random samples of sizes and are selected independently from two populations with variances and , then the standard error of the sampling distribution of the sample mean difference, , equals:
and are selected independently from two populations with variances and , then the standard error of the sampling distribution of the sample mean difference, , equals: D
3
If two populations are not known to be normally distributed, the sampling distribution of the sample mean difference, , will be:
, will be: A
4
When the two population variances are unequal, we cannot pool the data and produce a
common estimator. We must calculate s12 or s22 and use them to estimate σ12 and σ22 respectively.
common estimator. We must calculate s12 or s22 and use them to estimate σ12 and σ22 respectively.
Unlock Deck
Unlock for access to all 23 flashcards in this deck.
Unlock Deck
k this deck
5
Two independent random samples of 25 observations each are drawn from two normal populations. The parameters of these populations are: Find the probability that the mean of sample 1 will exceed the mean of sample 2.
Find the probability that the mean of sample 1 will exceed the mean of sample 2. Unlock Deck
Unlock for access to all 23 flashcards in this deck.
Unlock Deck
k this deck
6
If two random samples of sizes 30 and 45 are selected independently from two non-normal populations with means of 53 and 57, then the mean of the sampling distribution of the sample mean difference, , equals -4.
Unlock Deck
Unlock for access to all 23 flashcards in this deck.
Unlock Deck
k this deck
7
Two independent random samples are drawn from two normal populations. The sample sizes are 20 and 25, respectively. The parameters of these populations are: Find the probability that the difference between the two sample means (X1-bar - X2-bar) is between 25 and 35.
Find the probability that the difference between the two sample means (X1-bar - X2-bar) is between 25 and 35. Unlock Deck
Unlock for access to all 23 flashcards in this deck.
Unlock Deck
k this deck
8
Suppose that the starting salaries of finance graduates from university A are normally distributed with a mean of $36 750 and a standard deviation of $5320. The starting salaries of finance graduates from university B are normally distributed with a mean of $34 625 and a standard deviation of $6540. If simple random samples of 50 finance graduates are selected from each university, what is the probability that the sample mean of university A graduates will exceed that of university B graduates?
Unlock Deck
Unlock for access to all 23 flashcards in this deck.
Unlock Deck
k this deck
9
Two samples are selected at random from two independent normally distributed populations. Sample 1 has 49 observations and has a mean of 10 and a standard deviation of 5. Sample 2 has 36 observations and has a mean of 12 and a standard deviation of 3. The standard error of the sampling distribution of the sample mean difference, , is:
, is: Unlock Deck
Unlock for access to all 23 flashcards in this deck.
Unlock Deck
k this deck
10
Suppose that the starting salaries of male workers are normally distributed with a mean of $56 000 and a standard deviation of $12 000. The starting salaries of female workers are normally distributed with a mean of $50 000 and a standard deviation of $10 000. A random sample of 50 male workers and a random sample of 40 female workers are selected.
a. What is the sampling distribution of the sample mean difference - ? Explain.
b. Find the expected value and the standard error of the sample mean difference.
c. What is the probability that the sample mean salary of female workers will not exceed that of the male workers?
a. What is the sampling distribution of the sample mean difference - ? Explain.
b. Find the expected value and the standard error of the sample mean difference.
c. What is the probability that the sample mean salary of female workers will not exceed that of the male workers?
Unlock Deck
Unlock for access to all 23 flashcards in this deck.
Unlock Deck
k this deck
11
We cannot estimate the difference between population means by estimating the mean difference μD,
when the data are produced by a matched pairs experiment.
when the data are produced by a matched pairs experiment.
Unlock Deck
Unlock for access to all 23 flashcards in this deck.
Unlock Deck
k this deck
12
Which of the following statements is correct when estimating the difference between two population proportions p1 − p2?
Unlock Deck
Unlock for access to all 23 flashcards in this deck.
Unlock Deck
k this deck
13
If two random samples of sizes and are selected independently from two non-normally distributed populations, then the sampling distribution of the sample mean difference, , is:
and are selected independently from two non-normally distributed populations, then the sampling distribution of the sample mean difference, , is: Unlock Deck
Unlock for access to all 23 flashcards in this deck.
Unlock Deck
k this deck
14
Which of the following best describes a matched pairs experiment?
A) An experiment in which each observation in one sample can be matched with an observation in another sample.
B) A matched pairs experiments means that the samples are not independent.
C) We estimate the difference between population means by estimating the mean difference when the data are produced by a matched pairs experiment.
D) All of these choices are correct.
Unlock Deck
Unlock for access to all 23 flashcards in this deck.
Unlock Deck
k this deck
15
In constructing a confidence interval estimate for the difference between the means of two normally distributed populations, using two independent samples, we:
Unlock Deck
Unlock for access to all 23 flashcards in this deck.
Unlock Deck
k this deck
16
In constructing a 99% confidence interval estimate for the difference between the means of two normally distributed populations, where the unknown population variances are assumed not to be equal, summary statistics computed from two independent samples are as follows: The lower confidence limit is:
The lower confidence limit is: Unlock Deck
Unlock for access to all 23 flashcards in this deck.
Unlock Deck
k this deck
17
If two random samples of sizes and are selected independently from two populations with means and , then the mean of the sampling distribution of the sample mean difference, , equals: :
and are selected independently from two populations with means and , then the mean of the sampling distribution of the sample mean difference, , equals: : Unlock Deck
Unlock for access to all 23 flashcards in this deck.
Unlock Deck
k this deck
18
If two random samples, each of size 36, are selected independently from two populations with variances of 42 and 50, then the standard error of the sampling distribution of the sample mean difference, , equals 2.5556.
Unlock Deck
Unlock for access to all 23 flashcards in this deck.
Unlock Deck
k this deck
19
The expected value of the difference of two sample means equals the difference of the corresponding population means:
Unlock Deck
Unlock for access to all 23 flashcards in this deck.
Unlock Deck
k this deck
20
In constructing a confidence interval estimate for the difference between two population proportions, we:
Unlock Deck
Unlock for access to all 23 flashcards in this deck.
Unlock Deck
k this deck
21
For a matched pairs experiment, find a 90% confidence interval for µD given that sample mean differences is 5, the standard deviation of differences is 3 and the sample sizes are 30.
Unlock Deck
Unlock for access to all 23 flashcards in this deck.
Unlock Deck
k this deck
22
Estimate p1 − p2 with 99% confidence, given that n1 = 50 and n2 = 50 and the first sample has a proportion of 0.50 and the second sample has a proportion of 0.20
Unlock Deck
Unlock for access to all 23 flashcards in this deck.
Unlock Deck
k this deck
23
A study is trying to estimate the difference between the annual salaries paid to female and male employees working for the same large company. They take a random sample of 50 females and find that their average annual salary is $75 600 with a variance of $21 250. They take a random sample of 50 males and find that their average annual salary is $78 500 with a variance of $22 500. Find and interpret a 95% confidence interval for the difference in annual salaries for female and male employees of this large company.
Unlock Deck
Unlock for access to all 23 flashcards in this deck.
Unlock Deck
k this deck
Unlock Deck
Unlock for access to all 23 flashcards in this deck.


