Deck 10: Variables Control Charts
Full screen (f)
Question
Question
Question
Question
Question
Question
Question
Question
Question
Question

Unlock Deck
Sign up to unlock the cards in this deck!
Unlock Deck
Unlock Deck
1/10
Play
Full screen (f)
Deck 10: Variables Control Charts
1
Though only seven averages and range values are available, the engineers studying the olive bottle filling process have decided to create X-bar and R charts for the samples measuring the air gap in the bottle. Upon viewing the charts, it became obvious that the 4th point has an assignable cause. Investigation revealed that the corks for this batch had not been placed at the correct depth in the bottle, thus resulting in the large air gap exhibited by the 4th point. Adjustments have been made to the machinery and this problem is not expected to reappear. Revise the control chart. Assume an assignable cause has been found for the 4th point and remove this point from the chart. Calculate the new limits.
Sum of x-bars = 66.34 Sum of R's = 3.5 n = 5
Point 4, X-bar = 9.92, R = 0.6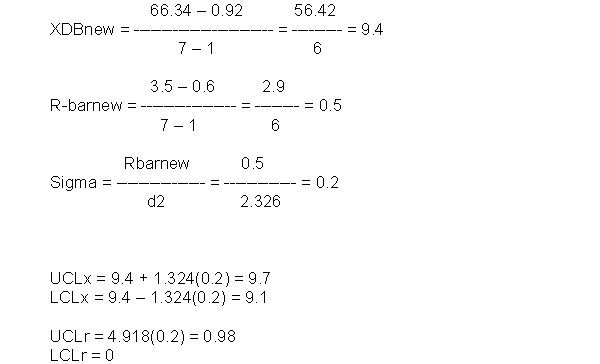
Point 4, X-bar = 9.92, R = 0.6
2
Create control charts using the following information concerning the fill level of 12 oz. beverage containers. Sum of X-bars = 301.47, Sum of R's = 7.85, m = 25, n = 5.
3
Describe the six guides for interpreting a control chart of any type.
a. 2/3 of the points are near the center value.
b. A few of the points are on or near the center value.
c. The points appear to float back and forth across the centerline.
d. The points are balanced on both sides of the centerline.
e. There are no points beyond the control limits.
f. There are no patterns or trends on the chart.
b. A few of the points are on or near the center value.
c. The points appear to float back and forth across the centerline.
d. The points are balanced on both sides of the centerline.
e. There are no points beyond the control limits.
f. There are no patterns or trends on the chart.
4
Hotels often monitor the services they provide with X-bar and R charts. The following information comes from customer satisfaction data related to breakfast. Each point represents one week of scores. The average given is for a sample size n = 7 (one week of breakfasts). A 100 is the highest possible score, on a scale of 1-100. Create an X-bar and R chart with the following information.
Unlock Deck
Unlock for access to all 10 flashcards in this deck.
Unlock Deck
k this deck
5
Hospitals are very interested in improving health care processes. Many hospitals have begun to implement statistical process control techniques in order to monitor and improve their processes. One such hospital is using X-bar and R charts to monitor the turnaround time for stress tests. Turnaround time refers to the amount of time that elapses between the patient taking the test and the doctor receiving the results of the test. Use the following information to calculate the control limits and centerline for an X-bar and R chart. n = 6.
Unlock Deck
Unlock for access to all 10 flashcards in this deck.
Unlock Deck
k this deck
6
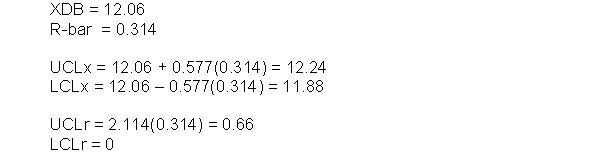
Though only seven averages and range values are available, the engineers studying the olive bottle filling process have decided to create X-bar and R charts for the samples measuring the air gap in the bottle. Calculate the centerline and control limits for the following information: Sum of X-bars = 339.4 Sum of R's = 3.4 m = 7, n = 5
Unlock Deck
Unlock for access to all 10 flashcards in this deck.
Unlock Deck
k this deck
7
Hospitals are very interested in improving health care processes. Many hospitals have begun to implement statistical process control techniques in order to monitor and improve their processes. One such hospital is using X-bar and s charts to monitor the turnaround time for stress tests. Turnaround time refers to the amount of time that elapses between the patient taking the test and the doctor receiving the results of the test. Use the following information to calculate the control limits and centerline for X-bar and s charts (n = 9).
Unlock Deck
Unlock for access to all 10 flashcards in this deck.
Unlock Deck
k this deck
8
Why is it critical to study the R or s chart when interpreting a process?
Unlock Deck
Unlock for access to all 10 flashcards in this deck.
Unlock Deck
k this deck
9
What does the X-bar chart show users? What does the R chart show users?
Unlock Deck
Unlock for access to all 10 flashcards in this deck.
Unlock Deck
k this deck
10
Why are Six Sigma organizations interested in reducing the variation present in a process?
Unlock Deck
Unlock for access to all 10 flashcards in this deck.
Unlock Deck
k this deck
Unlock Deck
Unlock for access to all 10 flashcards in this deck.


