Deck 5: Key Concept- the Definite Integral
Full screen (f)
Question
Question
Question
Consider the region A shown in the following graph.Is the area of A more or less than 0.7? 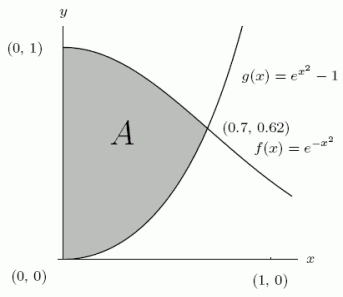
Question
Question
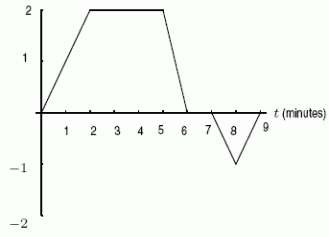
The figure below shows the graph of the velocity, v, of an object (in meters/sec.).If the graph were shifted up two units, what would it mean for the motion of the object? 
A)The velocity at each time would be 2 m/sec greater.
B)The velocity at each time would be 12 m/sec greater.
C)The velocity at each time would be 20 m/sec greater.
D)The velocity at each time would be 120 m/sec greater.
E)The velocity at each time would be the same.
A)The velocity at each time would be 2 m/sec greater.
B)The velocity at each time would be 12 m/sec greater.
C)The velocity at each time would be 20 m/sec greater.
D)The velocity at each time would be 120 m/sec greater.
E)The velocity at each time would be the same.
Question
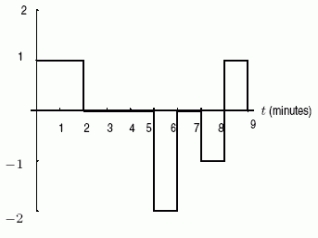
What does the following figure represent? 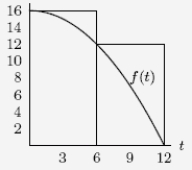
A)The right-hand Riemann sum for the function f on the interval 0 t 12 with t = 3.
B)The right-hand Riemann sum for the function f on the interval 0 t 12 with t = 6.
C)The left-hand Riemann sum for the function f on the interval 0 t 12 with t = 3.
D)The left-hand Riemann sum for the function f on the interval 0 t 12 with t = 6.
Question
Consider a sports car which accelerates from 0 ft/sec to 88 ft/sec in 5 seconds (88 ft/sec = 60mph).The car's velocity is given in the table below.
 Find the lower bound for the distance the car travels in 5 seconds.
Find the lower bound for the distance the car travels in 5 seconds. Question
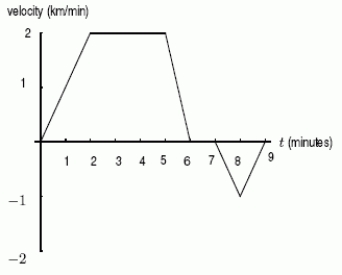
Two greyhound racing dogs, A and B, start at the same time and travel in the same direction along a straight track.The figure below gives the velocity, v, of each dog as a function of time t.Which dog travels the farthest? 
Question
Question
Question
The figure below shows the graph of the velocity, v, of an object (in meters/sec.).If the graph were shifted up 4 units, how would the total distance traveled between t = 0 and t = 6 change? 
A)It would increase by 4 units.
B)It would increase by 24 units.
C)It would remain the same.
D)It would decrease by 4 units.
E)It would decrease by 24 units.
A)It would increase by 4 units.
B)It would increase by 24 units.
C)It would remain the same.
D)It would decrease by 4 units.
E)It would decrease by 24 units.
Question
Question
The graph shown below is that of the velocity of an object (in meters/second).Find a lower estimate of the total distance traveled from t = 0 to t =5 seconds 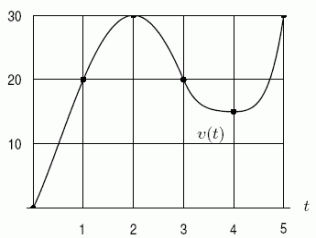 .
.
. Question
A car is observed to have the following velocities at times t = 0, 2, 4, 6:
 Give the lower estimate for the distance the car traveled.
Give the lower estimate for the distance the car traveled. Question
If an upper estimate of the area of a region bounded by the curve in the following figure, the horizontal axis and the vertical lines x = 3 and x = -3 is 15, what is the upper estimate if the graph is shifted up one unit? 
Question
Question
Question
Using the following figure, calculate the value of the right-hand Riemann sum f on the interval 0 t 12 with t = 6. 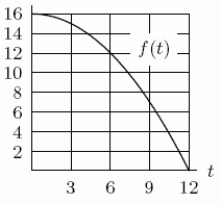
Question
Question
Question
What is the value of if the area of A = 15 and the area of B = -4? 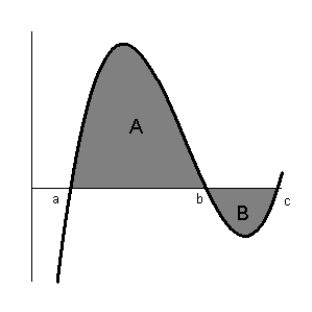
A)5.5
B)22
C)-11
D)11
E)19
A)5.5
B)22
C)-11
D)11
E)19
Question
What is the value of if the area of A = 9 and the area of B = -2? 
A)3.5
B)14
C)-7
D)7
E)11
A)3.5
B)14
C)-7
D)7
E)11
Question
Below is the graph of the rate r in arrivals/minute at which students line up for breakfast at the Cafeteria Charlotte.The first people arrive at 6:50a.m.and the line opens at 7:00a.m.Suppose that once the line is open, checkers can check peoples' meal cards at a constant rate of 20 people per minute.Use the graph and this information to find an estimate for the length of the line (i.e.the number of people)at 7:10. 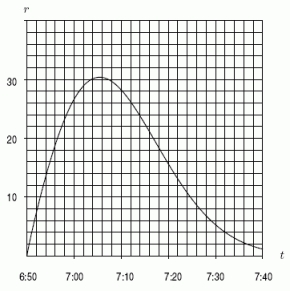
A)200
B)230
C)260
D)290
A)200
B)230
C)260
D)290
Question
Question
Estimate the area of the region under the curve  and above the x-axis for
  .Round to 3 decimal places.
and above the x-axis for .Round to 3 decimal places. Question
Question
A car is moving along a straight road from A to B, starting from A at time t = 0.Below is the velocity (positive direction is from A to
B)plotted against time.
How many kilometers away from A is the car at time t = 9?
B)plotted against time.
How many kilometers away from A is the car at time t = 9?
Question
A shop is open from 9am-7pm.The function r(t), graphed below, gives the rate at which customers arrive (in people/hour)at time t.Suppose that the salespeople can serve customers at a rate of 60 people per hour.When do people have to start waiting in line before being served? Answer to the nearest half-hour.You do not need to include "am" or "pm". 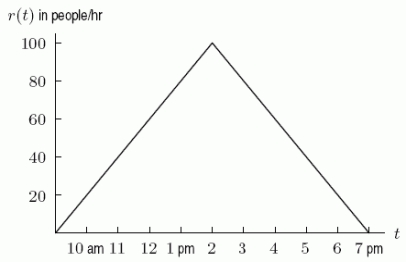
Question
Question
Find the average value of ![Find the average value of over [1, 3].<div style=padding-top: 35px>](https://storage.examlex.com/TB4204/11eb1831_d950_3ad3_88c1_7f9d35eb0f1f_TB4204_11.jpg) over [1, 3].
over [1, 3].
over [1, 3]. Question
Question
Below is the graph of the velocity, in feet per second, of a hat that is thrown up in the air from ground level.Positive velocity means upward motion. [Note that this is the graph of velocity, not distance.] ![<strong>Below is the graph of the velocity, in feet per second, of a hat that is thrown up in the air from ground level.Positive velocity means upward motion. [Note that this is the graph of velocity, not distance.] About how big is the average speed over the first 4 seconds?</strong> A)13.1 ft/sec B)10.8 ft/sec C)6.8 ft/sec D)4.4 ft/sec <div style=padding-top: 35px>](https://storage.examlex.com/TB4204/11eb1831_d950_13c2_88c1_f1ce6f0fd7c7_TB4204_00.jpg) About how big is the average speed over the first 4 seconds?
About how big is the average speed over the first 4 seconds?
A)13.1 ft/sec
B)10.8 ft/sec
C)6.8 ft/sec
D)4.4 ft/sec
About how big is the average speed over the first 4 seconds?A)13.1 ft/sec
B)10.8 ft/sec
C)6.8 ft/sec
D)4.4 ft/sec
Question
Does the quantity 
 represent a length or an area in the picture?
A)An area
B)A length
represent a length or an area in the picture? A)An area
B)A length
Question
A car is moving along a straight road from A to B, starting from A at time t = 0.Below are graphs of the velocity and the acceleration plotted against time (positive direction is from A to B)
A)The one on the right
B)The one on the left. Which graph shows the velocity?
A)The one on the right
B)The one on the left. Which graph shows the velocity?
Question
Find the average value of ![Find the average value of over [0, 2].Round to the nearest whole number.<div style=padding-top: 35px>](https://storage.examlex.com/TB4204/11eb1831_d950_3ad4_88c1_19d2a40c3379_TB4204_11.jpg) over [0, 2].Round to the nearest whole number.
over [0, 2].Round to the nearest whole number.
over [0, 2].Round to the nearest whole number. Question
Question
How can the quantity f(a)h be represented in the picture? 
A)By the slope of TV
B)By the length of UR
C)By the area of PQRS
D)By the area of QRU
A)By the slope of TV
B)By the length of UR
C)By the area of PQRS
D)By the area of QRU
Question
Question
The velocity and acceleration of an object are given by the graphs shown below, where .Which graph shows acceleration? 
A)The one on the left.
B)The one on the right.
A)The one on the left.
B)The one on the right.
Question
Question
If  and
and  is odd, what is
  ?
?
and is odd, what is ? Question
Question
A potato is cooking in an oven.Explain in words what 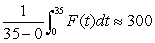 means if
  is the temperature of the potato, in degrees Farenheit, and t is time, in minutes.
means if is the temperature of the potato, in degrees Farenheit, and t is time, in minutes. Question
Explain in words what  means if
  is velocity in miles/hour and t is time, in hours.
means if is velocity in miles/hour and t is time, in hours. Question
Question
Suppose  ,
,  ,
,  , and
, and 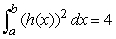 .Find
.Find 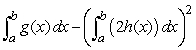 .
.
, , , and .Find . Question
Question
If 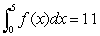 and
and 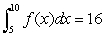 , what is
  ?
?
and , what is ? Question
If  and
and  is even, and
  ?what is
  ?
?
and is even, and ?what is ? Question
Question
If  and
and  , evaluate
  .
.
and , evaluate . Question
Evaluate the definite integral  .
.
. Question
If f is even and  , what is
  ?
?
, what is ? Question
Question
What is the value of  ?
?
? Question
Evaluate 
Question
Question
Suppose f(t)is given by the graph below.If 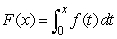 , what is
  ?
? 
, what is ? Question
Suppose  ,
,  ,
,  , and
, and  .Find
.Find  .
.
, , , and .Find . Question
Question
Question

Unlock Deck
Sign up to unlock the cards in this deck!
Unlock Deck
Unlock Deck
1/62
Play
Full screen (f)
Deck 5: Key Concept- the Definite Integral
1
Estimate to 1 decimal place, choosing a suitable x.
1.2
2
At time t, in seconds, the velocity, v, in miles per hour, of a car is given by for .A second car travels exactly 15 miles per hour faster than the first car.Using t = 2, the right-hand estimate for the distance traveled during this time by the first car is 143 miles.What is the right-hand estimate for the distance traveled during this time by the second car?
263 miles
3
Consider the region A shown in the following graph.Is the area of A more or less than 0.7?
less
4
At time t, in seconds, your velocity v, in meters/sec, is given by for .Which is more accurate?
A)An estimate of the distance traveled during this time using t = 1.
B)An estimate of the distance traveled during this time using F t = 2.
A)An estimate of the distance traveled during this time using t = 1.
B)An estimate of the distance traveled during this time using F t = 2.
Unlock Deck
Unlock for access to all 62 flashcards in this deck.
Unlock Deck
k this deck
5
The figure below shows the graph of the velocity, v, of an object (in meters/sec.).If the graph were shifted up two units, what would it mean for the motion of the object?
A)The velocity at each time would be 2 m/sec greater.
B)The velocity at each time would be 12 m/sec greater.
C)The velocity at each time would be 20 m/sec greater.
D)The velocity at each time would be 120 m/sec greater.
E)The velocity at each time would be the same.
A)The velocity at each time would be 2 m/sec greater.
B)The velocity at each time would be 12 m/sec greater.
C)The velocity at each time would be 20 m/sec greater.
D)The velocity at each time would be 120 m/sec greater.
E)The velocity at each time would be the same.
Unlock Deck
Unlock for access to all 62 flashcards in this deck.
Unlock Deck
k this deck
6
What does the following figure represent?
A)The right-hand Riemann sum for the function f on the interval 0 t 12 with t = 3.
B)The right-hand Riemann sum for the function f on the interval 0 t 12 with t = 6.
C)The left-hand Riemann sum for the function f on the interval 0 t 12 with t = 3.
D)The left-hand Riemann sum for the function f on the interval 0 t 12 with t = 6.
Unlock Deck
Unlock for access to all 62 flashcards in this deck.
Unlock Deck
k this deck
7
Consider a sports car which accelerates from 0 ft/sec to 88 ft/sec in 5 seconds (88 ft/sec = 60mph).The car's velocity is given in the table below.
Find the lower bound for the distance the car travels in 5 seconds.
Find the lower bound for the distance the car travels in 5 seconds. Unlock Deck
Unlock for access to all 62 flashcards in this deck.
Unlock Deck
k this deck
8
Two greyhound racing dogs, A and B, start at the same time and travel in the same direction along a straight track.The figure below gives the velocity, v, of each dog as a function of time t.Which dog travels the farthest?
Unlock Deck
Unlock for access to all 62 flashcards in this deck.
Unlock Deck
k this deck
9
At time t, in seconds, your velocity v, in meters/sec, is given by for .Use t = 1 to estimate distance during this time.(Average right- and left-hand sums).
Unlock Deck
Unlock for access to all 62 flashcards in this deck.
Unlock Deck
k this deck
10
Estimate the area of the region above the curve and below y = 7 for 0 x /2.Round to 2 decimal places.
Unlock Deck
Unlock for access to all 62 flashcards in this deck.
Unlock Deck
k this deck
11
The figure below shows the graph of the velocity, v, of an object (in meters/sec.).If the graph were shifted up 4 units, how would the total distance traveled between t = 0 and t = 6 change?
A)It would increase by 4 units.
B)It would increase by 24 units.
C)It would remain the same.
D)It would decrease by 4 units.
E)It would decrease by 24 units.
A)It would increase by 4 units.
B)It would increase by 24 units.
C)It would remain the same.
D)It would decrease by 4 units.
E)It would decrease by 24 units.
Unlock Deck
Unlock for access to all 62 flashcards in this deck.
Unlock Deck
k this deck
12
Use the table to estimate with n = 5 and x = 10.(Average left-and right-hand sums).
Unlock Deck
Unlock for access to all 62 flashcards in this deck.
Unlock Deck
k this deck
13
The graph shown below is that of the velocity of an object (in meters/second).Find a lower estimate of the total distance traveled from t = 0 to t =5 seconds .
. Unlock Deck
Unlock for access to all 62 flashcards in this deck.
Unlock Deck
k this deck
14
A car is observed to have the following velocities at times t = 0, 2, 4, 6:
Give the lower estimate for the distance the car traveled.
Give the lower estimate for the distance the car traveled. Unlock Deck
Unlock for access to all 62 flashcards in this deck.
Unlock Deck
k this deck
15
If an upper estimate of the area of a region bounded by the curve in the following figure, the horizontal axis and the vertical lines x = 3 and x = -3 is 15, what is the upper estimate if the graph is shifted up one unit?
Unlock Deck
Unlock for access to all 62 flashcards in this deck.
Unlock Deck
k this deck
16
At time t, in seconds, your velocity v, in meters/sec, is given by for .Use t = 2 to estimate distance during this time.(Average right- and left-hand sums).
Unlock Deck
Unlock for access to all 62 flashcards in this deck.
Unlock Deck
k this deck
17
Consider a sports car which accelerates from 0 ft/sec to 88 ft/sec in 5 seconds (88 ft/sec = 60mph).The car's velocity is given in the table below. In which time interval is the average acceleration smallest?
A)Between t = 4 and t = 5.
B)Between t = 3 and t = 4.
C)Between t = 2 and t = 3.
D)Between t = 1 and t = 2.
E)Between t = 0 and t = 1.
A)Between t = 4 and t = 5.
B)Between t = 3 and t = 4.
C)Between t = 2 and t = 3.
D)Between t = 1 and t = 2.
E)Between t = 0 and t = 1.
Unlock Deck
Unlock for access to all 62 flashcards in this deck.
Unlock Deck
k this deck
18
Using the following figure, calculate the value of the right-hand Riemann sum f on the interval 0 t 12 with t = 6.
Unlock Deck
Unlock for access to all 62 flashcards in this deck.
Unlock Deck
k this deck
19
A particle starting at the origin moves along the x-axis such that its velocity along the line can be modeled by the function v(t)= 2 - 6t units/sec.What is the exact change in position by the function from t = 0 to t = 1.333333?
A)-2.667 units
B)-5.333 units
C)-4.333 units
D)-6.333 units
E)-6.833 units
A)-2.667 units
B)-5.333 units
C)-4.333 units
D)-6.333 units
E)-6.833 units
Unlock Deck
Unlock for access to all 62 flashcards in this deck.
Unlock Deck
k this deck
20
At time t, in seconds, the velocity, v, in miles per hour, of a car is given by for .Use t = 2 to estimate the distance traveled during this time.Give the right-hand sum.
Unlock Deck
Unlock for access to all 62 flashcards in this deck.
Unlock Deck
k this deck
21
What is the value of if the area of A = 15 and the area of B = -4?
A)5.5
B)22
C)-11
D)11
E)19
A)5.5
B)22
C)-11
D)11
E)19
Unlock Deck
Unlock for access to all 62 flashcards in this deck.
Unlock Deck
k this deck
22
What is the value of if the area of A = 9 and the area of B = -2?
A)3.5
B)14
C)-7
D)7
E)11
A)3.5
B)14
C)-7
D)7
E)11
Unlock Deck
Unlock for access to all 62 flashcards in this deck.
Unlock Deck
k this deck
23
Below is the graph of the rate r in arrivals/minute at which students line up for breakfast at the Cafeteria Charlotte.The first people arrive at 6:50a.m.and the line opens at 7:00a.m.Suppose that once the line is open, checkers can check peoples' meal cards at a constant rate of 20 people per minute.Use the graph and this information to find an estimate for the length of the line (i.e.the number of people)at 7:10.
A)200
B)230
C)260
D)290
A)200
B)230
C)260
D)290
Unlock Deck
Unlock for access to all 62 flashcards in this deck.
Unlock Deck
k this deck
24
Estimate the area of the region between y = cos x, y = 3x, x = - /2, and x = 0.Round to 3 decimal places.
Unlock Deck
Unlock for access to all 62 flashcards in this deck.
Unlock Deck
k this deck
25
Estimate the area of the region under the curve and above the x-axis for .Round to 3 decimal places.
and above the x-axis for .Round to 3 decimal places. Unlock Deck
Unlock for access to all 62 flashcards in this deck.
Unlock Deck
k this deck
26
Which of the following best approximates ?
A)1.44
B)1.49
C)1.54
D)1.59
E)1.64
A)1.44
B)1.49
C)1.54
D)1.59
E)1.64
Unlock Deck
Unlock for access to all 62 flashcards in this deck.
Unlock Deck
k this deck
27
A car is moving along a straight road from A to B, starting from A at time t = 0.Below is the velocity (positive direction is from A to
B)plotted against time.
How many kilometers away from A is the car at time t = 9?
B)plotted against time.
How many kilometers away from A is the car at time t = 9?
Unlock Deck
Unlock for access to all 62 flashcards in this deck.
Unlock Deck
k this deck
28
A shop is open from 9am-7pm.The function r(t), graphed below, gives the rate at which customers arrive (in people/hour)at time t.Suppose that the salespeople can serve customers at a rate of 60 people per hour.When do people have to start waiting in line before being served? Answer to the nearest half-hour.You do not need to include "am" or "pm".
Unlock Deck
Unlock for access to all 62 flashcards in this deck.
Unlock Deck
k this deck
29
Calculate the area under the curve y= 3x +3 for values between [1, 4].
A)15.75
B)157.5
C)993.25
D)10.5
E)31.5
A)15.75
B)157.5
C)993.25
D)10.5
E)31.5
Unlock Deck
Unlock for access to all 62 flashcards in this deck.
Unlock Deck
k this deck
30
Find the average value of over [1, 3].
over [1, 3]. Unlock Deck
Unlock for access to all 62 flashcards in this deck.
Unlock Deck
k this deck
31
The average value of a function g on 0 x 2 is a constant given by .Also, , since is a square.Which of the following must be true?
A)
B)
C)
D)None of these
A)
B)
C)
D)None of these
Unlock Deck
Unlock for access to all 62 flashcards in this deck.
Unlock Deck
k this deck
32
Below is the graph of the velocity, in feet per second, of a hat that is thrown up in the air from ground level.Positive velocity means upward motion. [Note that this is the graph of velocity, not distance.] About how big is the average speed over the first 4 seconds?
A)13.1 ft/sec
B)10.8 ft/sec
C)6.8 ft/sec
D)4.4 ft/sec
About how big is the average speed over the first 4 seconds?A)13.1 ft/sec
B)10.8 ft/sec
C)6.8 ft/sec
D)4.4 ft/sec
Unlock Deck
Unlock for access to all 62 flashcards in this deck.
Unlock Deck
k this deck
33
Does the quantity represent a length or an area in the picture?
A)An area
B)A length
represent a length or an area in the picture? A)An area
B)A length
Unlock Deck
Unlock for access to all 62 flashcards in this deck.
Unlock Deck
k this deck
34
A car is moving along a straight road from A to B, starting from A at time t = 0.Below are graphs of the velocity and the acceleration plotted against time (positive direction is from A to B)
A)The one on the right
B)The one on the left. Which graph shows the velocity?
A)The one on the right
B)The one on the left. Which graph shows the velocity?
Unlock Deck
Unlock for access to all 62 flashcards in this deck.
Unlock Deck
k this deck
35
Find the average value of over [0, 2].Round to the nearest whole number.
over [0, 2].Round to the nearest whole number. Unlock Deck
Unlock for access to all 62 flashcards in this deck.
Unlock Deck
k this deck
36
The velocity of an object is given by , and the acceleration is given by .What is the relationship between the total change in v(t)over the interval 0 t 10 and a(t)?
A)
B)
C)
D)
A)
B)
C)
D)
Unlock Deck
Unlock for access to all 62 flashcards in this deck.
Unlock Deck
k this deck
37
How can the quantity f(a)h be represented in the picture?
A)By the slope of TV
B)By the length of UR
C)By the area of PQRS
D)By the area of QRU
A)By the slope of TV
B)By the length of UR
C)By the area of PQRS
D)By the area of QRU
Unlock Deck
Unlock for access to all 62 flashcards in this deck.
Unlock Deck
k this deck
38
Rashmi and Tia both go running from 7:00am to 8:00am.Both women increase their velocity throughout the hour, both beginning at a rate of 9 mi/hr.at 7:00am and running at a rate of 13 mi/hr by 8:00am.Tia's velocity increases at an increasing rate and Rashmi's velocity increases at a decreasing rate.Who has the greatest average velocity? If they had the same average velocity, enter "same".
Unlock Deck
Unlock for access to all 62 flashcards in this deck.
Unlock Deck
k this deck
39
The velocity and acceleration of an object are given by the graphs shown below, where .Which graph shows acceleration?
A)The one on the left.
B)The one on the right.
A)The one on the left.
B)The one on the right.
Unlock Deck
Unlock for access to all 62 flashcards in this deck.
Unlock Deck
k this deck
40
The average value of a function g on 0 F x 3 is a constant given by .Which of the following must be true?
A)
B)
C)
D)None of the above
A)
B)
C)
D)None of the above
Unlock Deck
Unlock for access to all 62 flashcards in this deck.
Unlock Deck
k this deck
41
If and is odd, what is ?
and is odd, what is ? Unlock Deck
Unlock for access to all 62 flashcards in this deck.
Unlock Deck
k this deck
42
If r(t)represents the rate at which a country's debt is growing, then the increase in its debt between 1990 and 2000 is given by
A)
B)
C)
D)
E)
A)
B)
C)
D)
E)
Unlock Deck
Unlock for access to all 62 flashcards in this deck.
Unlock Deck
k this deck
43
A potato is cooking in an oven.Explain in words what means if is the temperature of the potato, in degrees Farenheit, and t is time, in minutes.
means if is the temperature of the potato, in degrees Farenheit, and t is time, in minutes. Unlock Deck
Unlock for access to all 62 flashcards in this deck.
Unlock Deck
k this deck
44
Explain in words what means if is velocity in miles/hour and t is time, in hours.
means if is velocity in miles/hour and t is time, in hours. Unlock Deck
Unlock for access to all 62 flashcards in this deck.
Unlock Deck
k this deck
45
If represents the energy consumed in a household in watts/month, what are the units of ?
A)watts
B)watts/month
C)watts/month2
D)month
E)watts2/month2
A)watts
B)watts/month
C)watts/month2
D)month
E)watts2/month2
Unlock Deck
Unlock for access to all 62 flashcards in this deck.
Unlock Deck
k this deck
46
Suppose , , , and .Find .
, , , and .Find . Unlock Deck
Unlock for access to all 62 flashcards in this deck.
Unlock Deck
k this deck
47
If and g(x)= x + 1, how do and compare?
A) <
B) >
C) =
A) <
B) >
C) =
Unlock Deck
Unlock for access to all 62 flashcards in this deck.
Unlock Deck
k this deck
48
If and , what is ?
and , what is ? Unlock Deck
Unlock for access to all 62 flashcards in this deck.
Unlock Deck
k this deck
49
If and is even, and ?what is ?
and is even, and ?what is ? Unlock Deck
Unlock for access to all 62 flashcards in this deck.
Unlock Deck
k this deck
50
Suppose A = the area under the curve over the interval -5 x 5.Which of the following is/are true?
A) , where .
B)
C)
D)
A) , where .
B)
C)
D)
Unlock Deck
Unlock for access to all 62 flashcards in this deck.
Unlock Deck
k this deck
51
If and , evaluate .
and , evaluate . Unlock Deck
Unlock for access to all 62 flashcards in this deck.
Unlock Deck
k this deck
52
Evaluate the definite integral .
. Unlock Deck
Unlock for access to all 62 flashcards in this deck.
Unlock Deck
k this deck
53
If f is even and , what is ?
, what is ? Unlock Deck
Unlock for access to all 62 flashcards in this deck.
Unlock Deck
k this deck
54
The average value of y = h(x)equals a for 0 x 5, and equals b for 5 x 15.What is the average value of h(x)for 0 x 15?
A)
B)
C)
D)
A)
B)
C)
D)
Unlock Deck
Unlock for access to all 62 flashcards in this deck.
Unlock Deck
k this deck
55
What is the value of ?
? Unlock Deck
Unlock for access to all 62 flashcards in this deck.
Unlock Deck
k this deck
56
Evaluate
Unlock Deck
Unlock for access to all 62 flashcards in this deck.
Unlock Deck
k this deck
57
Let .If f(x)is even, what is ?
A)
B)
C)
D)
E)0
A)
B)
C)
D)
E)0
Unlock Deck
Unlock for access to all 62 flashcards in this deck.
Unlock Deck
k this deck
58
Suppose f(t)is given by the graph below.If , what is ?
, what is ? Unlock Deck
Unlock for access to all 62 flashcards in this deck.
Unlock Deck
k this deck
59
Suppose , , , and .Find .
, , , and .Find . Unlock Deck
Unlock for access to all 62 flashcards in this deck.
Unlock Deck
k this deck
60
Let .What is the average value of f(x)on the interval x = 0 to x = 10?
A)
B)C
C)
D)0
A)
B)C
C)
D)0
Unlock Deck
Unlock for access to all 62 flashcards in this deck.
Unlock Deck
k this deck
61
If a function is concave up, then the left-hand Riemann sums are always less than the right-hand Riemann sums with the same subdivisions, over the same interval.
Unlock Deck
Unlock for access to all 62 flashcards in this deck.
Unlock Deck
k this deck
62
If , then f must have at least one zero between a and b (assume a b).
Unlock Deck
Unlock for access to all 62 flashcards in this deck.
Unlock Deck
k this deck
Unlock Deck
Unlock for access to all 62 flashcards in this deck.


