Deck 12: Analysis of Quantitative Data
Full screen (f)
Question
Question
Question
Question
Question
Question
Question
Question
Question
Question
Question
Question
Question
Question
Question
Question
Question
Question
Question
Question
Question
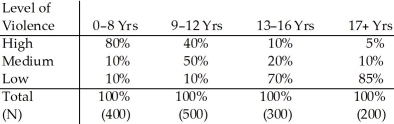
Refer to the information provided below to answer the following questions.
Table 12.4: Education by Violence in Crime Education Level of Offender
The mean is
A) 8
B) 8.5
C) 10
D) 9.5
Table 12.4: Education by Violence in Crime Education Level of Offender
The mean is
A) 8
B) 8.5
C) 10
D) 9.5
Question
Refer to the following paragraph to answer the questions below.
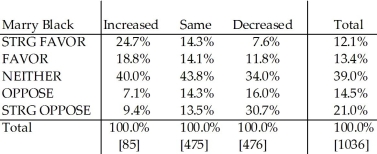
Researchers debate the degree to which racism is a major source of White anti-immigrant attitudes in the United States, since most recent immigrants are non-White. To examine this relationship, I used a measure of racial prejudice among Whites not wanting a Black person to marry a close relative and cross-tabulated it with a opinion question about immigration using data from the 2000 General Social Survey. The variables are percentaged both by row and by column. MARRY BLACK: How would you respond to a close relative marrying a Black person?
Strongly Favor, Favor, Neither Favor or Oppose, Oppose, Strongly Oppose. IMMIGRANTS: Should the number of people coming from other countries to the U.S. as immigrants be increased, stay the same, or decreased? Data only for Race = White, GSS 2000.
Note: Missing data, Don't Know, No Answer removed from Table. Immigrant response collapsed into 3 categories: Increase At lot and Increase a Little combined into Increase, Same, Decrease a little and Decrease a lot are combined into Decrease.
Column Percentage
Immigrants
 Row Percentage
Immigrants
You discover that the years of marriage before a divorce for nine Whites and nine non-Whites are as follows: Whites 12, 1, 8, 9, 10, 17, 3, 6, 6 Non-Whites 1, 9, 15, 18, 11, 13, 14, 7, 3
Which statement about this data is TRUE?
A) On average, non-Whites stay married longer prior to divorce than the Whites.
B) There is no difference in the range for the two groups.
C) The mean years of marriage prior to divorce are the same for both groups.
D) The median years of marriage prior to divorce are three years longer for Whites than non-whites.
Researchers debate the degree to which racism is a major source of White anti-immigrant attitudes in the United States, since most recent immigrants are non-White. To examine this relationship, I used a measure of racial prejudice among Whites not wanting a Black person to marry a close relative and cross-tabulated it with a opinion question about immigration using data from the 2000 General Social Survey. The variables are percentaged both by row and by column. MARRY BLACK: How would you respond to a close relative marrying a Black person?
Strongly Favor, Favor, Neither Favor or Oppose, Oppose, Strongly Oppose. IMMIGRANTS: Should the number of people coming from other countries to the U.S. as immigrants be increased, stay the same, or decreased? Data only for Race = White, GSS 2000.
Note: Missing data, Don't Know, No Answer removed from Table. Immigrant response collapsed into 3 categories: Increase At lot and Increase a Little combined into Increase, Same, Decrease a little and Decrease a lot are combined into Decrease.
Column Percentage
Immigrants
Row PercentageImmigrants
You discover that the years of marriage before a divorce for nine Whites and nine non-Whites are as follows: Whites 12, 1, 8, 9, 10, 17, 3, 6, 6 Non-Whites 1, 9, 15, 18, 11, 13, 14, 7, 3
Which statement about this data is TRUE?
A) On average, non-Whites stay married longer prior to divorce than the Whites.
B) There is no difference in the range for the two groups.
C) The mean years of marriage prior to divorce are the same for both groups.
D) The median years of marriage prior to divorce are three years longer for Whites than non-whites.
Question
Question
Question
Refer to the information provided below to answer the following questions.
Table 12.4: Education by Violence in Crime Education Level of Offender
The mode is
A) 8
B) 8.5
C) 10
D) 9.5
Table 12.4: Education by Violence in Crime Education Level of Offender
The mode is
A) 8
B) 8.5
C) 10
D) 9.5
Question
Refer to the following paragraph to answer the questions below.
Researchers debate the degree to which racism is a major source of White anti-immigrant attitudes in the United States, since most recent immigrants are non-White. To examine this relationship, I used a measure of racial prejudice among Whites not wanting a Black person to marry a close relative and cross-tabulated it with a opinion question about immigration using data from the 2000 General Social Survey. The variables are percentaged both by row and by column. MARRY BLACK: How would you respond to a close relative marrying a Black person?
Strongly Favor, Favor, Neither Favor or Oppose, Oppose, Strongly Oppose. IMMIGRANTS: Should the number of people coming from other countries to the U.S. as immigrants be increased, stay the same, or decreased? Data only for Race = White, GSS 2000.
Note: Missing data, Don't Know, No Answer removed from Table. Immigrant response collapsed into 3 categories: Increase At lot and Increase a Little combined into Increase, Same, Decrease a little and Decrease a lot are combined into Decrease.
Column Percentage
Immigrants
Row Percentage
Immigrants
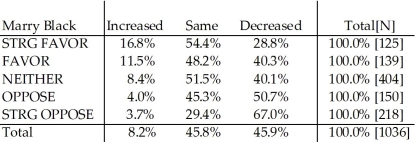
What percentage of Whites, who strongly accept the idea of a close relative marrying a Black person also support increased immigration into the United States?
A) 3.7%
B) 9.4%
C) 16.8%
D) 24.7%
Researchers debate the degree to which racism is a major source of White anti-immigrant attitudes in the United States, since most recent immigrants are non-White. To examine this relationship, I used a measure of racial prejudice among Whites not wanting a Black person to marry a close relative and cross-tabulated it with a opinion question about immigration using data from the 2000 General Social Survey. The variables are percentaged both by row and by column. MARRY BLACK: How would you respond to a close relative marrying a Black person?
Strongly Favor, Favor, Neither Favor or Oppose, Oppose, Strongly Oppose. IMMIGRANTS: Should the number of people coming from other countries to the U.S. as immigrants be increased, stay the same, or decreased? Data only for Race = White, GSS 2000.
Note: Missing data, Don't Know, No Answer removed from Table. Immigrant response collapsed into 3 categories: Increase At lot and Increase a Little combined into Increase, Same, Decrease a little and Decrease a lot are combined into Decrease.
Column Percentage
Immigrants
Row PercentageImmigrants
What percentage of Whites, who strongly accept the idea of a close relative marrying a Black person also support increased immigration into the United States?
A) 3.7%
B) 9.4%
C) 16.8%
D) 24.7%
Question
Question
Question
Refer to the following paragraph to answer the questions below.
Researchers debate the degree to which racism is a major source of White anti-immigrant attitudes in the United States, since most recent immigrants are non-White. To examine this relationship, I used a measure of racial prejudice among Whites not wanting a Black person to marry a close relative and cross-tabulated it with a opinion question about immigration using data from the 2000 General Social Survey. The variables are percentaged both by row and by column. MARRY BLACK: How would you respond to a close relative marrying a Black person?
Strongly Favor, Favor, Neither Favor or Oppose, Oppose, Strongly Oppose. IMMIGRANTS: Should the number of people coming from other countries to the U.S. as immigrants be increased, stay the same, or decreased? Data only for Race = White, GSS 2000.
Note: Missing data, Don't Know, No Answer removed from Table. Immigrant response collapsed into 3 categories: Increase At lot and Increase a Little combined into Increase, Same, Decrease a little and Decrease a lot are combined into Decrease.
Column Percentage
Immigrants
Row Percentage
Immigrants
Looking at data from the above two tables, which of the following is TRUE?
A) Over one-half of Whites who strongly oppose having a relative marrying a Black person also want a decrease in immigrants coming to the U.S.
B) Among all Whites in the U.S., a substantial majority wants immigration to decrease.
C) Among Whites who strongly favor having a relative marrying a Black person, a higher percentage want increased immigration than decreased immigration
D) Over one-half of the Whites who want immigration to stay the same strongly favor a relative marrying a Black person.
Researchers debate the degree to which racism is a major source of White anti-immigrant attitudes in the United States, since most recent immigrants are non-White. To examine this relationship, I used a measure of racial prejudice among Whites not wanting a Black person to marry a close relative and cross-tabulated it with a opinion question about immigration using data from the 2000 General Social Survey. The variables are percentaged both by row and by column. MARRY BLACK: How would you respond to a close relative marrying a Black person?
Strongly Favor, Favor, Neither Favor or Oppose, Oppose, Strongly Oppose. IMMIGRANTS: Should the number of people coming from other countries to the U.S. as immigrants be increased, stay the same, or decreased? Data only for Race = White, GSS 2000.
Note: Missing data, Don't Know, No Answer removed from Table. Immigrant response collapsed into 3 categories: Increase At lot and Increase a Little combined into Increase, Same, Decrease a little and Decrease a lot are combined into Decrease.
Column Percentage
Immigrants
Row PercentageImmigrants
Looking at data from the above two tables, which of the following is TRUE?
A) Over one-half of Whites who strongly oppose having a relative marrying a Black person also want a decrease in immigrants coming to the U.S.
B) Among all Whites in the U.S., a substantial majority wants immigration to decrease.
C) Among Whites who strongly favor having a relative marrying a Black person, a higher percentage want increased immigration than decreased immigration
D) Over one-half of the Whites who want immigration to stay the same strongly favor a relative marrying a Black person.
Question
Question
Question
Refer to the information provided below to answer the following questions.
Table 12.4: Education by Violence in Crime Education Level of Offender
All the sales representatives at Allcity Insurance are female, and their mean annual salary is $60,000 with a standard deviation of $5,000. All customer account managers are male and they have a mean salary of $80,000 with a standard deviation of $15,000. Heather knows she is one standard deviation above the mean of the sales representatives. She wants to transfer to become the first female customer account manager and will begin at her same salary. After she transfers, compared to the customer account managers her salary will be at what z-score?
A) -2
B) -1
C) 0
D) +1
Question
Question
Question
Question
Question
Question
Refer to the information provided below to answer the following questions.
Table 12.4: Education by Violence in Crime Education Level of Offender
The median is
A) 8
B) 8.5
C) 10
D) 9.5
Table 12.4: Education by Violence in Crime Education Level of Offender
The median is
A) 8
B) 8.5
C) 10
D) 9.5
Question
Refer to the information provided below to answer the following questions.
Table 12.4: Education by Violence in Crime Education Level of Offender
Based on Table 12.4, what type of relationship is there between degree of violence in the crime committed and level of education?
A) positive relationship
B) non-linear relationship
C) no relationship, independence
D) negative relationship
Question
Refer to the information provided below to answer the following questions.
Table 12.4: Education by Violence in Crime Education Level of Offender
How many people in the study who have more than a college degree 17+ years education) were arrested for committing a medium violent crime?
A) 160
B) 20
C) 180
D) insufficient information
Table 12.4: Education by Violence in Crime Education Level of Offender
How many people in the study who have more than a college degree 17+ years education) were arrested for committing a medium violent crime?
A) 160
B) 20
C) 180
D) insufficient information
Question
Question
Question
Question
Question
Question
Question
Question
Question

Unlock Deck
Sign up to unlock the cards in this deck!
Unlock Deck
Unlock Deck
1/49
Play
Full screen (f)
Deck 12: Analysis of Quantitative Data
1
You find a positive relationship between mothers' education and respondents' income at age 40. The relationship remained after controlling for family social class. This means
A) social class does not have an effect on the relationship.
B) social class is really the causal variable.
C) income is caused by neither mothers' education level nor social class.
D) the original relationship is spurious.
A) social class does not have an effect on the relationship.
B) social class is really the causal variable.
C) income is caused by neither mothers' education level nor social class.
D) the original relationship is spurious.
A
2
Refer to the information provided in Table 12.1 below to answer the questions that follow.
Table 12.1:
2001 survey of 1,000 randomly selected adult residents of Seattle, Years of schooling by whether or not one agrees with the statement,
"Seattle should require the registration of hand guns with the city police department."
-After examining the bivariate relationship between years of schooling and knowledge about politics, Dr. Bushhead controls for hair color. He finds that the relationship in partial tables is identical to the bivariate tables. In the elaboration paradigm, this is
A) replication pattern.
B) identification pattern.
C) specification pattern.
D) explanation pattern.
replication pattern.
3
Professor Doner asked you to interpret a Pearson product's moment correlation coefficient of .93. You say
A) it indicated an error in calculations.
B) it indicated an exceedingly strong relationship.
C) it indicated a moderate relationship.
D) it indicated a weak relationship.
A) it indicated an error in calculations.
B) it indicated an exceedingly strong relationship.
C) it indicated a moderate relationship.
D) it indicated a weak relationship.
B
4
An example of multivariate analysis would be
A) an analysis of the relationship between type of offense and length of prison sentence.
B) an analysis of the relationship between undergraduate majors and level of position held in a major corporation.
C) an analysis of the relationship between age, sex, and type of restaurant frequented in Santa Fe, New Mexico.
D) an examination of the ages of all women who are corporate executives.
Unlock Deck
Unlock for access to all 49 flashcards in this deck.
Unlock Deck
k this deck
5
In reading a table someone else has constructed, the rule of thumb is
A) if the table is percentaged down, read down.
B) if the table is percentaged across, read across.
C) if the table is percentaged down, read across, and if the table is percentaged across, read up and down.
D) all of the above
A) if the table is percentaged down, read down.
B) if the table is percentaged across, read across.
C) if the table is percentaged down, read across, and if the table is percentaged across, read up and down.
D) all of the above
Unlock Deck
Unlock for access to all 49 flashcards in this deck.
Unlock Deck
k this deck
6
Susan weighs 140 pounds. You learn the mean weight is 130 pounds for the women in her sorority and the standard deviation is 10 pounds. What is Susan's z-score in the distribution weight in the sorority?
A) zero
B) 1.5
C) 1
D) 2
A) zero
B) 1.5
C) 1
D) 2
Unlock Deck
Unlock for access to all 49 flashcards in this deck.
Unlock Deck
k this deck
7
A researcher wants to express the middle of a distribution of numbers, such that half the cases are higher and half lower than a value. What statistical measure should he use?
A) median
B) mean
C) mode
D) standard deviation
A) median
B) mean
C) mode
D) standard deviation
Unlock Deck
Unlock for access to all 49 flashcards in this deck.
Unlock Deck
k this deck
8
A "codebook" is
A) a document that tells the researcher where variables are located in the data file and what numbers go with what variable attributes.
B) the set of instructions that tells interviewers or experimenters how to treat respondents or subjects.
C) an unnecessary part of data analysis since computers were invented.
D) only used in existing statistics research.
Unlock Deck
Unlock for access to all 49 flashcards in this deck.
Unlock Deck
k this deck
9
Phyllis found a strong relationship between a student's level of academic achievement and whether that student came from a single parent and two-parent home. She controlled for the student's race in a trivariate table. She then found that the relationship held only for Asian students. In the elaboration paradigm, this is an example of
A) interpretation pattern.
B) explanation pattern.
C) specification pattern.
D) replication pattern.
A) interpretation pattern.
B) explanation pattern.
C) specification pattern.
D) replication pattern.
Unlock Deck
Unlock for access to all 49 flashcards in this deck.
Unlock Deck
k this deck
10
Use the information in Table 12.2 to answer the following questions.
-In a data set with 100 columns of information, columns 18-23 contain data on respondent income. This set of columns is known as a
A) case.
B) data field.
C) data record.
D) record length.
-In a data set with 100 columns of information, columns 18-23 contain data on respondent income. This set of columns is known as a
A) case.
B) data field.
C) data record.
D) record length.
Unlock Deck
Unlock for access to all 49 flashcards in this deck.
Unlock Deck
k this deck
11
Use the information in Table 12.2 to answer the following questions.
-Which of the following is FALSE based upon the table?
A) A majority 50%) of people with at least a BA degree watch at least 20 hours of television per week.
B) The more education a person has, the less likely he or she is to watch television.
C) About 80 percent of the people with advanced degrees over 18 years of education) watch 10 hours or fewer hours of television per week.
D) A majority 50%) of people with 8 or fewer years of education watch at least 25 hours of television per week.
Unlock Deck
Unlock for access to all 49 flashcards in this deck.
Unlock Deck
k this deck
12
Refer to the information provided in Table 12.3 below to answer the questions that follow.
Table 12.3:
Annual Family Income and Education* Statistics for Three Neighborhoods
*4 yrs college = 16 yrs; masters/law degrees = 18 yrs; Ph.D/MD degrees = 20 yrs.
-Which neighborhood has an income distribution that is close to a normal distribution?
A) Glenbrook
B) Meadowbrook
C) Elmbrook
D) All neighborhoods are normally distributed.
Unlock Deck
Unlock for access to all 49 flashcards in this deck.
Unlock Deck
k this deck
13
Professor Rodriguez found a strong positive relationship between the number of extra-curricular activities in high school and occupational success as an adult. She then controlled for the respondents' family class background upon beginning high school and the relationship vanished. In the elaboration paradigm, this is called
A) explanation pattern.
B) interpretation pattern.
C) specification pattern.
D) replication pattern.
A) explanation pattern.
B) interpretation pattern.
C) specification pattern.
D) replication pattern.
Unlock Deck
Unlock for access to all 49 flashcards in this deck.
Unlock Deck
k this deck
14
Refer to the information provided in Table 12.3 below to answer the questions that follow.
Table 12.3:
Annual Family Income and Education* Statistics for Three Neighborhoods
*4 yrs college = 16 yrs; masters/law degrees = 18 yrs; Ph.D/MD degrees = 20 yrs.
-Which neighborhood has a heavily skewed income distribution?
A) Glenbrook
B) Meadowbrook
C) Elmbrook
D) No neighborhood is skewed.
Table 12.3:
Annual Family Income and Education* Statistics for Three Neighborhoods
*4 yrs college = 16 yrs; masters/law degrees = 18 yrs; Ph.D/MD degrees = 20 yrs.
-Which neighborhood has a heavily skewed income distribution?
A) Glenbrook
B) Meadowbrook
C) Elmbrook
D) No neighborhood is skewed.
Unlock Deck
Unlock for access to all 49 flashcards in this deck.
Unlock Deck
k this deck
15
My daughter wears a size 2 jacket. She went to her favorite clothing store and found that the mean size of the store's stock of jackets is a size 10 with a standard deviation of 4 sizes. What is her z-score in the distribution of the store's jackets?
A) -1.5
B) zero
C) 2
D) -2
A) -1.5
B) zero
C) 2
D) -2
Unlock Deck
Unlock for access to all 49 flashcards in this deck.
Unlock Deck
k this deck
16
Use the information in Table 12.2 to answer the following questions.
-Which best expresses the bivariate relationship between the amount of education and amount of television watched per week?
A) non-linear
B) independent
C) positive
D) negative
-Which best expresses the bivariate relationship between the amount of education and amount of television watched per week?
A) non-linear
B) independent
C) positive
D) negative
Unlock Deck
Unlock for access to all 49 flashcards in this deck.
Unlock Deck
k this deck
17
Refer to the information provided in Table 12.1 below to answer the questions that follow.
Table 12.1:
2001 survey of 1,000 randomly selected adult residents of Seattle, Years of schooling by whether or not one agrees with the statement,
"Seattle should require the registration of hand guns with the city police department."
-What does this table show?
A) There is no relationship between amount of formal schooling and support for gun registration. The null hypothesis is not rejected.
B) A majority of people with 12 or fewer years of schooling oppose disagree or strongly disagree) with gun registration.
C) More of the 1,000 people surveyed Strongly Agree with gun registration than the total number who disagree or strongly disagree combined.
D) There is a negative relationship between amount of schooling and support for gun registration.
Unlock Deck
Unlock for access to all 49 flashcards in this deck.
Unlock Deck
k this deck
18
Refer to the information provided in Table 12.1 below to answer the questions that follow.
Table 12.1:
2001 survey of 1,000 randomly selected adult residents of Seattle, Years of schooling by whether or not one agrees with the statement,
"Seattle should require the registration of hand guns with the city police department."
-An elementary school teacher has three classes. She finds the following mean and standard deviations for student I.Q. scores. She knows she is more effective if the students are at similar ability levels and the I.Q. measures ability level in this situation. Which class is she likely to be most effective with? [NOTE: I.Q. scores for the general population range from about 70 to 130 with a mean of 100].
A) Class #1
B) Class #2
C) Class #3
D) All classes equally
Unlock Deck
Unlock for access to all 49 flashcards in this deck.
Unlock Deck
k this deck
19
Rocky Rococo found a correlation of .001 between the amount of pizza a person consumed in a year and the number of Italian phrases the person could correctly translate into English. From this, he should conclude
A) there is a strong negative relationship between the variables.
B) there is no relationship between the variables.
C) there is a weak negative relationship between the variables.
D) there is a strong positive relationship between the variables.
A) there is a strong negative relationship between the variables.
B) there is no relationship between the variables.
C) there is a weak negative relationship between the variables.
D) there is a strong positive relationship between the variables.
Unlock Deck
Unlock for access to all 49 flashcards in this deck.
Unlock Deck
k this deck
20
Statistical analysis that allows scientists to confidently make accurate statements about a population is called
A) frequency distribution.
B) descriptive statistics.
C) univariate statistics.
D) inferential statistics.
A) frequency distribution.
B) descriptive statistics.
C) univariate statistics.
D) inferential statistics.
Unlock Deck
Unlock for access to all 49 flashcards in this deck.
Unlock Deck
k this deck
21
Refer to the information provided below to answer the following questions.
Table 12.4: Education by Violence in Crime Education Level of Offender
The mean is
A) 8
B) 8.5
C) 10
D) 9.5
Table 12.4: Education by Violence in Crime Education Level of Offender
The mean is
A) 8
B) 8.5
C) 10
D) 9.5
Unlock Deck
Unlock for access to all 49 flashcards in this deck.
Unlock Deck
k this deck
22
Refer to the following paragraph to answer the questions below.
Researchers debate the degree to which racism is a major source of White anti-immigrant attitudes in the United States, since most recent immigrants are non-White. To examine this relationship, I used a measure of racial prejudice among Whites not wanting a Black person to marry a close relative and cross-tabulated it with a opinion question about immigration using data from the 2000 General Social Survey. The variables are percentaged both by row and by column. MARRY BLACK: How would you respond to a close relative marrying a Black person?
Strongly Favor, Favor, Neither Favor or Oppose, Oppose, Strongly Oppose. IMMIGRANTS: Should the number of people coming from other countries to the U.S. as immigrants be increased, stay the same, or decreased? Data only for Race = White, GSS 2000.
Note: Missing data, Don't Know, No Answer removed from Table. Immigrant response collapsed into 3 categories: Increase At lot and Increase a Little combined into Increase, Same, Decrease a little and Decrease a lot are combined into Decrease.
Column Percentage
Immigrants
Row Percentage
Immigrants
You discover that the years of marriage before a divorce for nine Whites and nine non-Whites are as follows: Whites 12, 1, 8, 9, 10, 17, 3, 6, 6 Non-Whites 1, 9, 15, 18, 11, 13, 14, 7, 3
Which statement about this data is TRUE?
A) On average, non-Whites stay married longer prior to divorce than the Whites.
B) There is no difference in the range for the two groups.
C) The mean years of marriage prior to divorce are the same for both groups.
D) The median years of marriage prior to divorce are three years longer for Whites than non-whites.
Researchers debate the degree to which racism is a major source of White anti-immigrant attitudes in the United States, since most recent immigrants are non-White. To examine this relationship, I used a measure of racial prejudice among Whites not wanting a Black person to marry a close relative and cross-tabulated it with a opinion question about immigration using data from the 2000 General Social Survey. The variables are percentaged both by row and by column. MARRY BLACK: How would you respond to a close relative marrying a Black person?
Strongly Favor, Favor, Neither Favor or Oppose, Oppose, Strongly Oppose. IMMIGRANTS: Should the number of people coming from other countries to the U.S. as immigrants be increased, stay the same, or decreased? Data only for Race = White, GSS 2000.
Note: Missing data, Don't Know, No Answer removed from Table. Immigrant response collapsed into 3 categories: Increase At lot and Increase a Little combined into Increase, Same, Decrease a little and Decrease a lot are combined into Decrease.
Column Percentage
Immigrants
Row PercentageImmigrants
You discover that the years of marriage before a divorce for nine Whites and nine non-Whites are as follows: Whites 12, 1, 8, 9, 10, 17, 3, 6, 6 Non-Whites 1, 9, 15, 18, 11, 13, 14, 7, 3
Which statement about this data is TRUE?
A) On average, non-Whites stay married longer prior to divorce than the Whites.
B) There is no difference in the range for the two groups.
C) The mean years of marriage prior to divorce are the same for both groups.
D) The median years of marriage prior to divorce are three years longer for Whites than non-whites.
Unlock Deck
Unlock for access to all 49 flashcards in this deck.
Unlock Deck
k this deck
23
Refer to the information provided in Table 12.3 below to answer the questions that follow.
Table 12.3:
Annual Family Income and Education* Statistics for Three Neighborhoods
*4 yrs college = 16 yrs; masters/law degrees = 18 yrs; Ph.D/MD degrees = 20 yrs.
-Which neighborhood has the largest number of families with the lowest income?
A) Glenbrook
B) Meadowbrook
C) Elmbrook
D) The neighborhoods have equal number members of the lowest income.
Unlock Deck
Unlock for access to all 49 flashcards in this deck.
Unlock Deck
k this deck
24
Professor Smith found a relationship between education and occupation. However, when she introduced age as a test factor, the relationship between education and occupation disappeared in the partials. This illustrates
A) explanation pattern.
B) specification pattern.
C) replication pattern.
D) interpretation pattern.
A) explanation pattern.
B) specification pattern.
C) replication pattern.
D) interpretation pattern.
Unlock Deck
Unlock for access to all 49 flashcards in this deck.
Unlock Deck
k this deck
25
Refer to the information provided below to answer the following questions.
Table 12.4: Education by Violence in Crime Education Level of Offender
The mode is
A) 8
B) 8.5
C) 10
D) 9.5
Table 12.4: Education by Violence in Crime Education Level of Offender
The mode is
A) 8
B) 8.5
C) 10
D) 9.5
Unlock Deck
Unlock for access to all 49 flashcards in this deck.
Unlock Deck
k this deck
26
Refer to the following paragraph to answer the questions below.
Researchers debate the degree to which racism is a major source of White anti-immigrant attitudes in the United States, since most recent immigrants are non-White. To examine this relationship, I used a measure of racial prejudice among Whites not wanting a Black person to marry a close relative and cross-tabulated it with a opinion question about immigration using data from the 2000 General Social Survey. The variables are percentaged both by row and by column. MARRY BLACK: How would you respond to a close relative marrying a Black person?
Strongly Favor, Favor, Neither Favor or Oppose, Oppose, Strongly Oppose. IMMIGRANTS: Should the number of people coming from other countries to the U.S. as immigrants be increased, stay the same, or decreased? Data only for Race = White, GSS 2000.
Note: Missing data, Don't Know, No Answer removed from Table. Immigrant response collapsed into 3 categories: Increase At lot and Increase a Little combined into Increase, Same, Decrease a little and Decrease a lot are combined into Decrease.
Column Percentage
Immigrants
Row Percentage
Immigrants
What percentage of Whites, who strongly accept the idea of a close relative marrying a Black person also support increased immigration into the United States?
A) 3.7%
B) 9.4%
C) 16.8%
D) 24.7%
Researchers debate the degree to which racism is a major source of White anti-immigrant attitudes in the United States, since most recent immigrants are non-White. To examine this relationship, I used a measure of racial prejudice among Whites not wanting a Black person to marry a close relative and cross-tabulated it with a opinion question about immigration using data from the 2000 General Social Survey. The variables are percentaged both by row and by column. MARRY BLACK: How would you respond to a close relative marrying a Black person?
Strongly Favor, Favor, Neither Favor or Oppose, Oppose, Strongly Oppose. IMMIGRANTS: Should the number of people coming from other countries to the U.S. as immigrants be increased, stay the same, or decreased? Data only for Race = White, GSS 2000.
Note: Missing data, Don't Know, No Answer removed from Table. Immigrant response collapsed into 3 categories: Increase At lot and Increase a Little combined into Increase, Same, Decrease a little and Decrease a lot are combined into Decrease.
Column Percentage
Immigrants
Row PercentageImmigrants
What percentage of Whites, who strongly accept the idea of a close relative marrying a Black person also support increased immigration into the United States?
A) 3.7%
B) 9.4%
C) 16.8%
D) 24.7%
Unlock Deck
Unlock for access to all 49 flashcards in this deck.
Unlock Deck
k this deck
27
Refer to the information provided in Table 12.3 below to answer the questions that follow.
Table 12.3:
Annual Family Income and Education* Statistics for Three Neighborhoods
*4 yrs college = 16 yrs; masters/law degrees = 18 yrs; Ph.D/MD degrees = 20 yrs.
-Which neighborhood has the greatest variation in the amount of education people have?
A) Glenbrook
B) Meadowbrook
C) Elmbrook
D) The neighborhoods are equally distributed.
Unlock Deck
Unlock for access to all 49 flashcards in this deck.
Unlock Deck
k this deck
28
Use the information in this table to answer the following questions.
-Among the violent offenders, what is the ratio of males to females?
A) 4 males to 1 female, or 4:1
B) 2 males to 3 females, or 2:3
C) 1 male to 1 female, or 1:1
D) 2 males to 1 female, or 2:1
-Among the violent offenders, what is the ratio of males to females?
A) 4 males to 1 female, or 4:1
B) 2 males to 3 females, or 2:3
C) 1 male to 1 female, or 1:1
D) 2 males to 1 female, or 2:1
Unlock Deck
Unlock for access to all 49 flashcards in this deck.
Unlock Deck
k this deck
29
Refer to the following paragraph to answer the questions below.
Researchers debate the degree to which racism is a major source of White anti-immigrant attitudes in the United States, since most recent immigrants are non-White. To examine this relationship, I used a measure of racial prejudice among Whites not wanting a Black person to marry a close relative and cross-tabulated it with a opinion question about immigration using data from the 2000 General Social Survey. The variables are percentaged both by row and by column. MARRY BLACK: How would you respond to a close relative marrying a Black person?
Strongly Favor, Favor, Neither Favor or Oppose, Oppose, Strongly Oppose. IMMIGRANTS: Should the number of people coming from other countries to the U.S. as immigrants be increased, stay the same, or decreased? Data only for Race = White, GSS 2000.
Note: Missing data, Don't Know, No Answer removed from Table. Immigrant response collapsed into 3 categories: Increase At lot and Increase a Little combined into Increase, Same, Decrease a little and Decrease a lot are combined into Decrease.
Column Percentage
Immigrants
Row Percentage
Immigrants
Looking at data from the above two tables, which of the following is TRUE?
A) Over one-half of Whites who strongly oppose having a relative marrying a Black person also want a decrease in immigrants coming to the U.S.
B) Among all Whites in the U.S., a substantial majority wants immigration to decrease.
C) Among Whites who strongly favor having a relative marrying a Black person, a higher percentage want increased immigration than decreased immigration
D) Over one-half of the Whites who want immigration to stay the same strongly favor a relative marrying a Black person.
Researchers debate the degree to which racism is a major source of White anti-immigrant attitudes in the United States, since most recent immigrants are non-White. To examine this relationship, I used a measure of racial prejudice among Whites not wanting a Black person to marry a close relative and cross-tabulated it with a opinion question about immigration using data from the 2000 General Social Survey. The variables are percentaged both by row and by column. MARRY BLACK: How would you respond to a close relative marrying a Black person?
Strongly Favor, Favor, Neither Favor or Oppose, Oppose, Strongly Oppose. IMMIGRANTS: Should the number of people coming from other countries to the U.S. as immigrants be increased, stay the same, or decreased? Data only for Race = White, GSS 2000.
Note: Missing data, Don't Know, No Answer removed from Table. Immigrant response collapsed into 3 categories: Increase At lot and Increase a Little combined into Increase, Same, Decrease a little and Decrease a lot are combined into Decrease.
Column Percentage
Immigrants
Row PercentageImmigrants
Looking at data from the above two tables, which of the following is TRUE?
A) Over one-half of Whites who strongly oppose having a relative marrying a Black person also want a decrease in immigrants coming to the U.S.
B) Among all Whites in the U.S., a substantial majority wants immigration to decrease.
C) Among Whites who strongly favor having a relative marrying a Black person, a higher percentage want increased immigration than decreased immigration
D) Over one-half of the Whites who want immigration to stay the same strongly favor a relative marrying a Black person.
Unlock Deck
Unlock for access to all 49 flashcards in this deck.
Unlock Deck
k this deck
30
Refer to the information provided in Table 12.3 below to answer the questions that follow.
Table 12.3:
Annual Family Income and Education* Statistics for Three Neighborhoods
*4 yrs college = 16 yrs; masters/law degrees = 18 yrs; Ph.D/MD degrees = 20 yrs.
-Which neighborhood has half or more who have completed a Masters, Ph.D, MD, law degree?
A) Glenbrook
B) Meadowbrook
C) Elmbrook
D) Can't tell from this table
Unlock Deck
Unlock for access to all 49 flashcards in this deck.
Unlock Deck
k this deck
31
Refer to the information provided in Table 12.3 below to answer the questions that follow.
Table 12.3:
Annual Family Income and Education* Statistics for Three Neighborhoods
*4 yrs college = 16 yrs; masters/law degrees = 18 yrs; Ph.D/MD degrees = 20 yrs.
-Which neighborhood has the smallest average variation distribution) among the incomes of families?
A) Glenbrook
B) Meadowbrook
C) Elmbrook
D) The neighborhoods vary little in average variation.
Unlock Deck
Unlock for access to all 49 flashcards in this deck.
Unlock Deck
k this deck
32
Refer to the information provided below to answer the following questions.
Table 12.4: Education by Violence in Crime Education Level of Offender
All the sales representatives at Allcity Insurance are female, and their mean annual salary is $60,000 with a standard deviation of $5,000. All customer account managers are male and they have a mean salary of $80,000 with a standard deviation of $15,000. Heather knows she is one standard deviation above the mean of the sales representatives. She wants to transfer to become the first female customer account manager and will begin at her same salary. After she transfers, compared to the customer account managers her salary will be at what z-score?
A) -2
B) -1
C) 0
D) +1
Unlock Deck
Unlock for access to all 49 flashcards in this deck.
Unlock Deck
k this deck
33
Connie and Tom both got 75% correct on the research methods final exam. The mean for all women who took the test was 80% and the median was 75% with a standard deviation of 5%. The mean for the men was 65% correct and the median was 65% with a standard deviation of 10%. What is the z-score for Connie and Tom relative to those of their own sex?
A) Connie's z-score is +1, Tom's is -2, so Connie really did better.
B) Both Connie and Tom have the same z-score, 1, so they are the same.
C) Connie's z-score is -1, Tom's is +1, so Tom really did better.
D) Connie's z-score is 0 and Tom's is +1, so he did worse.
A) Connie's z-score is +1, Tom's is -2, so Connie really did better.
B) Both Connie and Tom have the same z-score, 1, so they are the same.
C) Connie's z-score is -1, Tom's is +1, so Tom really did better.
D) Connie's z-score is 0 and Tom's is +1, so he did worse.
Unlock Deck
Unlock for access to all 49 flashcards in this deck.
Unlock Deck
k this deck
34
Use the information in this table to answer the following questions.
-How many males were arrested for committing a violent crime?
A) 140
B) 160
C) 56
D) 20
-How many males were arrested for committing a violent crime?
A) 140
B) 160
C) 56
D) 20
Unlock Deck
Unlock for access to all 49 flashcards in this deck.
Unlock Deck
k this deck
35
Refer to the information provided in Table 12.3 below to answer the questions that follow.
Table 12.3:
Annual Family Income and Education* Statistics for Three Neighborhoods
*4 yrs college = 16 yrs; masters/law degrees = 18 yrs; Ph.D/MD degrees = 20 yrs.
-Which neighborhood has a tiny number of very high income people, while more families earn $26,000 than any other amount?
A) Glenbrook
B) Meadowbrook
C) Elmbrook
D) Can't tell from this table
Unlock Deck
Unlock for access to all 49 flashcards in this deck.
Unlock Deck
k this deck
36
Refer to the information provided in Table 12.3 below to answer the questions that follow.
Table 12.3:
Annual Family Income and Education* Statistics for Three Neighborhoods
*4 yrs college = 16 yrs; masters/law degrees = 18 yrs; Ph.D/MD degrees = 20 yrs.
-Which neighborhood has the greatest average variation distribution) among the incomes of families?
A) Glenbrook
B) Meadowbrook
C) Elmbrook
D) The neighborhoods are all very diverse in income.
Unlock Deck
Unlock for access to all 49 flashcards in this deck.
Unlock Deck
k this deck
37
Professor Wilton decided to test the hypothesis that people with blonde hair have more fun than people with other hair colors. Wilton surveyed 1600 people and obtained the following results. Hair Color
For this hypothesis, the BEST way to percentage the table is are)
A) within rows, across.
B) divide each cell by 1600.
C) within columns, down.
D) all of the above.
For this hypothesis, the BEST way to percentage the table is are)
A) within rows, across.
B) divide each cell by 1600.
C) within columns, down.
D) all of the above.
Unlock Deck
Unlock for access to all 49 flashcards in this deck.
Unlock Deck
k this deck
38
Refer to the information provided below to answer the following questions.
Table 12.4: Education by Violence in Crime Education Level of Offender
The median is
A) 8
B) 8.5
C) 10
D) 9.5
Table 12.4: Education by Violence in Crime Education Level of Offender
The median is
A) 8
B) 8.5
C) 10
D) 9.5
Unlock Deck
Unlock for access to all 49 flashcards in this deck.
Unlock Deck
k this deck
39
Refer to the information provided below to answer the following questions.
Table 12.4: Education by Violence in Crime Education Level of Offender
Based on Table 12.4, what type of relationship is there between degree of violence in the crime committed and level of education?
A) positive relationship
B) non-linear relationship
C) no relationship, independence
D) negative relationship
Unlock Deck
Unlock for access to all 49 flashcards in this deck.
Unlock Deck
k this deck
40
Refer to the information provided below to answer the following questions.
Table 12.4: Education by Violence in Crime Education Level of Offender
How many people in the study who have more than a college degree 17+ years education) were arrested for committing a medium violent crime?
A) 160
B) 20
C) 180
D) insufficient information
Table 12.4: Education by Violence in Crime Education Level of Offender
How many people in the study who have more than a college degree 17+ years education) were arrested for committing a medium violent crime?
A) 160
B) 20
C) 180
D) insufficient information
Unlock Deck
Unlock for access to all 49 flashcards in this deck.
Unlock Deck
k this deck
41
Explain why a researcher uses a codebook. How does a codebook set the stage for accurate data analysis?
Unlock Deck
Unlock for access to all 49 flashcards in this deck.
Unlock Deck
k this deck
42
Discuss the concept of control as it is used in trivariate analysis. In what ways it is similar to or different from control in experiments?
Unlock Deck
Unlock for access to all 49 flashcards in this deck.
Unlock Deck
k this deck
43
Explain Type I and Type II errors. When are Type I errors most likely to occur? When are Type II errors most likely to occur?
Unlock Deck
Unlock for access to all 49 flashcards in this deck.
Unlock Deck
k this deck
44
Why is knowing the variability ex. standard deviation) of a variable just as important as knowing its central tendency?
Unlock Deck
Unlock for access to all 49 flashcards in this deck.
Unlock Deck
k this deck
45
Describe three ways a researcher can summarize the central tendency of a variable. Explain how each measure of central tendency is calculated and is different from other measures of central tendency.
Unlock Deck
Unlock for access to all 49 flashcards in this deck.
Unlock Deck
k this deck
46
What three features of a relationship between two variables can be seen from a scattergram?
Unlock Deck
Unlock for access to all 49 flashcards in this deck.
Unlock Deck
k this deck
47
What does the statement, "It is statistically significant at the .10 level," mean? Is a Type I or Type II error more likely if a .05 level had been used? Explain.
Unlock Deck
Unlock for access to all 49 flashcards in this deck.
Unlock Deck
k this deck
48
Explain the difference between the three measures of variation: range, percentiles, and standard deviation.
Unlock Deck
Unlock for access to all 49 flashcards in this deck.
Unlock Deck
k this deck
49
Describe three univariate statistics. Use a unique example to illustrate your comprehension of univariate statistics.
Unlock Deck
Unlock for access to all 49 flashcards in this deck.
Unlock Deck
k this deck
Unlock Deck
Unlock for access to all 49 flashcards in this deck.


