Deck 11: Analysis of Variance
Full screen (f)
Question
Question
Question
Question
Question
Question
Question
Question
Question
Question
The degrees of freedom for the F test in a one-way ANOVA are 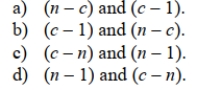
Question
Question
Question
Question
Question
Question
Question
Question
In a one-way ANOVA, if the computed F statistic is greater than the critical F value you may 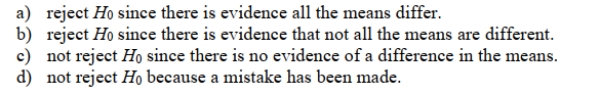
Question
Question
Question
Question
SCENARIO 11-3
As part of an evaluation program, a sporting goods retailer wanted to compare the downhill coasting
speeds of 4 brands of bicycles. She took 3 of each brand and determined their maximum downhill
speeds. The results are presented in miles per hour in the table below.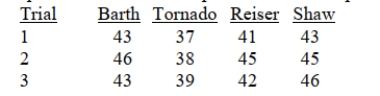
Referring to Scenario 11-3, the within group variation or SSW is __________.
Question
SCENARIO 11-3
As part of an evaluation program, a sporting goods retailer wanted to compare the downhill coasting
speeds of 4 brands of bicycles. She took 3 of each brand and determined their maximum downhill
speeds. The results are presented in miles per hour in the table below.
Referring to Scenario 11-3, the among group variation or SSA is __________.
Question
Question
SCENARIO 11-3
As part of an evaluation program, a sporting goods retailer wanted to compare the downhill coasting
speeds of 4 brands of bicycles. She took 3 of each brand and determined their maximum downhill
speeds. The results are presented in miles per hour in the table below.
Referring to Scenario 11-3, the null hypothesis that the mean downhill coasting speeds of the 4
brands of bicycles are equal will be rejected at a level of significance of 0.05 if the value of the
test statistic is greater than __________.
Question
Question
Question
Question
SCENARIO 11-3
As part of an evaluation program, a sporting goods retailer wanted to compare the downhill coasting
speeds of 4 brands of bicycles. She took 3 of each brand and determined their maximum downhill
speeds. The results are presented in miles per hour in the table below.
Referring to Scenario 11-3, the sporting goods retailer decided to perform an ANOVA F test.
The amount of total variation or SST is __________.
Question
SCENARIO 11-2
A realtor wants to compare the mean sales-to-appraisal ratios of residential properties sold in four
neighborhoods (A, B, C, and D). Four properties are randomly selected from each neighborhood and
the ratios recorded for each, as shown below.
A: 1.2, 1.1, 0.9, 0.4 C: 1.0, 1.5, 1.1, 1.3
B: 2.5, 2.1, 1.9, 1.6 D: 0.8, 1.3, 1.1, 0.7
Interpret the results of the analysis summarized in the following table: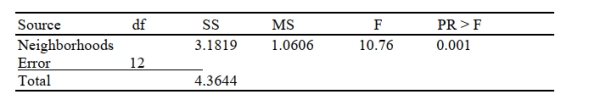
Referring to Scenario 11-2, the null hypothesis for Levene's test for homogeneity of variances is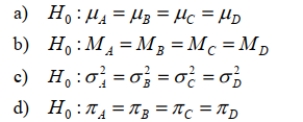
Question
Question
SCENARIO 11-3
As part of an evaluation program, a sporting goods retailer wanted to compare the downhill coasting
speeds of 4 brands of bicycles. She took 3 of each brand and determined their maximum downhill
speeds. The results are presented in miles per hour in the table below.
Referring to Scenario 11-3, construct the ANOVA table from the sample data.
Question
Question
Question
Question
Question
Question
SCENARIO 11-3
As part of an evaluation program, a sporting goods retailer wanted to compare the downhill coasting
speeds of 4 brands of bicycles. She took 3 of each brand and determined their maximum downhill
speeds. The results are presented in miles per hour in the table below.
Referring to Scenario 11-3, the value of MSA is __________, while MSW is __________.
Question
SCENARIO 11-3
As part of an evaluation program, a sporting goods retailer wanted to compare the downhill coasting
speeds of 4 brands of bicycles. She took 3 of each brand and determined their maximum downhill
speeds. The results are presented in miles per hour in the table below.
Referring to Scenario 11-3, in testing the null hypothesis that the mean downhill coasting speeds
of the 4 brands of bicycles are equal, the value of the test statistic is __________.
Question
Question
Question
SCENARIO 11-4
An agronomist wants to compare the crop yield of 3 varieties of chickpea seeds. She plants 15 fields,
5 with each variety. She then measures the crop yield in bushels per acre. Treating this as a
completely randomized design, the results are presented in the table that follows.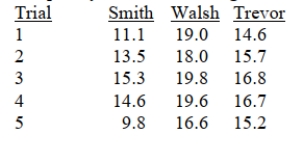
Referring to Scenario 11-4, the within-group variation or SSW is __________.
Question
SCENARIO 11-4
An agronomist wants to compare the crop yield of 3 varieties of chickpea seeds. She plants 15 fields,
5 with each variety. She then measures the crop yield in bushels per acre. Treating this as a
completely randomized design, the results are presented in the table that follows.
Referring to Scenario 11-4, the among-group variation or SSA is __________.
Question
Question
SCENARIO 11-3
As part of an evaluation program, a sporting goods retailer wanted to compare the downhill coasting
speeds of 4 brands of bicycles. She took 3 of each brand and determined their maximum downhill
speeds. The results are presented in miles per hour in the table below.
Referring to Scenario 11-3, what is the p-value of the test statistic for Levene's test for
homogeneity of variances?
Question
SCENARIO 11-3
As part of an evaluation program, a sporting goods retailer wanted to compare the downhill coasting
speeds of 4 brands of bicycles. She took 3 of each brand and determined their maximum downhill
speeds. The results are presented in miles per hour in the table below.
Referring to Scenario 11-3, what is the value of the test statistic for Levene's test for
homogeneity of variances?
Question
Question
Question
SCENARIO 11-3
As part of an evaluation program, a sporting goods retailer wanted to compare the downhill coasting
speeds of 4 brands of bicycles. She took 3 of each brand and determined their maximum downhill
speeds. The results are presented in miles per hour in the table below.
Referring to Scenario 11-3, the null hypothesis for Levene's test for homogeneity of variances is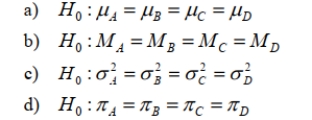
Question
Question
SCENARIO 11-3
As part of an evaluation program, a sporting goods retailer wanted to compare the downhill coasting
speeds of 4 brands of bicycles. She took 3 of each brand and determined their maximum downhill
speeds. The results are presented in miles per hour in the table below.
Referring to Scenario 11-3, the sporting goods retailer decided to compare the 4 treatment means
by using the Tukey-Kramer procedure with an overall level of significance of 0.05. There are
________ pairwise comparisons that can be made.
Question
SCENARIO 11-3
As part of an evaluation program, a sporting goods retailer wanted to compare the downhill coasting
speeds of 4 brands of bicycles. She took 3 of each brand and determined their maximum downhill
speeds. The results are presented in miles per hour in the table below.
Referring to Scenario 11-3, using an overall level of significance of 0.05, the critical value of the
Studentized range Q used in calculating the critical range for the Tukey-Kramer procedure is
________.
Question
Question
Question
SCENARIO 11-3
As part of an evaluation program, a sporting goods retailer wanted to compare the downhill coasting
speeds of 4 brands of bicycles. She took 3 of each brand and determined their maximum downhill
speeds. The results are presented in miles per hour in the table below.
Referring to Scenario 11-3, using an overall level of significance of 0.05, the critical range for the
Tukey-Kramer procedure is ________.
Question
Question
SCENARIO 11-4
An agronomist wants to compare the crop yield of 3 varieties of chickpea seeds. She plants 15 fields,
5 with each variety. She then measures the crop yield in bushels per acre. Treating this as a
completely randomized design, the results are presented in the table that follows.
Referring to Scenario 11-4, the agronomist decided to perform an ANOVA F test. The amount of
total variation or SST is __________.
Question
SCENARIO 11-4
An agronomist wants to compare the crop yield of 3 varieties of chickpea seeds. She plants 15 fields,
5 with each variety. She then measures the crop yield in bushels per acre. Treating this as a
completely randomized design, the results are presented in the table that follows.
Referring to Scenario 11-4, the value of MSA is __________, while MSW is __________.
Question
SCENARIO 11-3
As part of an evaluation program, a sporting goods retailer wanted to compare the downhill coasting
speeds of 4 brands of bicycles. She took 3 of each brand and determined their maximum downhill
speeds. The results are presented in miles per hour in the table below.
Referring to Scenario 11-3, what is the critical value of Levene's test for homogeneity of
variances at a 5% level of significance?
Question
SCENARIO 11-3
As part of an evaluation program, a sporting goods retailer wanted to compare the downhill coasting
speeds of 4 brands of bicycles. She took 3 of each brand and determined their maximum downhill
speeds. The results are presented in miles per hour in the table below.
Referring to Scenario 11-3, what are the numerator and denominator degrees of freedom for
Levene's test for homogeneity of variances respectively?
Question
SCENARIO 11-4
An agronomist wants to compare the crop yield of 3 varieties of chickpea seeds. She plants 15 fields,
5 with each variety. She then measures the crop yield in bushels per acre. Treating this as a
completely randomized design, the results are presented in the table that follows.
Referring to Scenario 11-4, state the null hypothesis that can be tested.
Question
SCENARIO 11-5
A hotel chain has identically small sized resorts in 5 locations in different small islands. The data that
follow resulted from analyzing the hotel occupancies on randomly selected days in the 5 locations.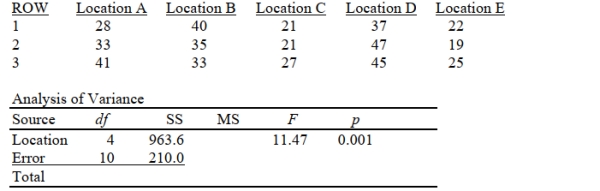
Referring to Scenario 11-5, the among-group variation or SSA is _________.
A hotel chain has identically small sized resorts in 5 locations in different small islands. The data that
follow resulted from analyzing the hotel occupancies on randomly selected days in the 5 locations.
Referring to Scenario 11-5, the among-group variation or SSA is _________.
Question
Question
SCENARIO 11-4
An agronomist wants to compare the crop yield of 3 varieties of chickpea seeds. She plants 15 fields,
5 with each variety. She then measures the crop yield in bushels per acre. Treating this as a
completely randomized design, the results are presented in the table that follows.
Referring to Scenario 11-4, the value of the test statistic is __________.
Question
Question
Question
Question
Question
SCENARIO 11-4
An agronomist wants to compare the crop yield of 3 varieties of chickpea seeds. She plants 15 fields,
5 with each variety. She then measures the crop yield in bushels per acre. Treating this as a
completely randomized design, the results are presented in the table that follows.
Referring to Scenario 11-4, using an overall level of significance of 0.01, the critical value of the
Studentized range Q used in calculating the critical range for the Tukey-Kramer procedure is
________.
Question
SCENARIO 11-4
An agronomist wants to compare the crop yield of 3 varieties of chickpea seeds. She plants 15 fields,
5 with each variety. She then measures the crop yield in bushels per acre. Treating this as a
completely randomized design, the results are presented in the table that follows.
Referring to Scenario 11-4, the null hypothesis will be rejected at a level of significance of 0.01 if
the value of the test statistic is greater than __________.
Question
Question
SCENARIO 11-4
An agronomist wants to compare the crop yield of 3 varieties of chickpea seeds. She plants 15 fields,
5 with each variety. She then measures the crop yield in bushels per acre. Treating this as a
completely randomized design, the results are presented in the table that follows.
Referring to Scenario 11-4, construct the ANOVA table from the sample data.
Question
SCENARIO 11-5
A hotel chain has identically small sized resorts in 5 locations in different small islands. The data that
follow resulted from analyzing the hotel occupancies on randomly selected days in the 5 locations.
Referring to Scenario 11-5, the within-group variation or SSW is _________.
A hotel chain has identically small sized resorts in 5 locations in different small islands. The data that
follow resulted from analyzing the hotel occupancies on randomly selected days in the 5 locations.
Referring to Scenario 11-5, the within-group variation or SSW is _________.
Question
SCENARIO 11-5
A hotel chain has identically small sized resorts in 5 locations in different small islands. The data that
follow resulted from analyzing the hotel occupancies on randomly selected days in the 5 locations.
Referring to Scenario 11-5, the total variation or SST is ________.
A hotel chain has identically small sized resorts in 5 locations in different small islands. The data that
follow resulted from analyzing the hotel occupancies on randomly selected days in the 5 locations.
Referring to Scenario 11-5, the total variation or SST is ________.
Question
Question
SCENARIO 11-4
An agronomist wants to compare the crop yield of 3 varieties of chickpea seeds. She plants 15 fields,
5 with each variety. She then measures the crop yield in bushels per acre. Treating this as a
completely randomized design, the results are presented in the table that follows.
Referring to Scenario 11-4, the agronomist decided to compare the 3 treatment means by using
the Tukey-Kramer procedure with an overall level of significance of 0.01. There are ________
pairwise comparisons that can be made.
Question
Question
Question
SCENARIO 11-4
An agronomist wants to compare the crop yield of 3 varieties of chickpea seeds. She plants 15 fields,
5 with each variety. She then measures the crop yield in bushels per acre. Treating this as a
completely randomized design, the results are presented in the table that follows.
Referring to Scenario 11-4, using an overall level of significance of 0.01, the critical range for the
Tukey-Kramer procedure is ________.
Question

Unlock Deck
Sign up to unlock the cards in this deck!
Unlock Deck
Unlock Deck
1/170
Play
Full screen (f)
Deck 11: Analysis of Variance
1
In a one-factor ANOVA analysis, the among sum of squares and within sum of
squares must add up to the total sum of squares.
squares must add up to the total sum of squares.
True
2
An airline wants to select a computer software package for its reservation system. Four software packages (1, 2, 3, and 4) are commercially available. The airline will choose the package that
Bumps the fewest mean number of passengers as possible during a month. An experiment is set
Up in which each package is used to make reservations for 5 randomly selected weeks. (A total of
20 weeks was included in the experiment.) The number of passengers bumped each week is given
Below. How should the data be analyzed?
Package 1: 12, 14, 9, 11, 16
Package 2: 2, 4, 7, 3, 1
Package 3: 10, 9, 6, 10, 12
Package 4: 7, 6, 6, 15, 12
A) F test for differences in variances.
B) One-way ANOVA F test.
C) t test for the differences in means.
D) t test for the mean difference.
B
3
SCENARIO 11-2
A realtor wants to compare the mean sales-to-appraisal ratios of residential properties sold in four
neighborhoods (A, B, C, and D). Four properties are randomly selected from each neighborhood and
the ratios recorded for each, as shown below.
A: 1.2, 1.1, 0.9, 0.4 C: 1.0, 1.5, 1.1, 1.3
B: 2.5, 2.1, 1.9, 1.6 D: 0.8, 1.3, 1.1, 0.7
Interpret the results of the analysis summarized in the following table:
-Referring to Scenario 11-2, the among group degrees of freedom is
A) 3
B) 4
C) 12
D) 16
3
4
If you are comparing the mean sales among 3 different brands you are dealing
with a three-way ANOVA design.
with a three-way ANOVA design.
Unlock Deck
Unlock for access to all 170 flashcards in this deck.
Unlock Deck
k this deck
5
When would you use the Tukey-Kramer procedure?
A) To test for normality.
B) To test for homogeneity of variance.
C) To test independence of errors.
D) To test for differences in pairs of means.
A) To test for normality.
B) To test for homogeneity of variance.
C) To test independence of errors.
D) To test for differences in pairs of means.
Unlock Deck
Unlock for access to all 170 flashcards in this deck.
Unlock Deck
k this deck
6
SCENARIO 11-1
An airline wants to select a computer software package for its reservation system. Four software
packages (1, 2, 3, and 4) are commercially available. The airline will choose the package that bumps
as few passengers as possible during a month. An experiment is set up in which each package is used
to make reservations for 5 randomly selected weeks. (A total of 20 weeks was included in the
experiment.) The number of passengers bumped each week is obtained, which gives rise to the
following Excel output:
-Referring to Scenario 11-1, at a significance level of 1%,
A) there is insufficient evidence to conclude that the mean number of customers bumped by the 4 packages are not all the same.
B) there is insufficient evidence to conclude that the mean number of customers bumped by the 4 packages are all the same.
C) there is sufficient evidence to conclude that the mean number of customers bumped by the 4 packages are not all the same.
D) there is sufficient evidence to conclude that the mean number of customers bumped by the 4 packages are all the same.
Unlock Deck
Unlock for access to all 170 flashcards in this deck.
Unlock Deck
k this deck
7
A completely randomized design
A) has only one factor with several treatment groups.
B) can have more than one factor, each with several treatment groups.
C) has one factor and one block.
D) has one factor and one block and multiple values.
A) has only one factor with several treatment groups.
B) can have more than one factor, each with several treatment groups.
C) has one factor and one block.
D) has one factor and one block and multiple values.
Unlock Deck
Unlock for access to all 170 flashcards in this deck.
Unlock Deck
k this deck
8
The F test statistic in a one-way ANOVA is
A) MSW/MSA.
B) SSW/SSA.
C) MSA/MSW.
D) SSA/SSW.
A) MSW/MSA.
B) SSW/SSA.
C) MSA/MSW.
D) SSA/SSW.
Unlock Deck
Unlock for access to all 170 flashcards in this deck.
Unlock Deck
k this deck
9
The analysis of variance (ANOVA) tests hypotheses about the population
variance.
variance.
Unlock Deck
Unlock for access to all 170 flashcards in this deck.
Unlock Deck
k this deck
10
The degrees of freedom for the F test in a one-way ANOVA are
Unlock Deck
Unlock for access to all 170 flashcards in this deck.
Unlock Deck
k this deck
11
SCENARIO 11-2
A realtor wants to compare the mean sales-to-appraisal ratios of residential properties sold in four
neighborhoods (A, B, C, and D). Four properties are randomly selected from each neighborhood and
the ratios recorded for each, as shown below.
A: 1.2, 1.1, 0.9, 0.4 C: 1.0, 1.5, 1.1, 1.3
B: 2.5, 2.1, 1.9, 1.6 D: 0.8, 1.3, 1.1, 0.7
Interpret the results of the analysis summarized in the following table:
-Referring to Scenario 11-2, the within group sum of squares is
A) 1.0606
B) 1.1825
C) 3.1819
D) 4.3644
Unlock Deck
Unlock for access to all 170 flashcards in this deck.
Unlock Deck
k this deck
12
When the F test is used for ANOVA, the rejection region is always in the right tail.
Unlock Deck
Unlock for access to all 170 flashcards in this deck.
Unlock Deck
k this deck
13
In a one-way ANOVA, the null hypothesis is always
A) there is no difference in the population means.
B) there is some treatment effect.
C) all the population means are different.
D) some of the population means are different.
A) there is no difference in the population means.
B) there is some treatment effect.
C) all the population means are different.
D) some of the population means are different.
Unlock Deck
Unlock for access to all 170 flashcards in this deck.
Unlock Deck
k this deck
14
The MSE must always be positive.
Unlock Deck
Unlock for access to all 170 flashcards in this deck.
Unlock Deck
k this deck
15
Which of the following components in an ANOVA table are not additive?
A) Sum of squares.
B) Degrees of freedom.
C) Mean squares.
D) It is not possible to tell.
A) Sum of squares.
B) Degrees of freedom.
C) Mean squares.
D) It is not possible to tell.
Unlock Deck
Unlock for access to all 170 flashcards in this deck.
Unlock Deck
k this deck
16
In a one-way ANOVA
A) an interaction term is present.
B) an interaction effect can be tested.
C) there is no interaction term.
D) the interaction term has (c - 1)(n - 1) degrees of freedom.
A) an interaction term is present.
B) an interaction effect can be tested.
C) there is no interaction term.
D) the interaction term has (c - 1)(n - 1) degrees of freedom.
Unlock Deck
Unlock for access to all 170 flashcards in this deck.
Unlock Deck
k this deck
17
SCENARIO 11-1
An airline wants to select a computer software package for its reservation system. Four software
packages (1, 2, 3, and 4) are commercially available. The airline will choose the package that bumps
as few passengers as possible during a month. An experiment is set up in which each package is used
to make reservations for 5 randomly selected weeks. (A total of 20 weeks was included in the
experiment.) The number of passengers bumped each week is obtained, which gives rise to the
following Excel output:
-Referring to Scenario 11-1, the total degrees of freedom is
A) 3
B) 4
C) 16
D) 19
Unlock Deck
Unlock for access to all 170 flashcards in this deck.
Unlock Deck
k this deck
18
In a one-way ANOVA, if the computed F statistic is greater than the critical F value you may
Unlock Deck
Unlock for access to all 170 flashcards in this deck.
Unlock Deck
k this deck
19
SCENARIO 11-1
An airline wants to select a computer software package for its reservation system. Four software
packages (1, 2, 3, and 4) are commercially available. The airline will choose the package that bumps
as few passengers as possible during a month. An experiment is set up in which each package is used
to make reservations for 5 randomly selected weeks. (A total of 20 weeks was included in the
experiment.) The number of passengers bumped each week is obtained, which gives rise to the
following Excel output:
-Referring to Scenario 11-1, the among-group (between-group) mean squares is
A) 8.525
B) 70.8
C) 212.4
D) 637.2
Unlock Deck
Unlock for access to all 170 flashcards in this deck.
Unlock Deck
k this deck
20
SCENARIO 11-1
An airline wants to select a computer software package for its reservation system. Four software
packages (1, 2, 3, and 4) are commercially available. The airline will choose the package that bumps
as few passengers as possible during a month. An experiment is set up in which each package is used
to make reservations for 5 randomly selected weeks. (A total of 20 weeks was included in the
experiment.) The number of passengers bumped each week is obtained, which gives rise to the
following Excel output:
-Referring to Scenario 11-1, the within groups degrees of freedom is
A) 3
B) 4
C) 16
D) 19
Unlock Deck
Unlock for access to all 170 flashcards in this deck.
Unlock Deck
k this deck
21
SCENARIO 11-2
A realtor wants to compare the mean sales-to-appraisal ratios of residential properties sold in four
neighborhoods (A, B, C, and D). Four properties are randomly selected from each neighborhood and
the ratios recorded for each, as shown below.
A: 1.2, 1.1, 0.9, 0.4 C: 1.0, 1.5, 1.1, 1.3
B: 2.5, 2.1, 1.9, 1.6 D: 0.8, 1.3, 1.1, 0.7
Interpret the results of the analysis summarized in the following table:
-Referring to Scenario 11-2, what should be the decision for the Levene's test for homogeneity of variances at a 5% level of significance?
A) Reject the null hypothesis because the p-value is smaller than the level of significance.
B) Reject the null hypothesis because the p-value is larger than the level of significance.
C) Do not reject the null hypothesis because the p-value is smaller than the level of significance.
D) Do not reject the null hypothesis because the p-value is larger than the level of significance.
Unlock Deck
Unlock for access to all 170 flashcards in this deck.
Unlock Deck
k this deck
22
SCENARIO 11-3
As part of an evaluation program, a sporting goods retailer wanted to compare the downhill coasting
speeds of 4 brands of bicycles. She took 3 of each brand and determined their maximum downhill
speeds. The results are presented in miles per hour in the table below.
Referring to Scenario 11-3, the within group variation or SSW is __________.
Unlock Deck
Unlock for access to all 170 flashcards in this deck.
Unlock Deck
k this deck
23
SCENARIO 11-3
As part of an evaluation program, a sporting goods retailer wanted to compare the downhill coasting
speeds of 4 brands of bicycles. She took 3 of each brand and determined their maximum downhill
speeds. The results are presented in miles per hour in the table below.
Referring to Scenario 11-3, the among group variation or SSA is __________.
Unlock Deck
Unlock for access to all 170 flashcards in this deck.
Unlock Deck
k this deck
24
SCENARIO 11-3
As part of an evaluation program, a sporting goods retailer wanted to compare the downhill coasting
speeds of 4 brands of bicycles. She took 3 of each brand and determined their maximum downhill
speeds. The results are presented in miles per hour in the table below.
-Referring to Scenario 11-3, the test is less sensitive to the assumption that the
population of speeds has the same variance for the 4 brands because the sample sizes of the 4
brands are equal.
Unlock Deck
Unlock for access to all 170 flashcards in this deck.
Unlock Deck
k this deck
25
SCENARIO 11-3
As part of an evaluation program, a sporting goods retailer wanted to compare the downhill coasting
speeds of 4 brands of bicycles. She took 3 of each brand and determined their maximum downhill
speeds. The results are presented in miles per hour in the table below.
Referring to Scenario 11-3, the null hypothesis that the mean downhill coasting speeds of the 4
brands of bicycles are equal will be rejected at a level of significance of 0.05 if the value of the
test statistic is greater than __________.
Unlock Deck
Unlock for access to all 170 flashcards in this deck.
Unlock Deck
k this deck
26
SCENARIO 11-2
A realtor wants to compare the mean sales-to-appraisal ratios of residential properties sold in four
neighborhoods (A, B, C, and D). Four properties are randomly selected from each neighborhood and
the ratios recorded for each, as shown below.
A: 1.2, 1.1, 0.9, 0.4 C: 1.0, 1.5, 1.1, 1.3
B: 2.5, 2.1, 1.9, 1.6 D: 0.8, 1.3, 1.1, 0.7
Interpret the results of the analysis summarized in the following table:
-Referring to Scenario 11-2, the critical value of Levene's test for homogeneity of variances at a 5% level of significance is
A) 0.64
B) 2.48
C) 3.29
D) 3.49
Unlock Deck
Unlock for access to all 170 flashcards in this deck.
Unlock Deck
k this deck
27
SCENARIO 11-3
As part of an evaluation program, a sporting goods retailer wanted to compare the downhill coasting
speeds of 4 brands of bicycles. She took 3 of each brand and determined their maximum downhill
speeds. The results are presented in miles per hour in the table below.
-Referring to Scenario 11-3, the null hypothesis should be rejected at a 5% level of
significance.
Unlock Deck
Unlock for access to all 170 flashcards in this deck.
Unlock Deck
k this deck
28
SCENARIO 11-2
A realtor wants to compare the mean sales-to-appraisal ratios of residential properties sold in four
neighborhoods (A, B, C, and D). Four properties are randomly selected from each neighborhood and
the ratios recorded for each, as shown below.
A: 1.2, 1.1, 0.9, 0.4 C: 1.0, 1.5, 1.1, 1.3
B: 2.5, 2.1, 1.9, 1.6 D: 0.8, 1.3, 1.1, 0.7
Interpret the results of the analysis summarized in the following table:
-Referring to Scenario 11-2, what should be the conclusion for the Levene's test for homogeneity of variances at a 5% level of significance?
A) There is insufficient evidence that the variances are all the same.
B) There is sufficient evidence that the variances are all the same.
C) There is insufficient evidence that the variances are not all the same.
D) There is sufficient evidence that the variances are not all the same.
Unlock Deck
Unlock for access to all 170 flashcards in this deck.
Unlock Deck
k this deck
29
SCENARIO 11-3
As part of an evaluation program, a sporting goods retailer wanted to compare the downhill coasting
speeds of 4 brands of bicycles. She took 3 of each brand and determined their maximum downhill
speeds. The results are presented in miles per hour in the table below.
Referring to Scenario 11-3, the sporting goods retailer decided to perform an ANOVA F test.
The amount of total variation or SST is __________.
Unlock Deck
Unlock for access to all 170 flashcards in this deck.
Unlock Deck
k this deck
30
SCENARIO 11-2
A realtor wants to compare the mean sales-to-appraisal ratios of residential properties sold in four
neighborhoods (A, B, C, and D). Four properties are randomly selected from each neighborhood and
the ratios recorded for each, as shown below.
A: 1.2, 1.1, 0.9, 0.4 C: 1.0, 1.5, 1.1, 1.3
B: 2.5, 2.1, 1.9, 1.6 D: 0.8, 1.3, 1.1, 0.7
Interpret the results of the analysis summarized in the following table:
Referring to Scenario 11-2, the null hypothesis for Levene's test for homogeneity of variances is
Unlock Deck
Unlock for access to all 170 flashcards in this deck.
Unlock Deck
k this deck
31
SCENARIO 11-2
A realtor wants to compare the mean sales-to-appraisal ratios of residential properties sold in four
neighborhoods (A, B, C, and D). Four properties are randomly selected from each neighborhood and
the ratios recorded for each, as shown below.
A: 1.2, 1.1, 0.9, 0.4 C: 1.0, 1.5, 1.1, 1.3
B: 2.5, 2.1, 1.9, 1.6 D: 0.8, 1.3, 1.1, 0.7
Interpret the results of the analysis summarized in the following table:
-Referring to Scenario 11-2, the numerator and denominator degrees of freedom for Levene's test for homogeneity of variances at a 5% level of significance are, respectively,
A) 3, 12
B) 12, 3
C) 3, 15
D) 15, 3
Unlock Deck
Unlock for access to all 170 flashcards in this deck.
Unlock Deck
k this deck
32
SCENARIO 11-3
As part of an evaluation program, a sporting goods retailer wanted to compare the downhill coasting
speeds of 4 brands of bicycles. She took 3 of each brand and determined their maximum downhill
speeds. The results are presented in miles per hour in the table below.
Referring to Scenario 11-3, construct the ANOVA table from the sample data.
Unlock Deck
Unlock for access to all 170 flashcards in this deck.
Unlock Deck
k this deck
33
SCENARIO 11-2
A realtor wants to compare the mean sales-to-appraisal ratios of residential properties sold in four
neighborhoods (A, B, C, and D). Four properties are randomly selected from each neighborhood and
the ratios recorded for each, as shown below.
A: 1.2, 1.1, 0.9, 0.4 C: 1.0, 1.5, 1.1, 1.3
B: 2.5, 2.1, 1.9, 1.6 D: 0.8, 1.3, 1.1, 0.7
Interpret the results of the analysis summarized in the following table:
-Referring to Scenario 11-2, the value of the test statistic for Levene's test for homogeneity of variances is
A) 0.25
B) 0.37
C) 4.36
D) 10.76
Unlock Deck
Unlock for access to all 170 flashcards in this deck.
Unlock Deck
k this deck
34
SCENARIO 11-2
A realtor wants to compare the mean sales-to-appraisal ratios of residential properties sold in four
neighborhoods (A, B, C, and D). Four properties are randomly selected from each neighborhood and
the ratios recorded for each, as shown below.
A: 1.2, 1.1, 0.9, 0.4 C: 1.0, 1.5, 1.1, 1.3
B: 2.5, 2.1, 1.9, 1.6 D: 0.8, 1.3, 1.1, 0.7
Interpret the results of the analysis summarized in the following table:
-Referring to Scenario 11-2, the p-value of the test statistic for Levene's test for homogeneity of variances is
A) 0.25
B) 0.64
C) 0.86
D) 3.49
Unlock Deck
Unlock for access to all 170 flashcards in this deck.
Unlock Deck
k this deck
35
SCENARIO 11-3
As part of an evaluation program, a sporting goods retailer wanted to compare the downhill coasting
speeds of 4 brands of bicycles. She took 3 of each brand and determined their maximum downhill
speeds. The results are presented in miles per hour in the table below.
-Referring to Scenario 11-3, the decision made implies that all 4 means are
significantly different.
Unlock Deck
Unlock for access to all 170 flashcards in this deck.
Unlock Deck
k this deck
36
SCENARIO 11-2
A realtor wants to compare the mean sales-to-appraisal ratios of residential properties sold in four
neighborhoods (A, B, C, and D). Four properties are randomly selected from each neighborhood and
the ratios recorded for each, as shown below.
A: 1.2, 1.1, 0.9, 0.4 C: 1.0, 1.5, 1.1, 1.3
B: 2.5, 2.1, 1.9, 1.6 D: 0.8, 1.3, 1.1, 0.7
Interpret the results of the analysis summarized in the following table:
-Referring to Scenario 11-2, the within group mean squares is
A) 0.0985
B) 0.2910
C) 1.0606
D) 1.1825
Unlock Deck
Unlock for access to all 170 flashcards in this deck.
Unlock Deck
k this deck
37
SCENARIO 11-3
As part of an evaluation program, a sporting goods retailer wanted to compare the downhill coasting
speeds of 4 brands of bicycles. She took 3 of each brand and determined their maximum downhill
speeds. The results are presented in miles per hour in the table below.
-Referring to Scenario 11-3, the test is valid only if the population of speeds has the
same variance for the 4 brands.
Unlock Deck
Unlock for access to all 170 flashcards in this deck.
Unlock Deck
k this deck
38
SCENARIO 11-3
As part of an evaluation program, a sporting goods retailer wanted to compare the downhill coasting
speeds of 4 brands of bicycles. She took 3 of each brand and determined their maximum downhill
speeds. The results are presented in miles per hour in the table below.
Referring to Scenario 11-3, the value of MSA is __________, while MSW is __________.
Unlock Deck
Unlock for access to all 170 flashcards in this deck.
Unlock Deck
k this deck
39
SCENARIO 11-3
As part of an evaluation program, a sporting goods retailer wanted to compare the downhill coasting
speeds of 4 brands of bicycles. She took 3 of each brand and determined their maximum downhill
speeds. The results are presented in miles per hour in the table below.
Referring to Scenario 11-3, in testing the null hypothesis that the mean downhill coasting speeds
of the 4 brands of bicycles are equal, the value of the test statistic is __________.
Unlock Deck
Unlock for access to all 170 flashcards in this deck.
Unlock Deck
k this deck
40
SCENARIO 11-2
A realtor wants to compare the mean sales-to-appraisal ratios of residential properties sold in four
neighborhoods (A, B, C, and D). Four properties are randomly selected from each neighborhood and
the ratios recorded for each, as shown below.
A: 1.2, 1.1, 0.9, 0.4 C: 1.0, 1.5, 1.1, 1.3
B: 2.5, 2.1, 1.9, 1.6 D: 0.8, 1.3, 1.1, 0.7
Interpret the results of the analysis summarized in the following table:
-Referring to Scenario 11-2,
A) at the 0.05 level of significance, the mean ratios for the 4 neighborhoods are not all the same.
B) at the 0.01 level of significance, the mean ratios for the 4 neighborhoods are all the same.
C) at the 0.10 level of significance, the mean ratios for the 4 neighborhoods are not significantly different.
D) at the 0.05 level of significance, the mean ratios for the 4 neighborhoods are not significantly different from 0.
Unlock Deck
Unlock for access to all 170 flashcards in this deck.
Unlock Deck
k this deck
41
SCENARIO 11-3
As part of an evaluation program, a sporting goods retailer wanted to compare the downhill coasting
speeds of 4 brands of bicycles. She took 3 of each brand and determined their maximum downhill
speeds. The results are presented in miles per hour in the table below.
-Referring to Scenario 11-3, the test is valid only if the population of speeds is
normally distributed.
Unlock Deck
Unlock for access to all 170 flashcards in this deck.
Unlock Deck
k this deck
42
SCENARIO 11-4
An agronomist wants to compare the crop yield of 3 varieties of chickpea seeds. She plants 15 fields,
5 with each variety. She then measures the crop yield in bushels per acre. Treating this as a
completely randomized design, the results are presented in the table that follows.
Referring to Scenario 11-4, the within-group variation or SSW is __________.
Unlock Deck
Unlock for access to all 170 flashcards in this deck.
Unlock Deck
k this deck
43
SCENARIO 11-4
An agronomist wants to compare the crop yield of 3 varieties of chickpea seeds. She plants 15 fields,
5 with each variety. She then measures the crop yield in bushels per acre. Treating this as a
completely randomized design, the results are presented in the table that follows.
Referring to Scenario 11-4, the among-group variation or SSA is __________.
Unlock Deck
Unlock for access to all 170 flashcards in this deck.
Unlock Deck
k this deck
44
SCENARIO 11-3
As part of an evaluation program, a sporting goods retailer wanted to compare the downhill coasting
speeds of 4 brands of bicycles. She took 3 of each brand and determined their maximum downhill
speeds. The results are presented in miles per hour in the table below.
-Referring to Scenario 11-3, based on the Tukey-Kramer procedure with an overall
level of significance of 0.05, the retailer would decide that there is no significant difference
between any pair of mean speeds.
Unlock Deck
Unlock for access to all 170 flashcards in this deck.
Unlock Deck
k this deck
45
SCENARIO 11-3
As part of an evaluation program, a sporting goods retailer wanted to compare the downhill coasting
speeds of 4 brands of bicycles. She took 3 of each brand and determined their maximum downhill
speeds. The results are presented in miles per hour in the table below.
Referring to Scenario 11-3, what is the p-value of the test statistic for Levene's test for
homogeneity of variances?
Unlock Deck
Unlock for access to all 170 flashcards in this deck.
Unlock Deck
k this deck
46
SCENARIO 11-3
As part of an evaluation program, a sporting goods retailer wanted to compare the downhill coasting
speeds of 4 brands of bicycles. She took 3 of each brand and determined their maximum downhill
speeds. The results are presented in miles per hour in the table below.
Referring to Scenario 11-3, what is the value of the test statistic for Levene's test for
homogeneity of variances?
Unlock Deck
Unlock for access to all 170 flashcards in this deck.
Unlock Deck
k this deck
47
SCENARIO 11-3
As part of an evaluation program, a sporting goods retailer wanted to compare the downhill coasting
speeds of 4 brands of bicycles. She took 3 of each brand and determined their maximum downhill
speeds. The results are presented in miles per hour in the table below.
-Referring to Scenario 11-3, what should be the decision for the Levene's test for homogeneity of variances at a 5% level of significance?
A) Reject the null hypothesis because the p-value is smaller than the level of significance.
B) Reject the null hypothesis because the p-value is larger than the level of significance.
C) Do not reject the null hypothesis because the p-value is smaller than the level of significance.
D) Do not reject the null hypothesis because the p-value is larger than the level of significance.
Unlock Deck
Unlock for access to all 170 flashcards in this deck.
Unlock Deck
k this deck
48
SCENARIO 11-3
As part of an evaluation program, a sporting goods retailer wanted to compare the downhill coasting
speeds of 4 brands of bicycles. She took 3 of each brand and determined their maximum downhill
speeds. The results are presented in miles per hour in the table below.
-Referring to Scenario 11-3, what should be the conclusion for the Levene's test for homogeneity of variances at a 5% level of significance?
A) There is insufficient evidence that the variances are all the same.
B) There is sufficient evidence that the variances are all the same.
C) There is insufficient evidence that the variances are not all the same.
D) There is sufficient evidence that the variances are not all the same.
Unlock Deck
Unlock for access to all 170 flashcards in this deck.
Unlock Deck
k this deck
49
SCENARIO 11-3
As part of an evaluation program, a sporting goods retailer wanted to compare the downhill coasting
speeds of 4 brands of bicycles. She took 3 of each brand and determined their maximum downhill
speeds. The results are presented in miles per hour in the table below.
Referring to Scenario 11-3, the null hypothesis for Levene's test for homogeneity of variances is
Unlock Deck
Unlock for access to all 170 flashcards in this deck.
Unlock Deck
k this deck
50
SCENARIO 11-3
As part of an evaluation program, a sporting goods retailer wanted to compare the downhill coasting
speeds of 4 brands of bicycles. She took 3 of each brand and determined their maximum downhill
speeds. The results are presented in miles per hour in the table below.
-Referring to Scenario 11-3, the test is robust to the violation of the assumption that
the population of speeds is normally distributed.
Unlock Deck
Unlock for access to all 170 flashcards in this deck.
Unlock Deck
k this deck
51
SCENARIO 11-3
As part of an evaluation program, a sporting goods retailer wanted to compare the downhill coasting
speeds of 4 brands of bicycles. She took 3 of each brand and determined their maximum downhill
speeds. The results are presented in miles per hour in the table below.
Referring to Scenario 11-3, the sporting goods retailer decided to compare the 4 treatment means
by using the Tukey-Kramer procedure with an overall level of significance of 0.05. There are
________ pairwise comparisons that can be made.
Unlock Deck
Unlock for access to all 170 flashcards in this deck.
Unlock Deck
k this deck
52
SCENARIO 11-3
As part of an evaluation program, a sporting goods retailer wanted to compare the downhill coasting
speeds of 4 brands of bicycles. She took 3 of each brand and determined their maximum downhill
speeds. The results are presented in miles per hour in the table below.
Referring to Scenario 11-3, using an overall level of significance of 0.05, the critical value of the
Studentized range Q used in calculating the critical range for the Tukey-Kramer procedure is
________.
Unlock Deck
Unlock for access to all 170 flashcards in this deck.
Unlock Deck
k this deck
53
SCENARIO 11-3
As part of an evaluation program, a sporting goods retailer wanted to compare the downhill coasting
speeds of 4 brands of bicycles. She took 3 of each brand and determined their maximum downhill
speeds. The results are presented in miles per hour in the table below.
-Referring to Scenario 11-3, based on the Tukey-Kramer procedure with an overall
level of significance of 0.05, the retailer would decide that there is a significant difference
between all pairs of mean speeds.
Unlock Deck
Unlock for access to all 170 flashcards in this deck.
Unlock Deck
k this deck
54
SCENARIO 11-3
As part of an evaluation program, a sporting goods retailer wanted to compare the downhill coasting
speeds of 4 brands of bicycles. She took 3 of each brand and determined their maximum downhill
speeds. The results are presented in miles per hour in the table below.
-Referring to Scenario 11-3, based on the Tukey-Kramer procedure with an overall
level of significance of 0.05, the retailer would decide that the 3 means other than the mean for
Tornado are not significantly different from each other.
Unlock Deck
Unlock for access to all 170 flashcards in this deck.
Unlock Deck
k this deck
55
SCENARIO 11-3
As part of an evaluation program, a sporting goods retailer wanted to compare the downhill coasting
speeds of 4 brands of bicycles. She took 3 of each brand and determined their maximum downhill
speeds. The results are presented in miles per hour in the table below.
Referring to Scenario 11-3, using an overall level of significance of 0.05, the critical range for the
Tukey-Kramer procedure is ________.
Unlock Deck
Unlock for access to all 170 flashcards in this deck.
Unlock Deck
k this deck
56
SCENARIO 11-3
As part of an evaluation program, a sporting goods retailer wanted to compare the downhill coasting
speeds of 4 brands of bicycles. She took 3 of each brand and determined their maximum downhill
speeds. The results are presented in miles per hour in the table below.
-Referring to Scenario 11-3, based on the Tukey-Kramer procedure with an overall
level of significance of 0.05, the retailer would decide that the mean speed for the Tornado brand
is significantly different from each of the mean speeds for other brands.
Unlock Deck
Unlock for access to all 170 flashcards in this deck.
Unlock Deck
k this deck
57
SCENARIO 11-4
An agronomist wants to compare the crop yield of 3 varieties of chickpea seeds. She plants 15 fields,
5 with each variety. She then measures the crop yield in bushels per acre. Treating this as a
completely randomized design, the results are presented in the table that follows.
Referring to Scenario 11-4, the agronomist decided to perform an ANOVA F test. The amount of
total variation or SST is __________.
Unlock Deck
Unlock for access to all 170 flashcards in this deck.
Unlock Deck
k this deck
58
SCENARIO 11-4
An agronomist wants to compare the crop yield of 3 varieties of chickpea seeds. She plants 15 fields,
5 with each variety. She then measures the crop yield in bushels per acre. Treating this as a
completely randomized design, the results are presented in the table that follows.
Referring to Scenario 11-4, the value of MSA is __________, while MSW is __________.
Unlock Deck
Unlock for access to all 170 flashcards in this deck.
Unlock Deck
k this deck
59
SCENARIO 11-3
As part of an evaluation program, a sporting goods retailer wanted to compare the downhill coasting
speeds of 4 brands of bicycles. She took 3 of each brand and determined their maximum downhill
speeds. The results are presented in miles per hour in the table below.
Referring to Scenario 11-3, what is the critical value of Levene's test for homogeneity of
variances at a 5% level of significance?
Unlock Deck
Unlock for access to all 170 flashcards in this deck.
Unlock Deck
k this deck
60
SCENARIO 11-3
As part of an evaluation program, a sporting goods retailer wanted to compare the downhill coasting
speeds of 4 brands of bicycles. She took 3 of each brand and determined their maximum downhill
speeds. The results are presented in miles per hour in the table below.
Referring to Scenario 11-3, what are the numerator and denominator degrees of freedom for
Levene's test for homogeneity of variances respectively?
Unlock Deck
Unlock for access to all 170 flashcards in this deck.
Unlock Deck
k this deck
61
SCENARIO 11-4
An agronomist wants to compare the crop yield of 3 varieties of chickpea seeds. She plants 15 fields,
5 with each variety. She then measures the crop yield in bushels per acre. Treating this as a
completely randomized design, the results are presented in the table that follows.
Referring to Scenario 11-4, state the null hypothesis that can be tested.
Unlock Deck
Unlock for access to all 170 flashcards in this deck.
Unlock Deck
k this deck
62
SCENARIO 11-5
A hotel chain has identically small sized resorts in 5 locations in different small islands. The data that
follow resulted from analyzing the hotel occupancies on randomly selected days in the 5 locations.
Referring to Scenario 11-5, the among-group variation or SSA is _________.
A hotel chain has identically small sized resorts in 5 locations in different small islands. The data that
follow resulted from analyzing the hotel occupancies on randomly selected days in the 5 locations.
Referring to Scenario 11-5, the among-group variation or SSA is _________.
Unlock Deck
Unlock for access to all 170 flashcards in this deck.
Unlock Deck
k this deck
63
SCENARIO 11-4
An agronomist wants to compare the crop yield of 3 varieties of chickpea seeds. She plants 15 fields,
5 with each variety. She then measures the crop yield in bushels per acre. Treating this as a
completely randomized design, the results are presented in the table that follows.
-Referring to Scenario 11-4, the null hypothesis should be rejected at 0.005 level of
significance.
Unlock Deck
Unlock for access to all 170 flashcards in this deck.
Unlock Deck
k this deck
64
SCENARIO 11-4
An agronomist wants to compare the crop yield of 3 varieties of chickpea seeds. She plants 15 fields,
5 with each variety. She then measures the crop yield in bushels per acre. Treating this as a
completely randomized design, the results are presented in the table that follows.
Referring to Scenario 11-4, the value of the test statistic is __________.
Unlock Deck
Unlock for access to all 170 flashcards in this deck.
Unlock Deck
k this deck
65
SCENARIO 11-4
An agronomist wants to compare the crop yield of 3 varieties of chickpea seeds. She plants 15 fields,
5 with each variety. She then measures the crop yield in bushels per acre. Treating this as a
completely randomized design, the results are presented in the table that follows.
-Referring to Scenario 11-4, the test is valid only if the population of crop yields
has the same variance for the 3 varieties.
Unlock Deck
Unlock for access to all 170 flashcards in this deck.
Unlock Deck
k this deck
66
SCENARIO 11-5
A hotel chain has identically small sized resorts in 5 locations in different small islands. The data that
follow resulted from analyzing the hotel occupancies on randomly selected days in the 5 locations.
-Referring to Scenario 11-5, if a level of significance of 0.05 is chosen, the null
hypothesis should be rejected.
Unlock Deck
Unlock for access to all 170 flashcards in this deck.
Unlock Deck
k this deck
67
SCENARIO 11-4
An agronomist wants to compare the crop yield of 3 varieties of chickpea seeds. She plants 15 fields,
5 with each variety. She then measures the crop yield in bushels per acre. Treating this as a
completely randomized design, the results are presented in the table that follows.
-Referring to Scenario 11-4, based on the Tukey-Kramer procedure with an overall
level of significance of 0.01, the agronomist would decide that there is a significant difference
between the crop yield of Smith and Walsh seeds.
Unlock Deck
Unlock for access to all 170 flashcards in this deck.
Unlock Deck
k this deck
68
SCENARIO 11-4
An agronomist wants to compare the crop yield of 3 varieties of chickpea seeds. She plants 15 fields,
5 with each variety. She then measures the crop yield in bushels per acre. Treating this as a
completely randomized design, the results are presented in the table that follows.
-Referring to Scenario 11-4, the decision made at 0.005 level of significance
implies that all 3 means are significantly different.
Unlock Deck
Unlock for access to all 170 flashcards in this deck.
Unlock Deck
k this deck
69
SCENARIO 11-4
An agronomist wants to compare the crop yield of 3 varieties of chickpea seeds. She plants 15 fields,
5 with each variety. She then measures the crop yield in bushels per acre. Treating this as a
completely randomized design, the results are presented in the table that follows.
Referring to Scenario 11-4, using an overall level of significance of 0.01, the critical value of the
Studentized range Q used in calculating the critical range for the Tukey-Kramer procedure is
________.
Unlock Deck
Unlock for access to all 170 flashcards in this deck.
Unlock Deck
k this deck
70
SCENARIO 11-4
An agronomist wants to compare the crop yield of 3 varieties of chickpea seeds. She plants 15 fields,
5 with each variety. She then measures the crop yield in bushels per acre. Treating this as a
completely randomized design, the results are presented in the table that follows.
Referring to Scenario 11-4, the null hypothesis will be rejected at a level of significance of 0.01 if
the value of the test statistic is greater than __________.
Unlock Deck
Unlock for access to all 170 flashcards in this deck.
Unlock Deck
k this deck
71
SCENARIO 11-5
A hotel chain has identically small sized resorts in 5 locations in different small islands. The data that
follow resulted from analyzing the hotel occupancies on randomly selected days in the 5 locations.
-Referring to Scenario 11-5, if a level of significance of 0.05 is chosen, the decision
made indicates that all 5 locations have different mean occupancy rates.
Unlock Deck
Unlock for access to all 170 flashcards in this deck.
Unlock Deck
k this deck
72
SCENARIO 11-4
An agronomist wants to compare the crop yield of 3 varieties of chickpea seeds. She plants 15 fields,
5 with each variety. She then measures the crop yield in bushels per acre. Treating this as a
completely randomized design, the results are presented in the table that follows.
Referring to Scenario 11-4, construct the ANOVA table from the sample data.
Unlock Deck
Unlock for access to all 170 flashcards in this deck.
Unlock Deck
k this deck
73
SCENARIO 11-5
A hotel chain has identically small sized resorts in 5 locations in different small islands. The data that
follow resulted from analyzing the hotel occupancies on randomly selected days in the 5 locations.
Referring to Scenario 11-5, the within-group variation or SSW is _________.
A hotel chain has identically small sized resorts in 5 locations in different small islands. The data that
follow resulted from analyzing the hotel occupancies on randomly selected days in the 5 locations.
Referring to Scenario 11-5, the within-group variation or SSW is _________.
Unlock Deck
Unlock for access to all 170 flashcards in this deck.
Unlock Deck
k this deck
74
SCENARIO 11-5
A hotel chain has identically small sized resorts in 5 locations in different small islands. The data that
follow resulted from analyzing the hotel occupancies on randomly selected days in the 5 locations.
Referring to Scenario 11-5, the total variation or SST is ________.
A hotel chain has identically small sized resorts in 5 locations in different small islands. The data that
follow resulted from analyzing the hotel occupancies on randomly selected days in the 5 locations.
Referring to Scenario 11-5, the total variation or SST is ________.
Unlock Deck
Unlock for access to all 170 flashcards in this deck.
Unlock Deck
k this deck
75
SCENARIO 11-4
An agronomist wants to compare the crop yield of 3 varieties of chickpea seeds. She plants 15 fields,
5 with each variety. She then measures the crop yield in bushels per acre. Treating this as a
completely randomized design, the results are presented in the table that follows.
-Referring to Scenario 11-4, based on the Tukey-Kramer procedure with an overall
level of significance of 0.01, the agronomist would decide that there is a significant difference
between the crop yield of Smith and Trevor seeds.
Unlock Deck
Unlock for access to all 170 flashcards in this deck.
Unlock Deck
k this deck
76
SCENARIO 11-4
An agronomist wants to compare the crop yield of 3 varieties of chickpea seeds. She plants 15 fields,
5 with each variety. She then measures the crop yield in bushels per acre. Treating this as a
completely randomized design, the results are presented in the table that follows.
Referring to Scenario 11-4, the agronomist decided to compare the 3 treatment means by using
the Tukey-Kramer procedure with an overall level of significance of 0.01. There are ________
pairwise comparisons that can be made.
Unlock Deck
Unlock for access to all 170 flashcards in this deck.
Unlock Deck
k this deck
77
SCENARIO 11-4
An agronomist wants to compare the crop yield of 3 varieties of chickpea seeds. She plants 15 fields,
5 with each variety. She then measures the crop yield in bushels per acre. Treating this as a
completely randomized design, the results are presented in the table that follows.
-Referring to Scenario 11-4, based on the Tukey-Kramer procedure with an overall
level of significance of 0.01, the agronomist would decide that there is a significant difference
between the crop yield of Walsh and Trevor seeds.
Unlock Deck
Unlock for access to all 170 flashcards in this deck.
Unlock Deck
k this deck
78
SCENARIO 11-5
A hotel chain has identically small sized resorts in 5 locations in different small islands. The data that
follow resulted from analyzing the hotel occupancies on randomly selected days in the 5 locations.
-Referring to Scenario 11-5, if a level of significance of 0.05 is chosen, the decision
made indicates that at least 2 of the 5 locations have different mean occupancy rates.
Unlock Deck
Unlock for access to all 170 flashcards in this deck.
Unlock Deck
k this deck
79
SCENARIO 11-4
An agronomist wants to compare the crop yield of 3 varieties of chickpea seeds. She plants 15 fields,
5 with each variety. She then measures the crop yield in bushels per acre. Treating this as a
completely randomized design, the results are presented in the table that follows.
Referring to Scenario 11-4, using an overall level of significance of 0.01, the critical range for the
Tukey-Kramer procedure is ________.
Unlock Deck
Unlock for access to all 170 flashcards in this deck.
Unlock Deck
k this deck
80
SCENARIO 11-4
An agronomist wants to compare the crop yield of 3 varieties of chickpea seeds. She plants 15 fields,
5 with each variety. She then measures the crop yield in bushels per acre. Treating this as a
completely randomized design, the results are presented in the table that follows.
-Referring to Scenario 11-4, the test is valid only if the population of crop yields is
normally distributed for the 3 varieties.
Unlock Deck
Unlock for access to all 170 flashcards in this deck.
Unlock Deck
k this deck
Unlock Deck
Unlock for access to all 170 flashcards in this deck.


