Deck 9: Modeling Our World
Full screen (f)
Question
Briefly discuss the conditions under which a linear function is a realistic model for the given situation.
Question
Question
Question
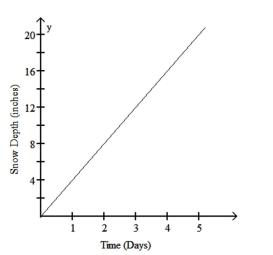
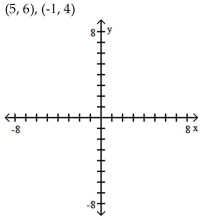
Plot and label the given points.
Question
Question
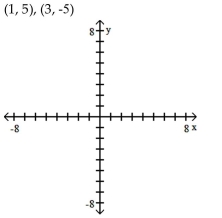
Plot and label the given points.
Question
Question
Question
Plot and label the given points.
Question
Plot and label the given points.
The population of a town with an initial population of 68,555 grows at a rate of 3.8% per year. Create an exponential function of the form Q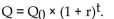

The population of a town with an initial population of 68,555 grows at a rate of 3.8% per year. Create an exponential function of the form Q
Question
Briefly discuss the conditions under which a linear function is a realistic model for the given situation.
Question
Briefly discuss the conditions under which a linear function is a realistic model for the given situation.
Question
Plot and label the given points.
Question
Plot and label the given points.
Question
Briefly discuss the conditions under which a linear function is a realistic model for the given situation.
Question
Provide an appropriate response.
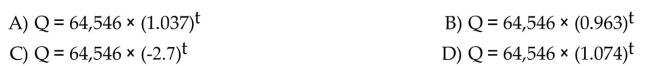
The following graph represents a function. Identify the independent and dependent variables and describe the domain and range.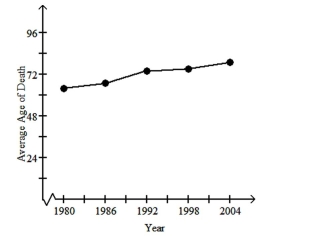
A)The independent variable is age and the dependent variable is time, measured in years. The domain is the ages between 0 and 79. The range is the years between 1980 and 2004.
B)The independent variable is time, measured in years, and the dependent variable is age. The domain is the years between 1980 and 2004. The range is the ages between 0 and 79.
C)The independent variable is age and the dependent variable is time, measured in years. The domain is the years between 1980 and 2004. The range is the ages between 0 and 79.
D)The independent variable is time, measured in years, and the dependent variable is age. The domain is the ages between 0 and 79. The range is the years between 1980 and 2004.
Question
Question
Write an equation for the linear function and use it to answer the given question.
The Math Club plans to pay a visitor $62 to speak at a fundraiser. Tickets will be sold for $2 each. Find an equation that gives the profit/loss for the event as it varies with the number of tickets sold.
How many people must attend the event for the club to break even.
The Math Club plans to pay a visitor $62 to speak at a fundraiser. Tickets will be sold for $2 each. Find an equation that gives the profit/loss for the event as it varies with the number of tickets sold.
How many people must attend the event for the club to break even.
Question
Question
Plot and label the given points.
Question
Create the required linear function an use it to answer the question.
Persons taking a 30-hour review course to prepare for a standardized exam average a score of 620 on that exam. Persons taking a 70-hour review course average a score of 798. Based on these two
Data points, create a linear equation for the function that describes how score varies as a function of
Time.
Question
Question
Solve the equation for the unknown quantity x.

Question
Question
Provide an appropriate response.
The population of a town with an initial population of 62,300 is decreasing at a rate of 3.2% per year. Make a graph of the exponential function.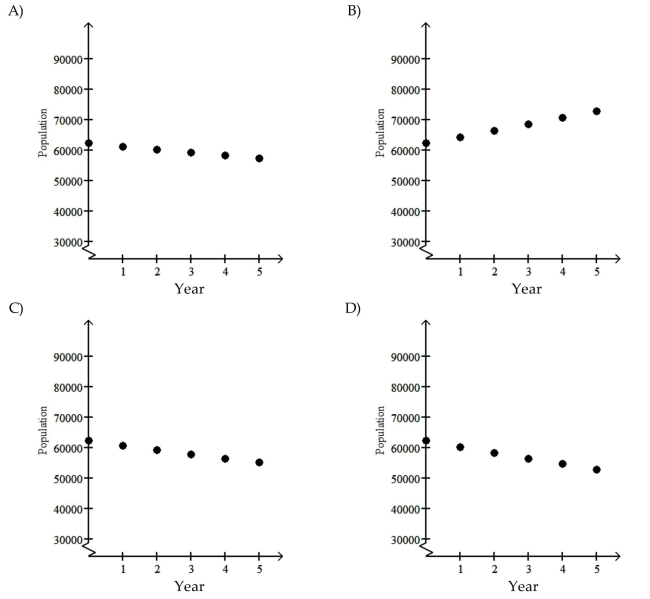
The population of a town with an initial population of 62,300 is decreasing at a rate of 3.2% per year. Make a graph of the exponential function.
Question
Question
Question
Question
Question
Draw a graph of the function and use the graph to answer the question.
The cost of tuition at one community college is $400 plus $125 per credit. Graph the equation, and find the cost if a student registers for 12 credits.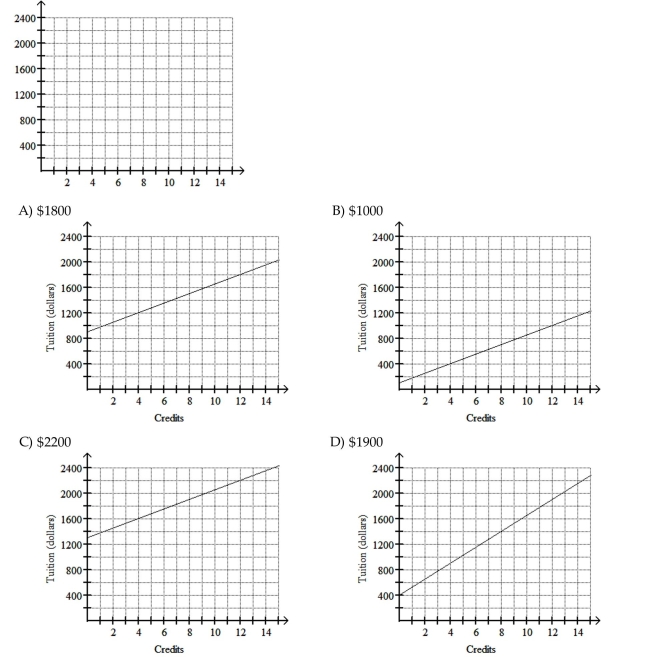
The cost of tuition at one community college is $400 plus $125 per credit. Graph the equation, and find the cost if a student registers for 12 credits.
Question
Question
Question
Provide an appropriate response.
The given table represents a function. Identify the independent and dependent variables, and describe the domain and range.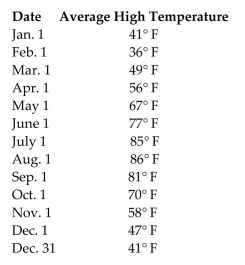
A)The variables are (temperature, time)or (temperature, date). The domain is all temperatures between 36° and 86° and the range is all days over the course of a year.
B)The variables are (temperature, time)or (temperature, date). The domain is all temperatures between 41° and 41° and the range is all days over the course of a year.
C)The variables are (time, temperature)or (date, temperature). The domain is all days over the course of a year. The range is temperatures between 36° and 86°.
D)The variables are (time, temperature)or (date, temperature). The domain is all days over the course of a year. The range is temperatures between 41° and 41°.
Question
Question
Question
Write an equation for the linear function and use it to answer the given question.
The cost of renting a car is a flat $44, plus an additional 0.24 cents per mile that you drive. How far can you drive for $89?
The cost of renting a car is a flat $44, plus an additional 0.24 cents per mile that you drive. How far can you drive for $89?
Question
Question
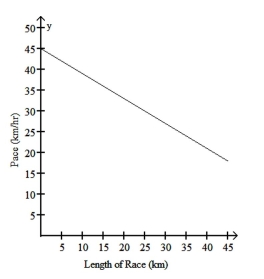
Draw a graph of the function and use the graph to answer the question.
During the month of January, the depth of the snow, at the base of one ski resort, decreased by 2 inches each day. On December 31st there was a base of 64 inches. Graph the equation and use the
Graph to estimate the depth of snow on January 28th.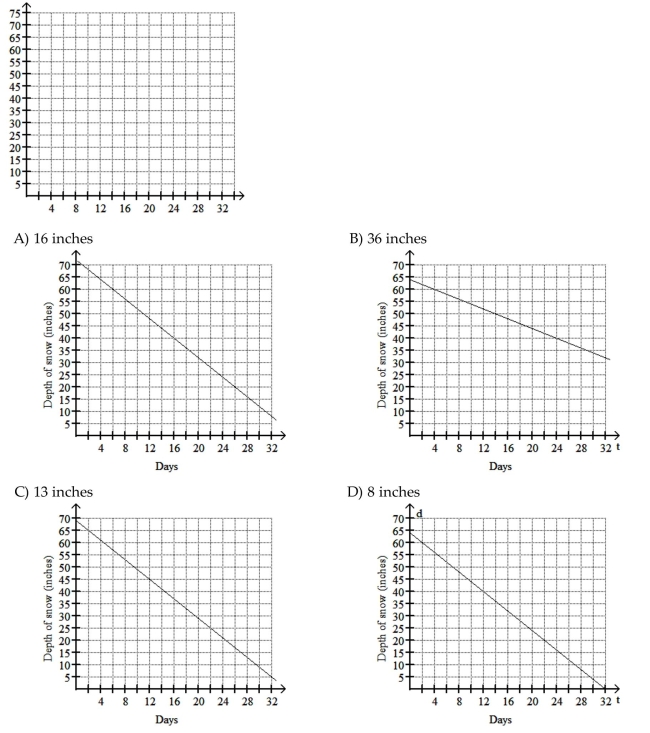
During the month of January, the depth of the snow, at the base of one ski resort, decreased by 2 inches each day. On December 31st there was a base of 64 inches. Graph the equation and use the
Graph to estimate the depth of snow on January 28th.
Question
Write an equation for the linear function and use it to answer the given question.
The price of a particular model car is $10,171 today and rises with time at a constant rate of $1146 per year. How much will a new car cost in 4.1 years?
The price of a particular model car is $10,171 today and rises with time at a constant rate of $1146 per year. How much will a new car cost in 4.1 years?
Question
Provide an appropriate response.
Question
Question
Solve the equation for the unknown quantity x.

Question
Question
Write an equation for the linear function and use it to answer the given question.
In the town of Oak Forest, a 2% local sales tax and a 9% state sales tax are charged on all retail sales. Let p be the before-tax amount of a purchase in dollars. Let T be the after-tax amount of the
Purchase. Find a linear equation that describes how T varies with p. What is the total price of an
Item that costs $50 before taxes?
Question
Question
Provide an appropriate response.
The population of a town with an initial population of 65,747 grows at a rate of 3.7% per year. Create a table showing the value of the quantity Q for the first 5 years or growth or decay.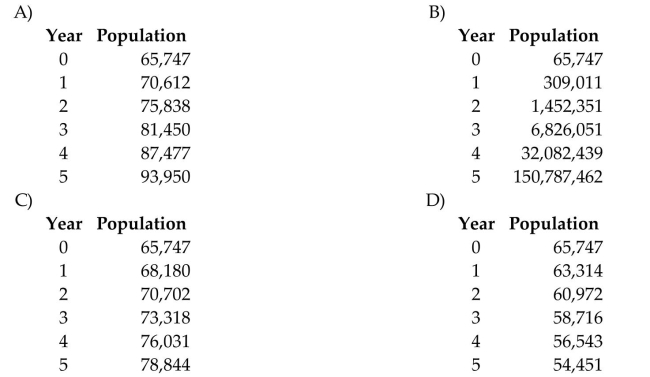
The population of a town with an initial population of 65,747 grows at a rate of 3.7% per year. Create a table showing the value of the quantity Q for the first 5 years or growth or decay.
Question
Solve the equation for the unknown quantity x.

Question
Question
Question
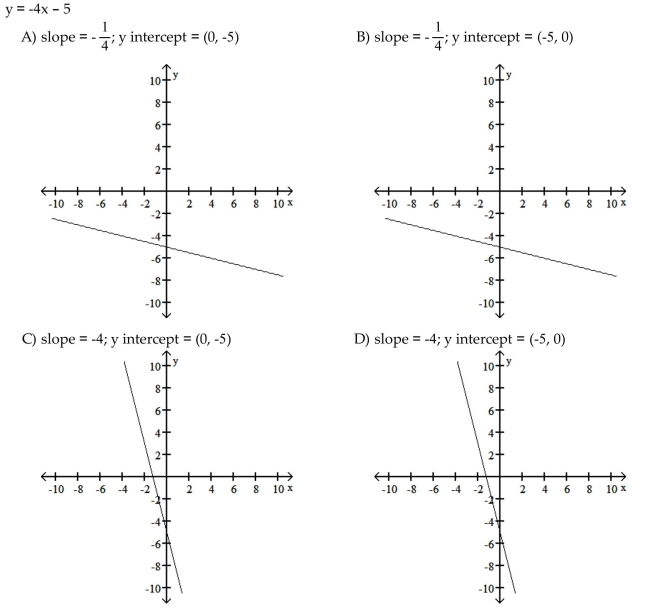
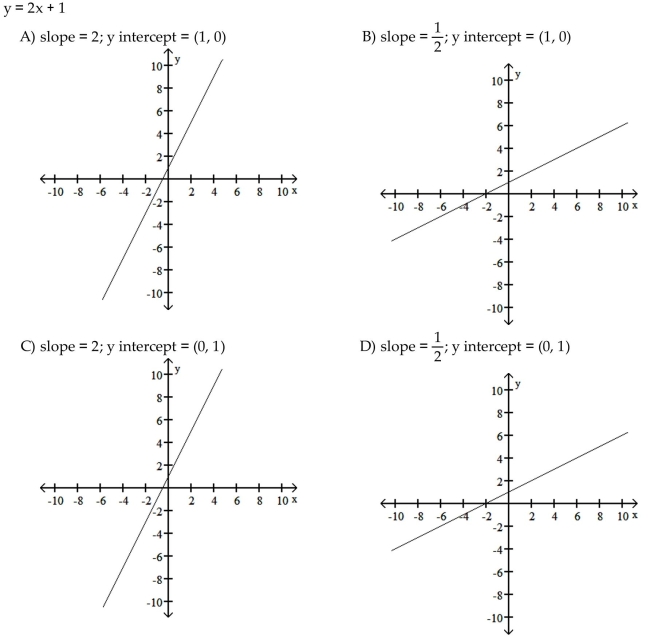
Find the slope of the graph and they y -intercept. Then sketch the graph for values of x between -10 and 10.
Question
Create the required linear function an use it to answer the question.
In 1995 the United States recovered 26% of its municipal solid wastes through recycling, up from 17% in 1990. Let P represent the percentage recycled and t the number of years since 1990. Based on
These two data points, create a linear equation for the function that describes how P varies as a
Function of time.
Question
Question
Question
Provide an appropriate response.
Cars sold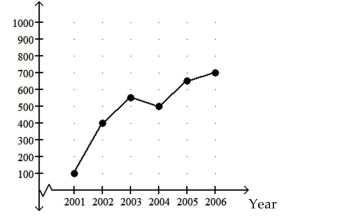 Crafty Bill's Cool Car Sales opened as a used car sales lot in 2001. The graph shows the number of cars sold as a function of time. What is the approximate number of cars sold in 2003?
A)550 cars
B)400 cars
C)500 cars
D)350 cars
Cars sold
Crafty Bill's Cool Car Sales opened as a used car sales lot in 2001. The graph shows the number of cars sold as a function of time. What is the approximate number of cars sold in 2003?A)550 cars
B)400 cars
C)500 cars
D)350 cars
Question
The population of a town with an initial population of 60,196 is decreasing at a rate of 4.2% per year. Create a table showing the value of the quantity Q for the first 5 years or growth or decay. 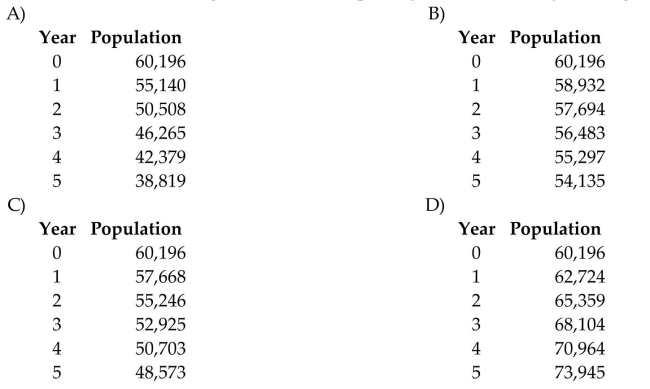
Question
Write an equation for the linear function and use it to answer the given question.
You can purchase a motorcycle for $7101 or lease it for a down payment of $783 and $243 per month. Find an equation that describes how the cost of the lease depends on time. How long can
You lease the motorcycle before you've paid more than its purchase price.
You can purchase a motorcycle for $7101 or lease it for a down payment of $783 and $243 per month. Find an equation that describes how the cost of the lease depends on time. How long can
You lease the motorcycle before you've paid more than its purchase price.
Question
Provide an appropriate response.
The population of a town with an initial population of 64,546 is decreasing at a rate of 3.7% per year. Create an exponential function of the form Q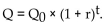
The population of a town with an initial population of 64,546 is decreasing at a rate of 3.7% per year. Create an exponential function of the form Q
Question
Provide an appropriate response.
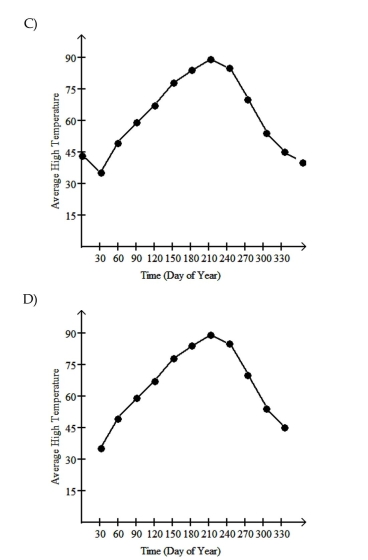
The following graph represents a function. Describe the function in words.
A)The function shows a steadily increasing average age of death between 1980 and 2004.
B)The function shows a steadily decreasing average age of death between 1980 and 2004.
C)The function shows that the average age of death increases between 1980 and 1992 and does not change between 1992 and 2004.
D)The function shows that the average age of death per year does not change between 1980 and 2004.
Question
Write an equation for the linear function and use it to answer the given question.
Normaltown High School's pool record for the 100-yard freestyle was 47.8 in 1990. Assume that the record falls at a constant rate of 0.03 second per year. What does the model predict for the
Record in 2010?
Normaltown High School's pool record for the 100-yard freestyle was 47.8 in 1990. Assume that the record falls at a constant rate of 0.03 second per year. What does the model predict for the
Record in 2010?
Question
Create the required linear function an use it to answer the question.
Suppose that you were 22 inches long at birth and 3.5 feet tall on your tenth birthday. Based on these two data points, create a linear equation for the function that describes how height varies
With age. Use the equation to predict the height at age 2 and 41.
Suppose that you were 22 inches long at birth and 3.5 feet tall on your tenth birthday. Based on these two data points, create a linear equation for the function that describes how height varies
With age. Use the equation to predict the height at age 2 and 41.
Question
Provide an appropriate response.
The population of a town with an initial population of 70,430 grows at a rate of 2.5% per year. Make a graph of the exponential function.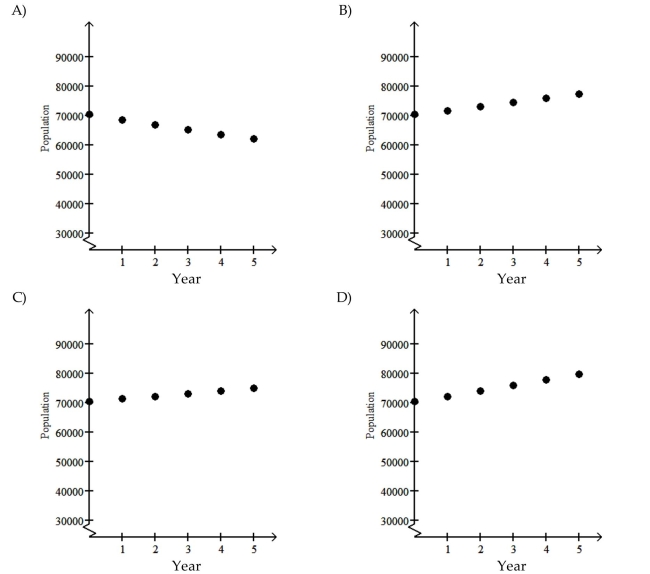
The population of a town with an initial population of 70,430 grows at a rate of 2.5% per year. Make a graph of the exponential function.
Question
Question
Find the slope of the graph and they y -intercept. Then sketch the graph for values of x between -10 and 10.
Question
Question

Question
Solve the equation for the unknown quantity x.

Question
Find the slope of the graph and they y -intercept. Then sketch the graph for values of x between -10 and 10.
Question
Question
The given table represents a function. Make a clear graph of the function. 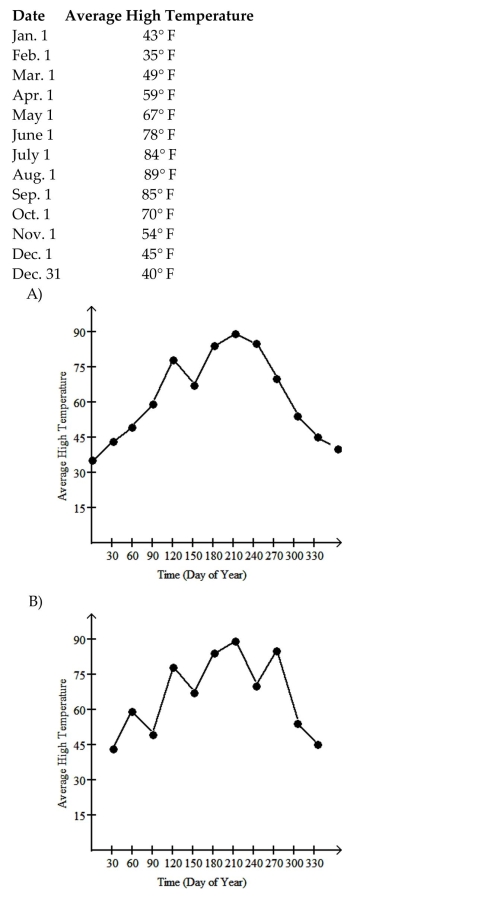
Question
Write an equation for the linear function and use it to answer the given question.
You can rent time on computers at the local copy center for a $7 setup charge and an additional $4 for every 5 minutes. How much time can you rent for $16?
You can rent time on computers at the local copy center for a $7 setup charge and an additional $4 for every 5 minutes. How much time can you rent for $16?
Question
Solve the equation for the unknown quantity x.

Question
Question
Question
Question
Question
Question
 Write a short statement that expresses a possible function between the given variables.
(number of cars on road, air quality)
A)As the quality of the air deteriorates, the number of cars on the road decreases.
B)As the quality of the air deteriorates, the number of cars on the road increases.
C)As the number of cars on the road decreases, the quality of the air generally deteriorates.
D)As the number of cars on the road increases, the quality of the air generally deteriorates.
Question
Solve the equation for the unknown quantity x.

Question
Question

Unlock Deck
Sign up to unlock the cards in this deck!
Unlock Deck
Unlock Deck
1/85
Play
Full screen (f)
Deck 9: Modeling Our World
1
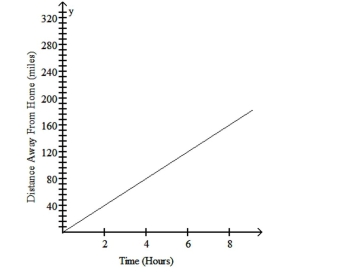
Briefly discuss the conditions under which a linear function is a realistic model for the given situation.
a)On a long trip, distance from home increases with time.
b)20 miles per hour.
c)Good model if speed is constant for 8 hours.
b)20 miles per hour.
c)Good model if speed is constant for 8 hours.
2
For the given function:
a)Describe an appropriate domain and range for the function.
b)Make a rough sketch of a graph of the function.
c)Briefly discuss the validity of your graph as a model of the true function.
(hours worked, yearly wages)
a)Describe an appropriate domain and range for the function.
b)Make a rough sketch of a graph of the function.
c)Briefly discuss the validity of your graph as a model of the true function.
(hours worked, yearly wages)
Answers may vary.
a)The domain of the function is the amount of hours worked per week between 10
and 60 hours and the range is yearly wages (in thousands of dollars)from $15K to
$90K.
b)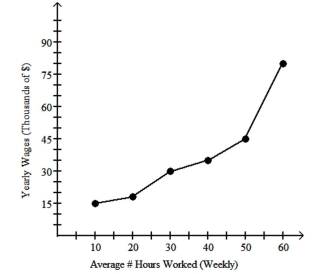 c)The function should be roughly increasing. Typically the more hours someone
works, the more money they make. Any time over 40 hours, usually includes an
overtime wage which raises the overall yearly wages dramatically. However, many
people have a fixed salary regardless of how many hours they work, so this may not
represent an appropriate model.
a)The domain of the function is the amount of hours worked per week between 10
and 60 hours and the range is yearly wages (in thousands of dollars)from $15K to
$90K.
b)
c)The function should be roughly increasing. Typically the more hours someoneworks, the more money they make. Any time over 40 hours, usually includes an
overtime wage which raises the overall yearly wages dramatically. However, many
people have a fixed salary regardless of how many hours they work, so this may not
represent an appropriate model.
3
In the following situation, state whether two variables are related in a way that might be described by a function. If so,
identify the independent and dependent variables.
You make a list of the titles of books in a public library and their copyright year.
A)Independend variable, book title; dependent variable, copyright year
B)Independend variable, copyright year; dependent variable, book title
C)does not describe a function
C
4
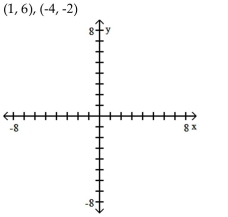
Plot and label the given points.
Unlock Deck
Unlock for access to all 85 flashcards in this deck.
Unlock Deck
k this deck
5
In the following situation, state whether two variables are related in a way that might be described by a function. If so,
identify the independent and dependent variables.
You are taking a road trip in a car and want to know how far you've traveled (read the odometer) at various times during your trip.
A)Independend variable, distance traveled; dependent variable, time
B)Independend variable, time; dependent variable, distance traveled
C)does not describe a function
Unlock Deck
Unlock for access to all 85 flashcards in this deck.
Unlock Deck
k this deck
6
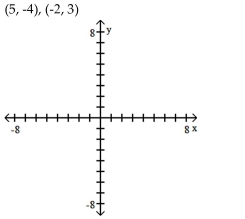
Plot and label the given points.
Unlock Deck
Unlock for access to all 85 flashcards in this deck.
Unlock Deck
k this deck
7
Write the word or phrase that best completes each statement or answers the question.For the given function:
a)Describe an appropriate domain and range for the function.
b)Make a rough sketch of a graph of the function.
c)Briefly discuss the validity of your graph as a model of the true function.
(size of truck, average fuel mileage)
a)Describe an appropriate domain and range for the function.
b)Make a rough sketch of a graph of the function.
c)Briefly discuss the validity of your graph as a model of the true function.
(size of truck, average fuel mileage)
Unlock Deck
Unlock for access to all 85 flashcards in this deck.
Unlock Deck
k this deck
8
Plot and label the given points.
True or False? The rate of change is equal to the slope of the graph.
True or False? The rate of change is equal to the slope of the graph.
Unlock Deck
Unlock for access to all 85 flashcards in this deck.
Unlock Deck
k this deck
9
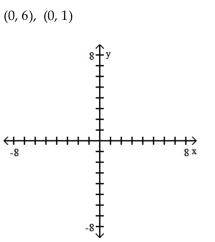
Plot and label the given points.
Unlock Deck
Unlock for access to all 85 flashcards in this deck.
Unlock Deck
k this deck
10
Plot and label the given points.
The population of a town with an initial population of 68,555 grows at a rate of 3.8% per year. Create an exponential function of the form Q
The population of a town with an initial population of 68,555 grows at a rate of 3.8% per year. Create an exponential function of the form Q
Unlock Deck
Unlock for access to all 85 flashcards in this deck.
Unlock Deck
k this deck
11
Briefly discuss the conditions under which a linear function is a realistic model for the given situation.
Unlock Deck
Unlock for access to all 85 flashcards in this deck.
Unlock Deck
k this deck
12
Briefly discuss the conditions under which a linear function is a realistic model for the given situation.
Unlock Deck
Unlock for access to all 85 flashcards in this deck.
Unlock Deck
k this deck
13
Plot and label the given points.
Unlock Deck
Unlock for access to all 85 flashcards in this deck.
Unlock Deck
k this deck
14
Plot and label the given points.
Unlock Deck
Unlock for access to all 85 flashcards in this deck.
Unlock Deck
k this deck
15
Briefly discuss the conditions under which a linear function is a realistic model for the given situation.
Unlock Deck
Unlock for access to all 85 flashcards in this deck.
Unlock Deck
k this deck
16
Provide an appropriate response.
The following graph represents a function. Identify the independent and dependent variables and describe the domain and range.
A)The independent variable is age and the dependent variable is time, measured in years. The domain is the ages between 0 and 79. The range is the years between 1980 and 2004.
B)The independent variable is time, measured in years, and the dependent variable is age. The domain is the years between 1980 and 2004. The range is the ages between 0 and 79.
C)The independent variable is age and the dependent variable is time, measured in years. The domain is the years between 1980 and 2004. The range is the ages between 0 and 79.
D)The independent variable is time, measured in years, and the dependent variable is age. The domain is the ages between 0 and 79. The range is the years between 1980 and 2004.
Unlock Deck
Unlock for access to all 85 flashcards in this deck.
Unlock Deck
k this deck
17
For the given function:
a)Describe an appropriate domain and range for the function.
b)Make a rough sketch of a graph of the function.
c)Briefly discuss the validity of your graph as a model of the true function.
(time spent studying, percentage on exam)
a)Describe an appropriate domain and range for the function.
b)Make a rough sketch of a graph of the function.
c)Briefly discuss the validity of your graph as a model of the true function.
(time spent studying, percentage on exam)
Unlock Deck
Unlock for access to all 85 flashcards in this deck.
Unlock Deck
k this deck
18
Write an equation for the linear function and use it to answer the given question.
The Math Club plans to pay a visitor $62 to speak at a fundraiser. Tickets will be sold for $2 each. Find an equation that gives the profit/loss for the event as it varies with the number of tickets sold.
How many people must attend the event for the club to break even.
The Math Club plans to pay a visitor $62 to speak at a fundraiser. Tickets will be sold for $2 each. Find an equation that gives the profit/loss for the event as it varies with the number of tickets sold.
How many people must attend the event for the club to break even.
Unlock Deck
Unlock for access to all 85 flashcards in this deck.
Unlock Deck
k this deck
19
For the given function:
a)Describe an appropriate domain and range for the function.
b)Make a rough sketch of a graph of the function.
c)Briefly discuss the validity of your graph as a model of the true function.
(miles ran per week, 5K time)
a)Describe an appropriate domain and range for the function.
b)Make a rough sketch of a graph of the function.
c)Briefly discuss the validity of your graph as a model of the true function.
(miles ran per week, 5K time)
Unlock Deck
Unlock for access to all 85 flashcards in this deck.
Unlock Deck
k this deck
20
Plot and label the given points.
Unlock Deck
Unlock for access to all 85 flashcards in this deck.
Unlock Deck
k this deck
21
Create the required linear function an use it to answer the question.
Persons taking a 30-hour review course to prepare for a standardized exam average a score of 620 on that exam. Persons taking a 70-hour review course average a score of 798. Based on these two
Data points, create a linear equation for the function that describes how score varies as a function of
Time.
Unlock Deck
Unlock for access to all 85 flashcards in this deck.
Unlock Deck
k this deck
22
True or False? The demand for basketball tickets is a function of their price.
Unlock Deck
Unlock for access to all 85 flashcards in this deck.
Unlock Deck
k this deck
23
Solve the equation for the unknown quantity x.
Unlock Deck
Unlock for access to all 85 flashcards in this deck.
Unlock Deck
k this deck
24
Provide an appropriate response.
The general shape of an exponential growth function is a ______.
A)rising line
B)falling curve
C)falling line
D)rising curve
The general shape of an exponential growth function is a ______.
A)rising line
B)falling curve
C)falling line
D)rising curve
Unlock Deck
Unlock for access to all 85 flashcards in this deck.
Unlock Deck
k this deck
25
Provide an appropriate response.
The population of a town with an initial population of 62,300 is decreasing at a rate of 3.2% per year. Make a graph of the exponential function.
The population of a town with an initial population of 62,300 is decreasing at a rate of 3.2% per year. Make a graph of the exponential function.
Unlock Deck
Unlock for access to all 85 flashcards in this deck.
Unlock Deck
k this deck
26
Provide an appropriate response.
If prices of gold decrease at a monthly rate of 0.7%, by what percentage do they decrease in a year.
A)10.1%
B)8.1%
C)8.4%
D)8.7%
If prices of gold decrease at a monthly rate of 0.7%, by what percentage do they decrease in a year.
A)10.1%
B)8.1%
C)8.4%
D)8.7%
Unlock Deck
Unlock for access to all 85 flashcards in this deck.
Unlock Deck
k this deck
27
Write a short statement that expresses a possible function between the given variables.
(price of a DVD player, demand for DVD player)
A)As the price of a DVD player increases, the demand generally increases.
B)As the demand of a DVD player decreases, the price generally increases.
C)As the demand of a DVD player increases, the price generally decreases.
D)As the price of a DVD player increases, the demand generally decreases.
Unlock Deck
Unlock for access to all 85 flashcards in this deck.
Unlock Deck
k this deck
28
Provide an appropriate response.
Between 1998 and 2002, the average rate of inflation for a particular country was about 5% per year. If a cart of groceries cost $109 in 1998, what did it cost in 2002?
A)$139.11
B)$159.59
C)$126.18
D)$132.49
Between 1998 and 2002, the average rate of inflation for a particular country was about 5% per year. If a cart of groceries cost $109 in 1998, what did it cost in 2002?
A)$139.11
B)$159.59
C)$126.18
D)$132.49
Unlock Deck
Unlock for access to all 85 flashcards in this deck.
Unlock Deck
k this deck
29
Provide an appropriate response.
True or False? A negative slope means a line falling right.
A)False
B)True
True or False? A negative slope means a line falling right.
A)False
B)True
Unlock Deck
Unlock for access to all 85 flashcards in this deck.
Unlock Deck
k this deck
30
Draw a graph of the function and use the graph to answer the question.
The cost of tuition at one community college is $400 plus $125 per credit. Graph the equation, and find the cost if a student registers for 12 credits.
The cost of tuition at one community college is $400 plus $125 per credit. Graph the equation, and find the cost if a student registers for 12 credits.
Unlock Deck
Unlock for access to all 85 flashcards in this deck.
Unlock Deck
k this deck
31
Provide an appropriate response.
The process of measuring the ages of rocks, bones, pottery, or other solid objects that contain radioactive elements is called ________.
A)doubling time
B)radioactive measuring
C)half-life
D)radioactive decay
The process of measuring the ages of rocks, bones, pottery, or other solid objects that contain radioactive elements is called ________.
A)doubling time
B)radioactive measuring
C)half-life
D)radioactive decay
Unlock Deck
Unlock for access to all 85 flashcards in this deck.
Unlock Deck
k this deck
32
Provide an appropriate response.
A certain drug is eliminated from the bloodstream exponentially with a half-life of 24 hours. Suppose that a patient receives an initial dose of 15 milligrams of the drug at midnight. How much
Of the drug is in the patient's blood at noon the next day?
A)10.61 mg
B)3.75 mg
C)5.3 mg
D)0.71 mg
A certain drug is eliminated from the bloodstream exponentially with a half-life of 24 hours. Suppose that a patient receives an initial dose of 15 milligrams of the drug at midnight. How much
Of the drug is in the patient's blood at noon the next day?
A)10.61 mg
B)3.75 mg
C)5.3 mg
D)0.71 mg
Unlock Deck
Unlock for access to all 85 flashcards in this deck.
Unlock Deck
k this deck
33
Provide an appropriate response.
The given table represents a function. Identify the independent and dependent variables, and describe the domain and range.
A)The variables are (temperature, time)or (temperature, date). The domain is all temperatures between 36° and 86° and the range is all days over the course of a year.
B)The variables are (temperature, time)or (temperature, date). The domain is all temperatures between 41° and 41° and the range is all days over the course of a year.
C)The variables are (time, temperature)or (date, temperature). The domain is all days over the course of a year. The range is temperatures between 36° and 86°.
D)The variables are (time, temperature)or (date, temperature). The domain is all days over the course of a year. The range is temperatures between 41° and 41°.
Unlock Deck
Unlock for access to all 85 flashcards in this deck.
Unlock Deck
k this deck
34
Create the required linear function an use it to answer the question.
Persons taking a 30-hour review course to prepare for a standardized exam average a score of 620 on that exam. Persons taking a 70-hour review course average a score of 780. Based on these two
Data points, create a linear equation for the function that describes how score varies as a function of
Time. Use this function to predict an average score for persons taking a 43-hour review course.
Round your answer to the tenths place.
A)664.7
B)676.2
C)672.0
D)686.0
Unlock Deck
Unlock for access to all 85 flashcards in this deck.
Unlock Deck
k this deck
35
The given situation involves a rate of change that you may assume to be constant. Write a statement that describes howone variable varies with respect to another, give the rate of change numerically (with units), and use the rate of changerule to answer the questions.
A gas station owner finds that for every penny increase in the price of gasoline, she sells 1516 fewer gallons of gas per week. How much more or less gas will she sell if she raises the price by 10 cents
Per gallon? If she decreases the price by 2 cents per gallon?
A)At a particular gas station, sales decrease with respect to price by 1516 gallons per cent. The rate of change is 1516 gallons per cent. If the price is increased by 10 cents per gallon, the
Change in gas sales is 7580 gallons. If the price is decreased by 2 cents, gas sales increase by
-1516 gallons.
B)At a particular gas station, sales decrease with respect to price by 1516 gallons per cent. The rate of change is -1516 gallons per cent. If the price is increased by 10 cents per gallon, the
Change in gas sales is -18,950 gallons. If the price is decreased by 2 cents, gas sales increase by
-3790 gallons.
C)At a particular gas station, sales decrease with respect to price by 1516 gallons per cent. The rate of change is -1516 gallons per cent. If the price is increased by 10 cents per gallon, the
Change in gas sales is -15,160 gallons. If the price is decreased by 2 cents, gas sales increase by
3032 gallons.
D)At a particular gas station, sales decrease with respect to price by 1516 gallons per cent. The rate of change is 1516 gallons per cent. If the price is increased by 10 cents per gallon, the
Change in gas sales is 11,370 gallons. If the price is decreased by 2 cents, gas sales increase by
2274 gallons.
Unlock Deck
Unlock for access to all 85 flashcards in this deck.
Unlock Deck
k this deck
36
Write an equation for the linear function and use it to answer the given question.
The cost of renting a car is a flat $44, plus an additional 0.24 cents per mile that you drive. How far can you drive for $89?
The cost of renting a car is a flat $44, plus an additional 0.24 cents per mile that you drive. How far can you drive for $89?
Unlock Deck
Unlock for access to all 85 flashcards in this deck.
Unlock Deck
k this deck
37
The given situation involves a rate of change that you may assume to be constant. Write a statement that describes howone variable varies with respect to another, give the rate of change numerically (with units), and use the rate of changerule to answer the questions.
You drive along the highway at a constant speed of 45 miles per hour. How far do you travel in 3.4 hours? In 6.5 hours? Write a statement that describes how one variable varies with respect to
Another.
A)Your distance traveled changes with respect to time at a rate of 45 miles per hour. The rate of change is 45 mi/hr. In 3.4 hours, you travel 191.25 miles. In 6.5 hours, you travel 365.625
Miles.
B)Your distance traveled changes with respect to time at a rate of 45 miles per hour. The rate of change is 45 mi/hr. In 3.4 hours, you travel 76.5 miles. In 6.5 hours, you travel 146.25 miles.
C)Your distance traveled changes with respect to time at a rate of 45 miles per hour. The rate of change is 45 mi/hr. In 3.4 hours, you travel 153 miles. In 6.5 hours, you travel 292.5 miles.
D)Your distance traveled changes with respect to time at a rate of 45 miles per hour. The rate of change is 45 mi/hr. In 3.4 hours, you travel 114.75 miles. In 6.5 hours, you travel 219.375
Miles.
Unlock Deck
Unlock for access to all 85 flashcards in this deck.
Unlock Deck
k this deck
38
Draw a graph of the function and use the graph to answer the question.
During the month of January, the depth of the snow, at the base of one ski resort, decreased by 2 inches each day. On December 31st there was a base of 64 inches. Graph the equation and use the
Graph to estimate the depth of snow on January 28th.
During the month of January, the depth of the snow, at the base of one ski resort, decreased by 2 inches each day. On December 31st there was a base of 64 inches. Graph the equation and use the
Graph to estimate the depth of snow on January 28th.
Unlock Deck
Unlock for access to all 85 flashcards in this deck.
Unlock Deck
k this deck
39
Write an equation for the linear function and use it to answer the given question.
The price of a particular model car is $10,171 today and rises with time at a constant rate of $1146 per year. How much will a new car cost in 4.1 years?
The price of a particular model car is $10,171 today and rises with time at a constant rate of $1146 per year. How much will a new car cost in 4.1 years?
Unlock Deck
Unlock for access to all 85 flashcards in this deck.
Unlock Deck
k this deck
40
Provide an appropriate response.
Unlock Deck
Unlock for access to all 85 flashcards in this deck.
Unlock Deck
k this deck
41
What is comprised of the values of the dependent variable?
A)Range
B)Periodic function
C)Model
D)Domain
A)Range
B)Periodic function
C)Model
D)Domain
Unlock Deck
Unlock for access to all 85 flashcards in this deck.
Unlock Deck
k this deck
42
Solve the equation for the unknown quantity x.
Unlock Deck
Unlock for access to all 85 flashcards in this deck.
Unlock Deck
k this deck
43
True or False? Exponential functions are useful for modeling enviromental issues.
Unlock Deck
Unlock for access to all 85 flashcards in this deck.
Unlock Deck
k this deck
44
Write an equation for the linear function and use it to answer the given question.
In the town of Oak Forest, a 2% local sales tax and a 9% state sales tax are charged on all retail sales. Let p be the before-tax amount of a purchase in dollars. Let T be the after-tax amount of the
Purchase. Find a linear equation that describes how T varies with p. What is the total price of an
Item that costs $50 before taxes?
Unlock Deck
Unlock for access to all 85 flashcards in this deck.
Unlock Deck
k this deck
45
There are currently 67 million cars in a certain country, decreasing by 0.5% annually. How many years will it take for this country to have 38 million cars? Round to the nearest year.
A)673 years
B)29 years
C)113 years
D)58 years
A)673 years
B)29 years
C)113 years
D)58 years
Unlock Deck
Unlock for access to all 85 flashcards in this deck.
Unlock Deck
k this deck
46
Provide an appropriate response.
The population of a town with an initial population of 65,747 grows at a rate of 3.7% per year. Create a table showing the value of the quantity Q for the first 5 years or growth or decay.
The population of a town with an initial population of 65,747 grows at a rate of 3.7% per year. Create a table showing the value of the quantity Q for the first 5 years or growth or decay.
Unlock Deck
Unlock for access to all 85 flashcards in this deck.
Unlock Deck
k this deck
47
Solve the equation for the unknown quantity x.
Unlock Deck
Unlock for access to all 85 flashcards in this deck.
Unlock Deck
k this deck
48
What is comprised of the values of the independent variable?
A)Domain
B)Periodic function
C)Range
D)Model
A)Domain
B)Periodic function
C)Range
D)Model
Unlock Deck
Unlock for access to all 85 flashcards in this deck.
Unlock Deck
k this deck
49
Provide an appropriate response.
What is the most compact mathematical representation of a function?
A)Graph
B)Data table
C)Equation
D)Domain
What is the most compact mathematical representation of a function?
A)Graph
B)Data table
C)Equation
D)Domain
Unlock Deck
Unlock for access to all 85 flashcards in this deck.
Unlock Deck
k this deck
50
Find the slope of the graph and they y -intercept. Then sketch the graph for values of x between -10 and 10.
Unlock Deck
Unlock for access to all 85 flashcards in this deck.
Unlock Deck
k this deck
51
Create the required linear function an use it to answer the question.
In 1995 the United States recovered 26% of its municipal solid wastes through recycling, up from 17% in 1990. Let P represent the percentage recycled and t the number of years since 1990. Based on
These two data points, create a linear equation for the function that describes how P varies as a
Function of time.
Unlock Deck
Unlock for access to all 85 flashcards in this deck.
Unlock Deck
k this deck
52
A certain drug is eliminated from the bloodstream exponentially with a half-life of 60 hours. Suppose that a patient receives an initial dose of 10 milligrams of the drug at midnight. Estimate
When the drug concentration will reach 20% of its initial level.
A)139 hours
B)199 hours
C)79 hours
D)23 hours
When the drug concentration will reach 20% of its initial level.
A)139 hours
B)199 hours
C)79 hours
D)23 hours
Unlock Deck
Unlock for access to all 85 flashcards in this deck.
Unlock Deck
k this deck
53
True or False? After 60 years, a population growing at a rate of 4% per year will have grown by
twice as many people as a population growing at a rate of 2% per year.
twice as many people as a population growing at a rate of 2% per year.
Unlock Deck
Unlock for access to all 85 flashcards in this deck.
Unlock Deck
k this deck
54
Provide an appropriate response.
Cars sold Crafty Bill's Cool Car Sales opened as a used car sales lot in 2001. The graph shows the number of cars sold as a function of time. What is the approximate number of cars sold in 2003?
A)550 cars
B)400 cars
C)500 cars
D)350 cars
Cars sold
Crafty Bill's Cool Car Sales opened as a used car sales lot in 2001. The graph shows the number of cars sold as a function of time. What is the approximate number of cars sold in 2003?A)550 cars
B)400 cars
C)500 cars
D)350 cars
Unlock Deck
Unlock for access to all 85 flashcards in this deck.
Unlock Deck
k this deck
55
The population of a town with an initial population of 60,196 is decreasing at a rate of 4.2% per year. Create a table showing the value of the quantity Q for the first 5 years or growth or decay.
Unlock Deck
Unlock for access to all 85 flashcards in this deck.
Unlock Deck
k this deck
56
Write an equation for the linear function and use it to answer the given question.
You can purchase a motorcycle for $7101 or lease it for a down payment of $783 and $243 per month. Find an equation that describes how the cost of the lease depends on time. How long can
You lease the motorcycle before you've paid more than its purchase price.
You can purchase a motorcycle for $7101 or lease it for a down payment of $783 and $243 per month. Find an equation that describes how the cost of the lease depends on time. How long can
You lease the motorcycle before you've paid more than its purchase price.
Unlock Deck
Unlock for access to all 85 flashcards in this deck.
Unlock Deck
k this deck
57
Provide an appropriate response.
The population of a town with an initial population of 64,546 is decreasing at a rate of 3.7% per year. Create an exponential function of the form Q
The population of a town with an initial population of 64,546 is decreasing at a rate of 3.7% per year. Create an exponential function of the form Q
Unlock Deck
Unlock for access to all 85 flashcards in this deck.
Unlock Deck
k this deck
58
Provide an appropriate response.
The following graph represents a function. Describe the function in words.
A)The function shows a steadily increasing average age of death between 1980 and 2004.
B)The function shows a steadily decreasing average age of death between 1980 and 2004.
C)The function shows that the average age of death increases between 1980 and 1992 and does not change between 1992 and 2004.
D)The function shows that the average age of death per year does not change between 1980 and 2004.
Unlock Deck
Unlock for access to all 85 flashcards in this deck.
Unlock Deck
k this deck
59
Write an equation for the linear function and use it to answer the given question.
Normaltown High School's pool record for the 100-yard freestyle was 47.8 in 1990. Assume that the record falls at a constant rate of 0.03 second per year. What does the model predict for the
Record in 2010?
Normaltown High School's pool record for the 100-yard freestyle was 47.8 in 1990. Assume that the record falls at a constant rate of 0.03 second per year. What does the model predict for the
Record in 2010?
Unlock Deck
Unlock for access to all 85 flashcards in this deck.
Unlock Deck
k this deck
60
Create the required linear function an use it to answer the question.
Suppose that you were 22 inches long at birth and 3.5 feet tall on your tenth birthday. Based on these two data points, create a linear equation for the function that describes how height varies
With age. Use the equation to predict the height at age 2 and 41.
Suppose that you were 22 inches long at birth and 3.5 feet tall on your tenth birthday. Based on these two data points, create a linear equation for the function that describes how height varies
With age. Use the equation to predict the height at age 2 and 41.
Unlock Deck
Unlock for access to all 85 flashcards in this deck.
Unlock Deck
k this deck
61
Provide an appropriate response.
The population of a town with an initial population of 70,430 grows at a rate of 2.5% per year. Make a graph of the exponential function.
The population of a town with an initial population of 70,430 grows at a rate of 2.5% per year. Make a graph of the exponential function.
Unlock Deck
Unlock for access to all 85 flashcards in this deck.
Unlock Deck
k this deck
62
True or False? A linear function has a varying rate of change and a curved graph.
Unlock Deck
Unlock for access to all 85 flashcards in this deck.
Unlock Deck
k this deck
63
Find the slope of the graph and they y -intercept. Then sketch the graph for values of x between -10 and 10.
Unlock Deck
Unlock for access to all 85 flashcards in this deck.
Unlock Deck
k this deck
64
Write a short statement that expresses a possible function between the given variables.
(grade of hill, speed of scooter)
A)If you are coasting down a hill on a scooter, the narrower the hill, the faster you will coast.
B)If you are coasting down a hill on a scooter, the steeper the hill, the faster you will coast.
C)If you are coasting down a hill on a scooter, the wider the hill, the slower you will coast.
D)If you are coasting down a hill on a scooter, the steeper the hill, the slower you will coast.
Unlock Deck
Unlock for access to all 85 flashcards in this deck.
Unlock Deck
k this deck
65
Unlock Deck
Unlock for access to all 85 flashcards in this deck.
Unlock Deck
k this deck
66
Solve the equation for the unknown quantity x.
Unlock Deck
Unlock for access to all 85 flashcards in this deck.
Unlock Deck
k this deck
67
Find the slope of the graph and they y -intercept. Then sketch the graph for values of x between -10 and 10.
Unlock Deck
Unlock for access to all 85 flashcards in this deck.
Unlock Deck
k this deck
68
Provide an appropriate response.
In the algebraic equation of a line, the y-intercept is denoted by the letter ______.
A)b
B)m
C)y
D)x
In the algebraic equation of a line, the y-intercept is denoted by the letter ______.
A)b
B)m
C)y
D)x
Unlock Deck
Unlock for access to all 85 flashcards in this deck.
Unlock Deck
k this deck
69
The given table represents a function. Make a clear graph of the function.
Unlock Deck
Unlock for access to all 85 flashcards in this deck.
Unlock Deck
k this deck
70
Write an equation for the linear function and use it to answer the given question.
You can rent time on computers at the local copy center for a $7 setup charge and an additional $4 for every 5 minutes. How much time can you rent for $16?
You can rent time on computers at the local copy center for a $7 setup charge and an additional $4 for every 5 minutes. How much time can you rent for $16?
Unlock Deck
Unlock for access to all 85 flashcards in this deck.
Unlock Deck
k this deck
71
Solve the equation for the unknown quantity x.
Unlock Deck
Unlock for access to all 85 flashcards in this deck.
Unlock Deck
k this deck
72
Provide an appropriate response.
A toxic radioactive substance with a density of 3 milligrams per square centimeter is detected in the ventilating ducts of a nuclear processing building that was used 34 years ago. If the half-life of the
Substance is 10 years, what was the density of the substance when it was deposited 34 years ago?
A)3.68 mg/cm2
B)0.28 mg/cm2
C)79.17 mg/cm2
D)31.67 mg/cm2
Unlock Deck
Unlock for access to all 85 flashcards in this deck.
Unlock Deck
k this deck
73
Provide an appropriate response.
What is a mathematical representation of a function that provides detailed information but can become unwieldy?
A)Graph
B)Equation
C)Domain
D)Data table
What is a mathematical representation of a function that provides detailed information but can become unwieldy?
A)Graph
B)Equation
C)Domain
D)Data table
Unlock Deck
Unlock for access to all 85 flashcards in this deck.
Unlock Deck
k this deck
74
Provide an appropriate response.
True or False? The slope is defined as the amount that the graph runs vertically for a given distance that it rises horizontally.
A)False
B)True
True or False? The slope is defined as the amount that the graph runs vertically for a given distance that it rises horizontally.
A)False
B)True
Unlock Deck
Unlock for access to all 85 flashcards in this deck.
Unlock Deck
k this deck
75
Provide an appropriate response.
A computer is purchased for $4600. Its value each year is about 76% of the value the preceding year. Find the value of the computer after 8 years.
A)$389.12
B)$27,968.00
C)$295.73
D)$512.00
A computer is purchased for $4600. Its value each year is about 76% of the value the preceding year. Find the value of the computer after 8 years.
A)$389.12
B)$27,968.00
C)$295.73
D)$512.00
Unlock Deck
Unlock for access to all 85 flashcards in this deck.
Unlock Deck
k this deck
76
(weight of a bag of candy, price of the bag of candy)
A)As the price of the bag of candy increases, the weight of the bag decreases.
B)As the price of the bag of candy decreases, the weight of the bag increases.
C)As the weight of the bag of candy decreases, the price of the bag increases.
D)As the weight of the bag of candy increases, the price of the bag increases.
Unlock Deck
Unlock for access to all 85 flashcards in this deck.
Unlock Deck
k this deck
77
Write a short statement that expresses a possible function between the given variables.(number of cars on road, air quality)
A)As the quality of the air deteriorates, the number of cars on the road decreases.
B)As the quality of the air deteriorates, the number of cars on the road increases.
C)As the number of cars on the road decreases, the quality of the air generally deteriorates.
D)As the number of cars on the road increases, the quality of the air generally deteriorates.
Unlock Deck
Unlock for access to all 85 flashcards in this deck.
Unlock Deck
k this deck
78
Solve the equation for the unknown quantity x.
Unlock Deck
Unlock for access to all 85 flashcards in this deck.
Unlock Deck
k this deck
79
True or False? An exponential function grows (or decays)by the same relative amount per unit time.
A)False
B)True
A)False
B)True
Unlock Deck
Unlock for access to all 85 flashcards in this deck.
Unlock Deck
k this deck
80
Create the required linear function an use it to answer the question.
In 1995 the United States recovered 25% of its municipal wastes through recycling, up from 17% in 1990. Let P represent the percentage recycled and t the number of years since 1990. Based on these
Two data points, create a linear equation for the function that describes how P varies as a function of
Time. Use this function to predict the percentage recycled in 2006.
A)39%
B)44.3%
C)40.7%
D)42.6%
Unlock Deck
Unlock for access to all 85 flashcards in this deck.
Unlock Deck
k this deck
Unlock Deck
Unlock for access to all 85 flashcards in this deck.


