Deck 10: Two-Sample Tests
Full screen (f)
Question
Question
SCENARIO 10-1
Are Japanese managers more motivated than American managers? A randomly selected group of each
were administered the Sarnoff Survey of Attitudes Toward Life (SSATL), which measures motivation
for upward mobility.The SSATL scores are summarized below.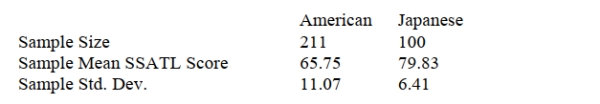
Referring to Scenario 10-1, what is the value of the test statistic?
A) -14.08
B) -11.8092
C) -1.9677
D) 96.4471
Question
SCENARIO 10-2
A researcher randomly sampled 30 graduates of an MBA program and recorded data concerning their
starting salaries.Of primary interest to the researcher was the effect of gender on starting salaries.The
result of the pooled-variance t-test of the mean salaries of the females (Population 1)and males
(Population 2)in the sample is given below.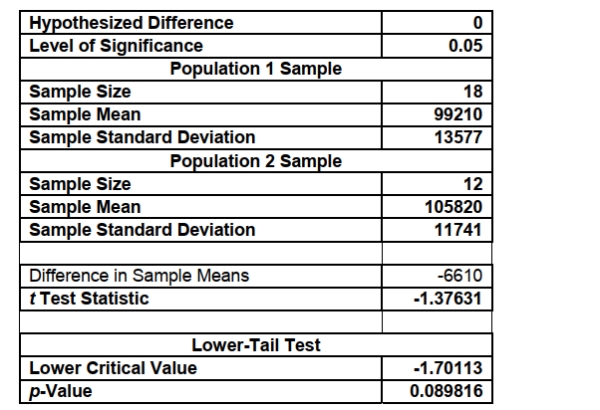
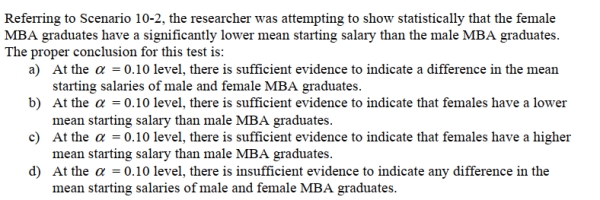
Referring to Scenario 10-2, the researcher was attempting to show statistically that the female
MBA graduates have a significantly lower mean starting salary than the male MBA graduates.
Which of the following is an appropriate alternative hypothesis?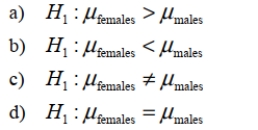
A researcher randomly sampled 30 graduates of an MBA program and recorded data concerning their
starting salaries.Of primary interest to the researcher was the effect of gender on starting salaries.The
result of the pooled-variance t-test of the mean salaries of the females (Population 1)and males
(Population 2)in the sample is given below.
Referring to Scenario 10-2, the researcher was attempting to show statistically that the female
MBA graduates have a significantly lower mean starting salary than the male MBA graduates.
Which of the following is an appropriate alternative hypothesis?
Question
Question
Question
SCENARIO 10-1
Are Japanese managers more motivated than American managers? A randomly selected group of each
were administered the Sarnoff Survey of Attitudes Toward Life (SSATL), which measures motivation
for upward mobility.The SSATL scores are summarized below.
Referring to Scenario 10-1, judging from the way the data were collected, which test would likely
Be most appropriate to employ?
A) Paired t test
B) Pooled-variance t test for the difference between two means
C) F test for the ratio of two variances
D) Z test for the difference between two proportions
Question
Question
SCENARIO 10-1
Are Japanese managers more motivated than American managers? A randomly selected group of each
were administered the Sarnoff Survey of Attitudes Toward Life (SSATL), which measures motivation
for upward mobility.The SSATL scores are summarized below.
Referring to Scenario 10-1, give the null and alternative hypotheses to determine if the mean
SSATL score of Japanese managers differs from the mean SSATL score of American managers.
Question
SCENARIO 10-2
A researcher randomly sampled 30 graduates of an MBA program and recorded data concerning their
starting salaries.Of primary interest to the researcher was the effect of gender on starting salaries.The
result of the pooled-variance t-test of the mean salaries of the females (Population 1)and males
(Population 2)in the sample is given below.
Referring to Scenario 10-2, the researcher was attempting to show statistically that the female
MBA graduates have a significantly lower mean starting salary than the male MBA graduates.From the analysis in Scenario 10-2, the correct test statistic is:
A)-6610
B)-1.3763
C)-1.7011
D)0)0898
Question
Question
SCENARIO 10-2
A researcher randomly sampled 30 graduates of an MBA program and recorded data concerning their
starting salaries.Of primary interest to the researcher was the effect of gender on starting salaries.The
result of the pooled-variance t-test of the mean salaries of the females (Population 1)and males
(Population 2)in the sample is given below.
Question
Question
Question
In testing for differences between the means of two independent populations, the null hypothesis
Is:
Is:
Question
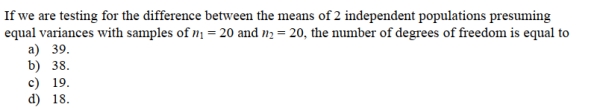
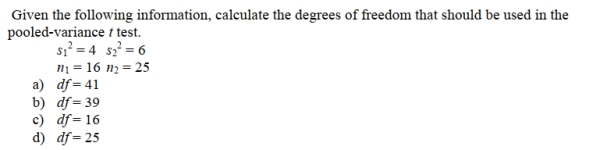
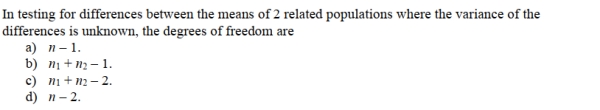
In testing for the differences between the means of 2 independent populations where the variances
In each population are unknown but assumed equal, the degrees of freedom are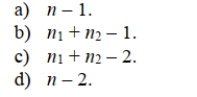
In each population are unknown but assumed equal, the degrees of freedom are
Question
Question
Question
Question
Question
SCENARIO 10-1
Are Japanese managers more motivated than American managers? A randomly selected group of each
were administered the Sarnoff Survey of Attitudes Toward Life (SSATL), which measures motivation
for upward mobility.The SSATL scores are summarized below.
Referring to Scenario 10-1, find the p-value if we assume that the alternative hypothesis was a
Two-tail test.
A) Smaller than 0.01
B) Between 0.01 and 0.05
C) Between 0.05 and 0.10
D) Greater than 0.10
Question
SCENARIO 10-3 
Referring to Scenario 10-3, suppose = 0.10.Which of the following represents the result of the
Relevant hypothesis test?
A) The alternative hypothesis is rejected.
B) The null hypothesis is rejected.
C) The null hypothesis is not rejected.
D) Insufficient information exists on which to make a decision.
Referring to Scenario 10-3, suppose
= 0.10.Which of the following represents the result of theRelevant hypothesis test?
A) The alternative hypothesis is rejected.
B) The null hypothesis is rejected.
C) The null hypothesis is not rejected.
D) Insufficient information exists on which to make a decision.
Question
SCENARIO 10-3
Referring to Scenario 10-3, what is a point estimate for the mean of the sampling distribution of
The difference between the 2 sample means?
A) - 22
B) - 10
C) - 15
D) 0
Referring to Scenario 10-3, what is a point estimate for the mean of the sampling distribution of
The difference between the 2 sample means?
A) - 22
B) - 10
C) - 15
D) 0
Question
SCENARIO 10-3
Referring to Scenario 10-3, suppose α = 0.01.Which of the following represents the result of the
Relevant hypothesis test?
A) The alternative hypothesis is rejected.
B) The null hypothesis is rejected.
C) The null hypothesis is not rejected.
D) Insufficient information exists on which to make a decision.
Question
Question
SCENARIO 10-3
Referring to Scenario 10-3, suppose = 0.05.Which of the following represents the result of the
Relevant hypothesis test?
A) The alternative hypothesis is rejected.
B) The null hypothesis is rejected.
C) The null hypothesis is not rejected.
D) Insufficient information exists on which to make a decision.
Referring to Scenario 10-3, suppose
= 0.05.Which of the following represents the result of theRelevant hypothesis test?
A) The alternative hypothesis is rejected.
B) The null hypothesis is rejected.
C) The null hypothesis is not rejected.
D) Insufficient information exists on which to make a decision.
Question
SCENARIO 10-3
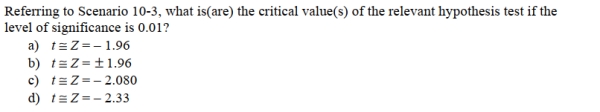
Referring to Scenario 10-3, what is(are)the critical value(s)of the relevant hypothesis test if the
Level of significance is 0.05?
Referring to Scenario 10-3, what is(are)the critical value(s)of the relevant hypothesis test if the
Level of significance is 0.05?
Question
SCENARIO 10-3
Referring to Scenario 10-3, which of the following represents the relevant hypotheses tested by
The real estate company?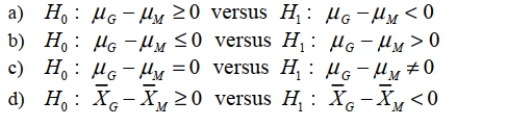
Referring to Scenario 10-3, which of the following represents the relevant hypotheses tested by
The real estate company?
Question
SCENARIO 10-2
A researcher randomly sampled 30 graduates of an MBA program and recorded data concerning their
starting salaries.Of primary interest to the researcher was the effect of gender on starting salaries.The
result of the pooled-variance t-test of the mean salaries of the females (Population 1)and males
(Population 2)in the sample is given below.
Referring to Scenario 10-2, the researcher was attempting to show statistically that the female
MBA graduates have a significantly lower mean starting salary than the male MBA graduates.
What assumptions were necessary to conduct this hypothesis test?
A) Both populations of salaries (male and female) must have approximate normal distributions.
B) The population variances are approximately equal.
C) The samples were randomly and independently selected.
D) All of the above assumptions were necessary.
Question
SCENARIO 10-3
Referring to Scenario 10-3, suppose = 0.10.Which of the following represents the correct
Conclusion?
A) There is not enough evidence that the mean amount of time families in Gotham have been living in their current homes is less than families in Metropolis.
B) There is enough evidence that the mean amount of time families in Gotham have been living in their current homes is less than families in Metropolis.
C) There is not enough evidence that the mean amount of time families in Gotham have been living in their current homes is not less than families in Metropolis.
D) There is enough evidence that the mean amount of time families in Gotham have been living in their current homes is not less than families in Metropolis.
Referring to Scenario 10-3, suppose
= 0.10.Which of the following represents the correctConclusion?
A) There is not enough evidence that the mean amount of time families in Gotham have been living in their current homes is less than families in Metropolis.
B) There is enough evidence that the mean amount of time families in Gotham have been living in their current homes is less than families in Metropolis.
C) There is not enough evidence that the mean amount of time families in Gotham have been living in their current homes is not less than families in Metropolis.
D) There is enough evidence that the mean amount of time families in Gotham have been living in their current homes is not less than families in Metropolis.
Question
SCENARIO 10-3
Referring to Scenario 10-3, what is the test statistic for the difference between sample means?
A) - 8.75
B) - 3.69
C) - 2.33
D) - 1.96
Referring to Scenario 10-3, what is the test statistic for the difference between sample means?
A) - 8.75
B) - 3.69
C) - 2.33
D) - 1.96
Question
SCENARIO 10-3
Referring to Scenario 10-3, suppose = 0.05.Which of the following represents the correct
Conclusion?
A) There is not enough evidence that the mean amount of time families in Gotham have been living in their current homes is less than families in Metropolis.
B) There is enough evidence that the mean amount of time families in Gotham have been living in their current homes is less than families in Metropolis.
C) There is not enough evidence that the mean amount of time families in Gotham have been living in their current homes is not less than families in Metropolis.
D) There is enough evidence that the mean amount of time families in Gotham have been living in their current homes is not less than families in Metropolis.
Referring to Scenario 10-3, suppose
= 0.05.Which of the following represents the correctConclusion?
A) There is not enough evidence that the mean amount of time families in Gotham have been living in their current homes is less than families in Metropolis.
B) There is enough evidence that the mean amount of time families in Gotham have been living in their current homes is less than families in Metropolis.
C) There is not enough evidence that the mean amount of time families in Gotham have been living in their current homes is not less than families in Metropolis.
D) There is enough evidence that the mean amount of time families in Gotham have been living in their current homes is not less than families in Metropolis.
Question
SCENARIO 10-3
Question
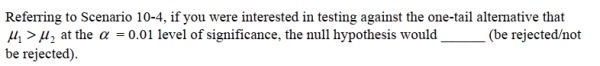
SCENARIO 10-4
Two samples each of size 25 are taken from independent populations assumed to be normally
distributed with equal variances.The first sample has a mean of 35.5 and standard deviation of 3.0
while the second sample has a mean of 33.0 and standard deviation of 4.0.
Referring to Scenario 10-4, the critical values for a two-tail test of the null hypothesis of no
difference in the population means at the
= 0.05 level of significance are _______.
Question
SCENARIO 10-2
A researcher randomly sampled 30 graduates of an MBA program and recorded data concerning their
starting salaries.Of primary interest to the researcher was the effect of gender on starting salaries.The
result of the pooled-variance t-test of the mean salaries of the females (Population 1)and males
(Population 2)in the sample is given below.
Referring to Scenario 10-2, what is the 90% confidence interval estimate for the difference
between two means?
Question
SCENARIO 10-3
Referring to Scenario 10-3, what is the 95% confidence interval estimate for the difference in the
two means?
Referring to Scenario 10-3, what is the 95% confidence interval estimate for the difference in the
two means?
Question
SCENARIO 10-3
Referring to Scenario 10-3, what is the estimated standard error of the difference between the 2
Sample means?
A) 4.06
B) 5.61
C) 8.01
D) 16.00
Referring to Scenario 10-3, what is the estimated standard error of the difference between the 2
Sample means?
A) 4.06
B) 5.61
C) 8.01
D) 16.00
Question
SCENARIO 10-2
A researcher randomly sampled 30 graduates of an MBA program and recorded data concerning their
starting salaries.Of primary interest to the researcher was the effect of gender on starting salaries.The
result of the pooled-variance t-test of the mean salaries of the females (Population 1)and males
(Population 2)in the sample is given below.
Referring to Scenario 10-2, what is the 95% confidence interval estimate for the difference
between two means?
Question
SCENARIO 10-3
Referring to Scenario 10-3, suppose = 0.01.Which of the following represents the correct
Conclusion?
A) There is not enough evidence that the mean amount of time families in Gotham have been living in their current homes is less than families in Metropolis.
B) There is enough evidence that the mean amount of time families in Gotham have been living in their current homes is less than families in Metropolis.
C) There is not enough evidence that the mean amount of time families in Gotham have been living in their current homes is not less than families in Metropolis.
D) There is enough evidence that the mean amount of time families in Gotham have been living in their current homes is not less than families in Metropolis.
Referring to Scenario 10-3, suppose
= 0.01.Which of the following represents the correctConclusion?
A) There is not enough evidence that the mean amount of time families in Gotham have been living in their current homes is less than families in Metropolis.
B) There is enough evidence that the mean amount of time families in Gotham have been living in their current homes is less than families in Metropolis.
C) There is not enough evidence that the mean amount of time families in Gotham have been living in their current homes is not less than families in Metropolis.
D) There is enough evidence that the mean amount of time families in Gotham have been living in their current homes is not less than families in Metropolis.
Question
SCENARIO 10-2
A researcher randomly sampled 30 graduates of an MBA program and recorded data concerning their
starting salaries.Of primary interest to the researcher was the effect of gender on starting salaries.The
result of the pooled-variance t-test of the mean salaries of the females (Population 1)and males
(Population 2)in the sample is given below.
Referring to Scenario 10-2, what is the 99% confidence interval estimate for the difference
between two means?
Question
SCENARIO 10-3
Referring to Scenario 10-3, what is the 99% confidence interval estimate for the difference in the
two means?
Referring to Scenario 10-3, what is the 99% confidence interval estimate for the difference in the
two means?
Question
SCENARIO 10-5 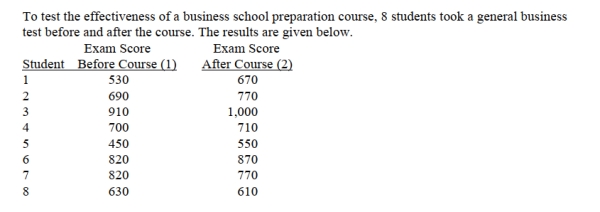
10-16 Two-Sample Tests
Referring to Scenario 10-5, the number of degrees of freedom is
A) 14.
B) 13.
C) 8.
D) 7.
10-16 Two-Sample Tests
Referring to Scenario 10-5, the number of degrees of freedom is
A) 14.
B) 13.
C) 8.
D) 7.
Question
Question
Question
Question
SCENARIO 10-4
Two samples each of size 25 are taken from independent populations assumed to be normally
distributed with equal variances.The first sample has a mean of 35.5 and standard deviation of 3.0
while the second sample has a mean of 33.0 and standard deviation of 4.0.
Referring to Scenario 10-4, a two-tail test of the null hypothesis of no difference would _______
(be rejected/not be rejected)at the
= 0.05 level of significance.
Question
SCENARIO 10-5
10-16 Two-Sample Tests
Referring to Scenario 10-5, at the 0.05 level of significance, the conclusion for this hypothesis
Test is that there is sufficient evidence that:
A) the business school preparation course does improve exam score.
B) the business school preparation course does not improve exam score.
C) the business school preparation course has no impact on exam score.
D) no conclusion can be drawn from the information given.
Question
SCENARIO 10-5
10-16 Two-Sample Tests
Referring to Scenario 10-5, the value of the sample mean difference is _______ if the difference
Scores reflect the results of the exam after the course minus the results of the exam before the
Course.
A) 0
B) 50
C) 68
D) 400
10-16 Two-Sample Tests
Referring to Scenario 10-5, the value of the sample mean difference is _______ if the difference
Scores reflect the results of the exam after the course minus the results of the exam before the
Course.
A) 0
B) 50
C) 68
D) 400
Question
SCENARIO 10-5
10-16 Two-Sample Tests
True or False: Referring to Scenario 10-5, you must assume that the population of difference
scores is normally distributed.
10-16 Two-Sample Tests
True or False: Referring to Scenario 10-5, you must assume that the population of difference
scores is normally distributed.
Question
Question
Question
Question
SCENARIO 10-5
10-16 Two-Sample Tests
Referring to Scenario 10-5, the value of the standard error of the difference scores is
A) 65.027
B) 60.828
C) 22.991
D) 14.696
10-16 Two-Sample Tests
Referring to Scenario 10-5, the value of the standard error of the difference scores is
A) 65.027
B) 60.828
C) 22.991
D) 14.696
Question
SCENARIO 10-5
10-16 Two-Sample Tests
Referring to Scenario 10-5, what is the critical value for testing at the 5% level of significance
Whether the business school preparation course is effective in improving exam scores?
A) 2.365
B) 2.145
C) 1.761
D) 1.895
10-16 Two-Sample Tests
Referring to Scenario 10-5, what is the critical value for testing at the 5% level of significance
Whether the business school preparation course is effective in improving exam scores?
A) 2.365
B) 2.145
C) 1.761
D) 1.895
Question
Question
Question
SCENARIO 10-5
10-16 Two-Sample Tests
Referring to Scenario 10-5, at the 0.05 level of significance, the decision for this hypothesis test
Would be:
A) reject the null hypothesis.
B) do not reject the null hypothesis.
C) reject the alternative hypothesis.
D) It cannot be determined from the information given.
10-16 Two-Sample Tests
Referring to Scenario 10-5, at the 0.05 level of significance, the decision for this hypothesis test
Would be:
A) reject the null hypothesis.
B) do not reject the null hypothesis.
C) reject the alternative hypothesis.
D) It cannot be determined from the information given.
Question
Question
Question
SCENARIO 10-4
Two samples each of size 25 are taken from independent populations assumed to be normally
distributed with equal variances.The first sample has a mean of 35.5 and standard deviation of 3.0
while the second sample has a mean of 33.0 and standard deviation of 4.0.
Two samples each of size 25 are taken from independent populations assumed to be normally
distributed with equal variances.The first sample has a mean of 35.5 and standard deviation of 3.0
while the second sample has a mean of 33.0 and standard deviation of 4.0.
Question
Question
A powerful women's group has claimed that men and women differ in attitudes about sexual
Discrimination.A group of 50 men (group 1)and 40 women (group 2)were asked if they thought
Sexual discrimination is a problem in the United States.Of those sampled, 11 of the men and 19
Of the women did believe that sexual discrimination is a problem.Assuming W designates
Women's responses and M designates men's, which of the following are the appropriate null and
Alternative hypotheses to test the group's claim?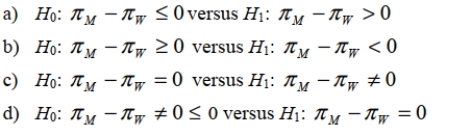
Question
Question
SCENARIO 10-7 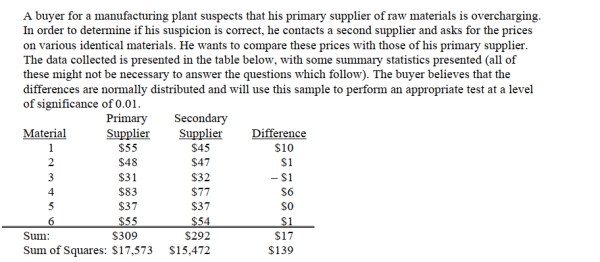
Referring to Scenario 10-7, what is the 99% confidence interval estimate for the mean difference
in prices?
Referring to Scenario 10-7, what is the 99% confidence interval estimate for the mean difference
in prices?
Question
Question
Question
SCENARIO 10-6
To investigate the efficacy of a diet, a random sample of 16 male patients is selected from a
population of adult males using the diet.The weight of each individual in the sample is taken at the
start of the diet and at a medical follow-up 4 weeks later.Assuming that the population of differences
in weight before versus after the diet follow a normal distribution, the t-test for related samples can be
used to determine if there was a significant decrease in the mean weight during this period.Suppose
the mean decrease in weights over all 16 subjects in the study is 3.0 pounds with the standard
deviation of differences computed as 6.0 pounds.
Question
SCENARIO 10-7
Referring to Scenario 10-7, what is the 90% confidence interval estimate for the mean difference
in prices?
Referring to Scenario 10-7, what is the 90% confidence interval estimate for the mean difference
in prices?
Question
Question
Question
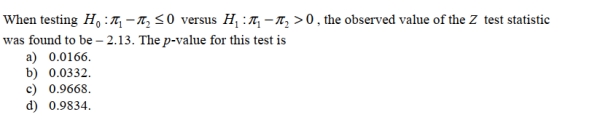
SCENARIO 10-7
Referring to Scenario 10-7, the decision rule is to reject the null hypothesis if ________.
Referring to Scenario 10-7, the decision rule is to reject the null hypothesis if ________.
Question
Question
Question
SCENARIO 10-7
True or False: Referring to Scenario 10-7, the null hypothesis should be rejected.
True or False: Referring to Scenario 10-7, the null hypothesis should be rejected.
Question
Moving companies are required by the government to publish a Carrier Performance Report each
Year.One of the descriptive statistics they must include is the annual percentage of shipments on
Which a $50 or greater claim for loss or damage was filed.Suppose two companies, Econo-Move
And On-the-Move, each decide to estimate this figure by sampling their records, and they report
The data shown in the following table.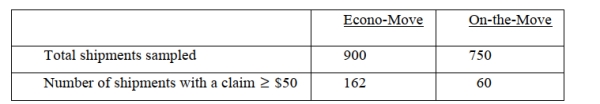
The owner of On-the-Move is hoping to use these data to show that the company is superior to
Econo-Move with regard to the percentage of claims filed.Which test would be used to properly
Analyze the data in this experiment?
A)t test for the difference between two means
B)F test for the ratio of variances
C)Separate variance t test for the difference between two means
D)Z test for the difference between two proportions
Question
Question
SCENARIO 10-7
Referring to Scenario 10-7, what is the 95% confidence interval estimate for the mean difference
in prices?
Referring to Scenario 10-7, what is the 95% confidence interval estimate for the mean difference
in prices?
Question
Question
SCENARIO 10-7
Referring to Scenario 10-7, the test to perform is a
A) pooled-variance t test for differences between two means.
B) separate-variance t test for differences between two means.
C) Z test for the difference between two proportions.
D) paired t-test for the mean difference.
Referring to Scenario 10-7, the test to perform is a
A) pooled-variance t test for differences between two means.
B) separate-variance t test for differences between two means.
C) Z test for the difference between two proportions.
D) paired t-test for the mean difference.
Question
SCENARIO 10-7
Referring to Scenario 10-7, the hypotheses that the buyer should test are a null hypothesis that
________ versus an alternative hypothesis that ________.
Referring to Scenario 10-7, the hypotheses that the buyer should test are a null hypothesis that
________ versus an alternative hypothesis that ________.
Question

Unlock Deck
Sign up to unlock the cards in this deck!
Unlock Deck
Unlock Deck
1/95
Play
Full screen (f)
Deck 10: Two-Sample Tests
1
B
2
SCENARIO 10-1
Are Japanese managers more motivated than American managers? A randomly selected group of each
were administered the Sarnoff Survey of Attitudes Toward Life (SSATL), which measures motivation
for upward mobility.The SSATL scores are summarized below.
Referring to Scenario 10-1, what is the value of the test statistic?
A) -14.08
B) -11.8092
C) -1.9677
D) 96.4471
B
3
SCENARIO 10-2
A researcher randomly sampled 30 graduates of an MBA program and recorded data concerning their
starting salaries.Of primary interest to the researcher was the effect of gender on starting salaries.The
result of the pooled-variance t-test of the mean salaries of the females (Population 1)and males
(Population 2)in the sample is given below.
Referring to Scenario 10-2, the researcher was attempting to show statistically that the female
MBA graduates have a significantly lower mean starting salary than the male MBA graduates.
Which of the following is an appropriate alternative hypothesis?
B
4
True or False: A statistics professor wanted to test whether the grades on a statistics test were the
same for upper and lower classmen.The professor took a random sample of size 10 from each,
conducted a test and found out that the variances were equal.For this situation, the professor
should use a t test with related samples.
same for upper and lower classmen.The professor took a random sample of size 10 from each,
conducted a test and found out that the variances were equal.For this situation, the professor
should use a t test with related samples.
Unlock Deck
Unlock for access to all 95 flashcards in this deck.
Unlock Deck
k this deck
5
True or False: A statistics professor wanted to test whether the grades on a statistics test were the
same for upper and lower classmen.The professor took a random sample of size 10 from each,
conducted a test and found out that the variances were equal.For this situation, the professor
should use a t test with independent samples.
same for upper and lower classmen.The professor took a random sample of size 10 from each,
conducted a test and found out that the variances were equal.For this situation, the professor
should use a t test with independent samples.
Unlock Deck
Unlock for access to all 95 flashcards in this deck.
Unlock Deck
k this deck
6
SCENARIO 10-1
Are Japanese managers more motivated than American managers? A randomly selected group of each
were administered the Sarnoff Survey of Attitudes Toward Life (SSATL), which measures motivation
for upward mobility.The SSATL scores are summarized below.
Referring to Scenario 10-1, judging from the way the data were collected, which test would likely
Be most appropriate to employ?
A) Paired t test
B) Pooled-variance t test for the difference between two means
C) F test for the ratio of two variances
D) Z test for the difference between two proportions
Unlock Deck
Unlock for access to all 95 flashcards in this deck.
Unlock Deck
k this deck
7
True or False: When you test for differences between the means of two independent populations,
you can only use a two-tail test.
you can only use a two-tail test.
Unlock Deck
Unlock for access to all 95 flashcards in this deck.
Unlock Deck
k this deck
8
SCENARIO 10-1
Are Japanese managers more motivated than American managers? A randomly selected group of each
were administered the Sarnoff Survey of Attitudes Toward Life (SSATL), which measures motivation
for upward mobility.The SSATL scores are summarized below.
Referring to Scenario 10-1, give the null and alternative hypotheses to determine if the mean
SSATL score of Japanese managers differs from the mean SSATL score of American managers.
Unlock Deck
Unlock for access to all 95 flashcards in this deck.
Unlock Deck
k this deck
9
SCENARIO 10-2
A researcher randomly sampled 30 graduates of an MBA program and recorded data concerning their
starting salaries.Of primary interest to the researcher was the effect of gender on starting salaries.The
result of the pooled-variance t-test of the mean salaries of the females (Population 1)and males
(Population 2)in the sample is given below.
Referring to Scenario 10-2, the researcher was attempting to show statistically that the female
MBA graduates have a significantly lower mean starting salary than the male MBA graduates.From the analysis in Scenario 10-2, the correct test statistic is:
A)-6610
B)-1.3763
C)-1.7011
D)0)0898
Unlock Deck
Unlock for access to all 95 flashcards in this deck.
Unlock Deck
k this deck
10
True or False: The sample size in each independent sample must be the same if we are to test for
differences between the means of two independent populations.
differences between the means of two independent populations.
Unlock Deck
Unlock for access to all 95 flashcards in this deck.
Unlock Deck
k this deck
11
SCENARIO 10-2
A researcher randomly sampled 30 graduates of an MBA program and recorded data concerning their
starting salaries.Of primary interest to the researcher was the effect of gender on starting salaries.The
result of the pooled-variance t-test of the mean salaries of the females (Population 1)and males
(Population 2)in the sample is given below.
Unlock Deck
Unlock for access to all 95 flashcards in this deck.
Unlock Deck
k this deck
12
Unlock Deck
Unlock for access to all 95 flashcards in this deck.
Unlock Deck
k this deck
13
True or False: When the sample sizes are equal, the pooled variance of the two groups is the
average of the 2 sample variances.
average of the 2 sample variances.
Unlock Deck
Unlock for access to all 95 flashcards in this deck.
Unlock Deck
k this deck
14
In testing for differences between the means of two independent populations, the null hypothesis
Is:
Is:
Unlock Deck
Unlock for access to all 95 flashcards in this deck.
Unlock Deck
k this deck
15
In testing for the differences between the means of 2 independent populations where the variances
In each population are unknown but assumed equal, the degrees of freedom are
In each population are unknown but assumed equal, the degrees of freedom are
Unlock Deck
Unlock for access to all 95 flashcards in this deck.
Unlock Deck
k this deck
16
Unlock Deck
Unlock for access to all 95 flashcards in this deck.
Unlock Deck
k this deck
17
In testing for the differences between the means of two independent populations, you assume that
the 2 populations each follow a _______ distribution.
the 2 populations each follow a _______ distribution.
Unlock Deck
Unlock for access to all 95 flashcards in this deck.
Unlock Deck
k this deck
18
True or False: For all two-sample tests, the sample sizes must be equal in the two groups.
Unlock Deck
Unlock for access to all 95 flashcards in this deck.
Unlock Deck
k this deck
19
The t test for the difference between the means of 2 independent populations assumes that the
Respective
A) sample sizes are equal.
B) sample variances are equal.
C) populations are approximately normal.
D) All of the above.
Respective
A) sample sizes are equal.
B) sample variances are equal.
C) populations are approximately normal.
D) All of the above.
Unlock Deck
Unlock for access to all 95 flashcards in this deck.
Unlock Deck
k this deck
20
SCENARIO 10-1
Are Japanese managers more motivated than American managers? A randomly selected group of each
were administered the Sarnoff Survey of Attitudes Toward Life (SSATL), which measures motivation
for upward mobility.The SSATL scores are summarized below.
Referring to Scenario 10-1, find the p-value if we assume that the alternative hypothesis was a
Two-tail test.
A) Smaller than 0.01
B) Between 0.01 and 0.05
C) Between 0.05 and 0.10
D) Greater than 0.10
Unlock Deck
Unlock for access to all 95 flashcards in this deck.
Unlock Deck
k this deck
21
SCENARIO 10-3
Referring to Scenario 10-3, suppose = 0.10.Which of the following represents the result of the
Relevant hypothesis test?
A) The alternative hypothesis is rejected.
B) The null hypothesis is rejected.
C) The null hypothesis is not rejected.
D) Insufficient information exists on which to make a decision.
Referring to Scenario 10-3, suppose
= 0.10.Which of the following represents the result of theRelevant hypothesis test?
A) The alternative hypothesis is rejected.
B) The null hypothesis is rejected.
C) The null hypothesis is not rejected.
D) Insufficient information exists on which to make a decision.
Unlock Deck
Unlock for access to all 95 flashcards in this deck.
Unlock Deck
k this deck
22
SCENARIO 10-3
Referring to Scenario 10-3, what is a point estimate for the mean of the sampling distribution of
The difference between the 2 sample means?
A) - 22
B) - 10
C) - 15
D) 0
Referring to Scenario 10-3, what is a point estimate for the mean of the sampling distribution of
The difference between the 2 sample means?
A) - 22
B) - 10
C) - 15
D) 0
Unlock Deck
Unlock for access to all 95 flashcards in this deck.
Unlock Deck
k this deck
23
SCENARIO 10-3
Referring to Scenario 10-3, suppose α = 0.01.Which of the following represents the result of the
Relevant hypothesis test?
A) The alternative hypothesis is rejected.
B) The null hypothesis is rejected.
C) The null hypothesis is not rejected.
D) Insufficient information exists on which to make a decision.
Unlock Deck
Unlock for access to all 95 flashcards in this deck.
Unlock Deck
k this deck
24
SCENARIO 10-4
Two samples each of size 25 are taken from independent populations assumed to be normally
distributed with equal variances.The first sample has a mean of 35.5 and standard deviation of 3.0
while the second sample has a mean of 33.0 and standard deviation of 4.0.
Referring to Scenario 10-4, there are _______ degrees of freedom for this test.
Unlock Deck
Unlock for access to all 95 flashcards in this deck.
Unlock Deck
k this deck
25
SCENARIO 10-3
Referring to Scenario 10-3, suppose = 0.05.Which of the following represents the result of the
Relevant hypothesis test?
A) The alternative hypothesis is rejected.
B) The null hypothesis is rejected.
C) The null hypothesis is not rejected.
D) Insufficient information exists on which to make a decision.
Referring to Scenario 10-3, suppose
= 0.05.Which of the following represents the result of theRelevant hypothesis test?
A) The alternative hypothesis is rejected.
B) The null hypothesis is rejected.
C) The null hypothesis is not rejected.
D) Insufficient information exists on which to make a decision.
Unlock Deck
Unlock for access to all 95 flashcards in this deck.
Unlock Deck
k this deck
26
SCENARIO 10-3
Referring to Scenario 10-3, what is(are)the critical value(s)of the relevant hypothesis test if the
Level of significance is 0.05?
Referring to Scenario 10-3, what is(are)the critical value(s)of the relevant hypothesis test if the
Level of significance is 0.05?
Unlock Deck
Unlock for access to all 95 flashcards in this deck.
Unlock Deck
k this deck
27
SCENARIO 10-3
Referring to Scenario 10-3, which of the following represents the relevant hypotheses tested by
The real estate company?
Referring to Scenario 10-3, which of the following represents the relevant hypotheses tested by
The real estate company?
Unlock Deck
Unlock for access to all 95 flashcards in this deck.
Unlock Deck
k this deck
28
SCENARIO 10-2
A researcher randomly sampled 30 graduates of an MBA program and recorded data concerning their
starting salaries.Of primary interest to the researcher was the effect of gender on starting salaries.The
result of the pooled-variance t-test of the mean salaries of the females (Population 1)and males
(Population 2)in the sample is given below.
Referring to Scenario 10-2, the researcher was attempting to show statistically that the female
MBA graduates have a significantly lower mean starting salary than the male MBA graduates.
What assumptions were necessary to conduct this hypothesis test?
A) Both populations of salaries (male and female) must have approximate normal distributions.
B) The population variances are approximately equal.
C) The samples were randomly and independently selected.
D) All of the above assumptions were necessary.
Unlock Deck
Unlock for access to all 95 flashcards in this deck.
Unlock Deck
k this deck
29
SCENARIO 10-3
Referring to Scenario 10-3, suppose = 0.10.Which of the following represents the correct
Conclusion?
A) There is not enough evidence that the mean amount of time families in Gotham have been living in their current homes is less than families in Metropolis.
B) There is enough evidence that the mean amount of time families in Gotham have been living in their current homes is less than families in Metropolis.
C) There is not enough evidence that the mean amount of time families in Gotham have been living in their current homes is not less than families in Metropolis.
D) There is enough evidence that the mean amount of time families in Gotham have been living in their current homes is not less than families in Metropolis.
Referring to Scenario 10-3, suppose
= 0.10.Which of the following represents the correctConclusion?
A) There is not enough evidence that the mean amount of time families in Gotham have been living in their current homes is less than families in Metropolis.
B) There is enough evidence that the mean amount of time families in Gotham have been living in their current homes is less than families in Metropolis.
C) There is not enough evidence that the mean amount of time families in Gotham have been living in their current homes is not less than families in Metropolis.
D) There is enough evidence that the mean amount of time families in Gotham have been living in their current homes is not less than families in Metropolis.
Unlock Deck
Unlock for access to all 95 flashcards in this deck.
Unlock Deck
k this deck
30
SCENARIO 10-3
Referring to Scenario 10-3, what is the test statistic for the difference between sample means?
A) - 8.75
B) - 3.69
C) - 2.33
D) - 1.96
Referring to Scenario 10-3, what is the test statistic for the difference between sample means?
A) - 8.75
B) - 3.69
C) - 2.33
D) - 1.96
Unlock Deck
Unlock for access to all 95 flashcards in this deck.
Unlock Deck
k this deck
31
SCENARIO 10-3
Referring to Scenario 10-3, suppose = 0.05.Which of the following represents the correct
Conclusion?
A) There is not enough evidence that the mean amount of time families in Gotham have been living in their current homes is less than families in Metropolis.
B) There is enough evidence that the mean amount of time families in Gotham have been living in their current homes is less than families in Metropolis.
C) There is not enough evidence that the mean amount of time families in Gotham have been living in their current homes is not less than families in Metropolis.
D) There is enough evidence that the mean amount of time families in Gotham have been living in their current homes is not less than families in Metropolis.
Referring to Scenario 10-3, suppose
= 0.05.Which of the following represents the correctConclusion?
A) There is not enough evidence that the mean amount of time families in Gotham have been living in their current homes is less than families in Metropolis.
B) There is enough evidence that the mean amount of time families in Gotham have been living in their current homes is less than families in Metropolis.
C) There is not enough evidence that the mean amount of time families in Gotham have been living in their current homes is not less than families in Metropolis.
D) There is enough evidence that the mean amount of time families in Gotham have been living in their current homes is not less than families in Metropolis.
Unlock Deck
Unlock for access to all 95 flashcards in this deck.
Unlock Deck
k this deck
32
SCENARIO 10-3
Unlock Deck
Unlock for access to all 95 flashcards in this deck.
Unlock Deck
k this deck
33
SCENARIO 10-4
Two samples each of size 25 are taken from independent populations assumed to be normally
distributed with equal variances.The first sample has a mean of 35.5 and standard deviation of 3.0
while the second sample has a mean of 33.0 and standard deviation of 4.0.
Referring to Scenario 10-4, the critical values for a two-tail test of the null hypothesis of no
difference in the population means at the
= 0.05 level of significance are _______.
Unlock Deck
Unlock for access to all 95 flashcards in this deck.
Unlock Deck
k this deck
34
SCENARIO 10-2
A researcher randomly sampled 30 graduates of an MBA program and recorded data concerning their
starting salaries.Of primary interest to the researcher was the effect of gender on starting salaries.The
result of the pooled-variance t-test of the mean salaries of the females (Population 1)and males
(Population 2)in the sample is given below.
Referring to Scenario 10-2, what is the 90% confidence interval estimate for the difference
between two means?
Unlock Deck
Unlock for access to all 95 flashcards in this deck.
Unlock Deck
k this deck
35
SCENARIO 10-3
Referring to Scenario 10-3, what is the 95% confidence interval estimate for the difference in the
two means?
Referring to Scenario 10-3, what is the 95% confidence interval estimate for the difference in the
two means?
Unlock Deck
Unlock for access to all 95 flashcards in this deck.
Unlock Deck
k this deck
36
SCENARIO 10-3
Referring to Scenario 10-3, what is the estimated standard error of the difference between the 2
Sample means?
A) 4.06
B) 5.61
C) 8.01
D) 16.00
Referring to Scenario 10-3, what is the estimated standard error of the difference between the 2
Sample means?
A) 4.06
B) 5.61
C) 8.01
D) 16.00
Unlock Deck
Unlock for access to all 95 flashcards in this deck.
Unlock Deck
k this deck
37
SCENARIO 10-2
A researcher randomly sampled 30 graduates of an MBA program and recorded data concerning their
starting salaries.Of primary interest to the researcher was the effect of gender on starting salaries.The
result of the pooled-variance t-test of the mean salaries of the females (Population 1)and males
(Population 2)in the sample is given below.
Referring to Scenario 10-2, what is the 95% confidence interval estimate for the difference
between two means?
Unlock Deck
Unlock for access to all 95 flashcards in this deck.
Unlock Deck
k this deck
38
SCENARIO 10-3
Referring to Scenario 10-3, suppose = 0.01.Which of the following represents the correct
Conclusion?
A) There is not enough evidence that the mean amount of time families in Gotham have been living in their current homes is less than families in Metropolis.
B) There is enough evidence that the mean amount of time families in Gotham have been living in their current homes is less than families in Metropolis.
C) There is not enough evidence that the mean amount of time families in Gotham have been living in their current homes is not less than families in Metropolis.
D) There is enough evidence that the mean amount of time families in Gotham have been living in their current homes is not less than families in Metropolis.
Referring to Scenario 10-3, suppose
= 0.01.Which of the following represents the correctConclusion?
A) There is not enough evidence that the mean amount of time families in Gotham have been living in their current homes is less than families in Metropolis.
B) There is enough evidence that the mean amount of time families in Gotham have been living in their current homes is less than families in Metropolis.
C) There is not enough evidence that the mean amount of time families in Gotham have been living in their current homes is not less than families in Metropolis.
D) There is enough evidence that the mean amount of time families in Gotham have been living in their current homes is not less than families in Metropolis.
Unlock Deck
Unlock for access to all 95 flashcards in this deck.
Unlock Deck
k this deck
39
SCENARIO 10-2
A researcher randomly sampled 30 graduates of an MBA program and recorded data concerning their
starting salaries.Of primary interest to the researcher was the effect of gender on starting salaries.The
result of the pooled-variance t-test of the mean salaries of the females (Population 1)and males
(Population 2)in the sample is given below.
Referring to Scenario 10-2, what is the 99% confidence interval estimate for the difference
between two means?
Unlock Deck
Unlock for access to all 95 flashcards in this deck.
Unlock Deck
k this deck
40
SCENARIO 10-3
Referring to Scenario 10-3, what is the 99% confidence interval estimate for the difference in the
two means?
Referring to Scenario 10-3, what is the 99% confidence interval estimate for the difference in the
two means?
Unlock Deck
Unlock for access to all 95 flashcards in this deck.
Unlock Deck
k this deck
41
SCENARIO 10-5
10-16 Two-Sample Tests
Referring to Scenario 10-5, the number of degrees of freedom is
A) 14.
B) 13.
C) 8.
D) 7.
10-16 Two-Sample Tests
Referring to Scenario 10-5, the number of degrees of freedom is
A) 14.
B) 13.
C) 8.
D) 7.
Unlock Deck
Unlock for access to all 95 flashcards in this deck.
Unlock Deck
k this deck
42
Unlock Deck
Unlock for access to all 95 flashcards in this deck.
Unlock Deck
k this deck
43
SCENARIO 10-4
Two samples each of size 25 are taken from independent populations assumed to be normally
distributed with equal variances.The first sample has a mean of 35.5 and standard deviation of 3.0
while the second sample has a mean of 33.0 and standard deviation of 4.0.
Referring to Scenario 10-4, what is the 99% confidence interval estimate for the difference in the
two means?
Unlock Deck
Unlock for access to all 95 flashcards in this deck.
Unlock Deck
k this deck
44
True or False: When testing for differences between the means of 2 related populations, you can
use either a one-tail or two-tail test.
use either a one-tail or two-tail test.
Unlock Deck
Unlock for access to all 95 flashcards in this deck.
Unlock Deck
k this deck
45
SCENARIO 10-4
Two samples each of size 25 are taken from independent populations assumed to be normally
distributed with equal variances.The first sample has a mean of 35.5 and standard deviation of 3.0
while the second sample has a mean of 33.0 and standard deviation of 4.0.
Referring to Scenario 10-4, a two-tail test of the null hypothesis of no difference would _______
(be rejected/not be rejected)at the
= 0.05 level of significance.
Unlock Deck
Unlock for access to all 95 flashcards in this deck.
Unlock Deck
k this deck
46
SCENARIO 10-5
10-16 Two-Sample Tests
Referring to Scenario 10-5, at the 0.05 level of significance, the conclusion for this hypothesis
Test is that there is sufficient evidence that:
A) the business school preparation course does improve exam score.
B) the business school preparation course does not improve exam score.
C) the business school preparation course has no impact on exam score.
D) no conclusion can be drawn from the information given.
Unlock Deck
Unlock for access to all 95 flashcards in this deck.
Unlock Deck
k this deck
47
SCENARIO 10-5
10-16 Two-Sample Tests
Referring to Scenario 10-5, the value of the sample mean difference is _______ if the difference
Scores reflect the results of the exam after the course minus the results of the exam before the
Course.
A) 0
B) 50
C) 68
D) 400
10-16 Two-Sample Tests
Referring to Scenario 10-5, the value of the sample mean difference is _______ if the difference
Scores reflect the results of the exam after the course minus the results of the exam before the
Course.
A) 0
B) 50
C) 68
D) 400
Unlock Deck
Unlock for access to all 95 flashcards in this deck.
Unlock Deck
k this deck
48
SCENARIO 10-5
10-16 Two-Sample Tests
True or False: Referring to Scenario 10-5, you must assume that the population of difference
scores is normally distributed.
10-16 Two-Sample Tests
True or False: Referring to Scenario 10-5, you must assume that the population of difference
scores is normally distributed.
Unlock Deck
Unlock for access to all 95 flashcards in this deck.
Unlock Deck
k this deck
49
SCENARIO 10-6
To investigate the efficacy of a diet, a random sample of 16 male patients is selected from a
population of adult males using the diet.The weight of each individual in the sample is taken at the
start of the diet and at a medical follow-up 4 weeks later.Assuming that the population of differences
in weight before versus after the diet follow a normal distribution, the t-test for related samples can be
used to determine if there was a significant decrease in the mean weight during this period.Suppose
the mean decrease in weights over all 16 subjects in the study is 3.0 pounds with the standard
deviation of differences computed as 6.0 pounds.
Referring to Scenario 10-6, the t test should be _______-tail.
Unlock Deck
Unlock for access to all 95 flashcards in this deck.
Unlock Deck
k this deck
50
True or False: Repeated measurements from the same individuals is an example of data collected
from two related populations.
from two related populations.
Unlock Deck
Unlock for access to all 95 flashcards in this deck.
Unlock Deck
k this deck
51
True or False: A Marine drill instructor recorded the time in which each of 11 recruits completed
an obstacle course both before and after basic training.To test whether any improvement
occurred, the instructor would use a t-distribution with 10 degrees of freedom.
an obstacle course both before and after basic training.To test whether any improvement
occurred, the instructor would use a t-distribution with 10 degrees of freedom.
Unlock Deck
Unlock for access to all 95 flashcards in this deck.
Unlock Deck
k this deck
52
SCENARIO 10-5
10-16 Two-Sample Tests
Referring to Scenario 10-5, the value of the standard error of the difference scores is
A) 65.027
B) 60.828
C) 22.991
D) 14.696
10-16 Two-Sample Tests
Referring to Scenario 10-5, the value of the standard error of the difference scores is
A) 65.027
B) 60.828
C) 22.991
D) 14.696
Unlock Deck
Unlock for access to all 95 flashcards in this deck.
Unlock Deck
k this deck
53
SCENARIO 10-5
10-16 Two-Sample Tests
Referring to Scenario 10-5, what is the critical value for testing at the 5% level of significance
Whether the business school preparation course is effective in improving exam scores?
A) 2.365
B) 2.145
C) 1.761
D) 1.895
10-16 Two-Sample Tests
Referring to Scenario 10-5, what is the critical value for testing at the 5% level of significance
Whether the business school preparation course is effective in improving exam scores?
A) 2.365
B) 2.145
C) 1.761
D) 1.895
Unlock Deck
Unlock for access to all 95 flashcards in this deck.
Unlock Deck
k this deck
54
Unlock Deck
Unlock for access to all 95 flashcards in this deck.
Unlock Deck
k this deck
55
True or False: A researcher is curious about the effect of sleep on students' test performances.He
chooses 60 students and gives each two tests: one given after two hours' sleep and one after eight
hours' sleep.The test the researcher should use would be a related samples test.
chooses 60 students and gives each two tests: one given after two hours' sleep and one after eight
hours' sleep.The test the researcher should use would be a related samples test.
Unlock Deck
Unlock for access to all 95 flashcards in this deck.
Unlock Deck
k this deck
56
SCENARIO 10-5
10-16 Two-Sample Tests
Referring to Scenario 10-5, at the 0.05 level of significance, the decision for this hypothesis test
Would be:
A) reject the null hypothesis.
B) do not reject the null hypothesis.
C) reject the alternative hypothesis.
D) It cannot be determined from the information given.
10-16 Two-Sample Tests
Referring to Scenario 10-5, at the 0.05 level of significance, the decision for this hypothesis test
Would be:
A) reject the null hypothesis.
B) do not reject the null hypothesis.
C) reject the alternative hypothesis.
D) It cannot be determined from the information given.
Unlock Deck
Unlock for access to all 95 flashcards in this deck.
Unlock Deck
k this deck
57
True or False: A Marine drill instructor recorded the time in which each of 11 recruits completed
an obstacle course both before and after basic training.To test whether any improvement
occurred, the instructor would use a t-distribution with 11 degrees of freedom.
an obstacle course both before and after basic training.To test whether any improvement
occurred, the instructor would use a t-distribution with 11 degrees of freedom.
Unlock Deck
Unlock for access to all 95 flashcards in this deck.
Unlock Deck
k this deck
58
In testing for the differences between the means of two related populations, you assume that the
differences follow a _______ distribution.
differences follow a _______ distribution.
Unlock Deck
Unlock for access to all 95 flashcards in this deck.
Unlock Deck
k this deck
59
SCENARIO 10-4
Two samples each of size 25 are taken from independent populations assumed to be normally
distributed with equal variances.The first sample has a mean of 35.5 and standard deviation of 3.0
while the second sample has a mean of 33.0 and standard deviation of 4.0.
Two samples each of size 25 are taken from independent populations assumed to be normally
distributed with equal variances.The first sample has a mean of 35.5 and standard deviation of 3.0
while the second sample has a mean of 33.0 and standard deviation of 4.0.
Unlock Deck
Unlock for access to all 95 flashcards in this deck.
Unlock Deck
k this deck
60
In testing for the differences between the means of two related populations, the _______
hypothesis is the hypothesis of "no differences."
hypothesis is the hypothesis of "no differences."
Unlock Deck
Unlock for access to all 95 flashcards in this deck.
Unlock Deck
k this deck
61
A powerful women's group has claimed that men and women differ in attitudes about sexual
Discrimination.A group of 50 men (group 1)and 40 women (group 2)were asked if they thought
Sexual discrimination is a problem in the United States.Of those sampled, 11 of the men and 19
Of the women did believe that sexual discrimination is a problem.Assuming W designates
Women's responses and M designates men's, which of the following are the appropriate null and
Alternative hypotheses to test the group's claim?
Discrimination.A group of 50 men (group 1)and 40 women (group 2)were asked if they thought
Sexual discrimination is a problem in the United States.Of those sampled, 11 of the men and 19
Of the women did believe that sexual discrimination is a problem.Assuming W designates
Women's responses and M designates men's, which of the following are the appropriate null and
Alternative hypotheses to test the group's claim?
Unlock Deck
Unlock for access to all 95 flashcards in this deck.
Unlock Deck
k this deck
62
The Wall Street Journal recently ran an article indicating differences in perception of sexual
Harassment on the job between men and women.The article claimed that women perceived the
Problem to be much more prevalent than did men.One question asked to both men and women
Was: "Do you think sexual harassment is a major problem in the American workplace?" Some
24% of the men compared to 62% of the women responded "Yes." Suppose that 150 women and
200 men were interviewed.For a 0.01 level of significance, what is the critical value for the
Rejection region?
A) 7.173
B) 7.106
C) 6.635
D) 2.33
Unlock Deck
Unlock for access to all 95 flashcards in this deck.
Unlock Deck
k this deck
63
SCENARIO 10-7
Referring to Scenario 10-7, what is the 99% confidence interval estimate for the mean difference
in prices?
Referring to Scenario 10-7, what is the 99% confidence interval estimate for the mean difference
in prices?
Unlock Deck
Unlock for access to all 95 flashcards in this deck.
Unlock Deck
k this deck
64
Unlock Deck
Unlock for access to all 95 flashcards in this deck.
Unlock Deck
k this deck
65
A powerful women's group has claimed that men and women differ in attitudes about sexual
Discrimination.A group of 50 men (group 1)and 40 women (group 2)were asked if they thought
Sexual discrimination is a problem in the United States.Of those sampled, 11 of the men and 19
Of the women did believe that sexual discrimination is a problem.Find the value of the test
Statistic.
A) Z = - 2.55
B) Z = - 0.85
C) Z = - 1.05
D) Z = - 1.20
Unlock Deck
Unlock for access to all 95 flashcards in this deck.
Unlock Deck
k this deck
66
SCENARIO 10-6
To investigate the efficacy of a diet, a random sample of 16 male patients is selected from a
population of adult males using the diet.The weight of each individual in the sample is taken at the
start of the diet and at a medical follow-up 4 weeks later.Assuming that the population of differences
in weight before versus after the diet follow a normal distribution, the t-test for related samples can be
used to determine if there was a significant decrease in the mean weight during this period.Suppose
the mean decrease in weights over all 16 subjects in the study is 3.0 pounds with the standard
deviation of differences computed as 6.0 pounds.
Unlock Deck
Unlock for access to all 95 flashcards in this deck.
Unlock Deck
k this deck
67
SCENARIO 10-7
Referring to Scenario 10-7, what is the 90% confidence interval estimate for the mean difference
in prices?
Referring to Scenario 10-7, what is the 90% confidence interval estimate for the mean difference
in prices?
Unlock Deck
Unlock for access to all 95 flashcards in this deck.
Unlock Deck
k this deck
68
The Wall Street Journal recently ran an article indicating differences in perception of sexual
Harassment on the job between men and women.The article claimed that women perceived the
Problem to be much more prevalent than did men.One question asked to both men and women
Was: "Do you think sexual harassment is a major problem in the American workplace?" Some
24% of the men compared to 62% of the women responded "Yes." Suppose that 150 women and
200 men were interviewed.What conclusion should be reached?
A) Using a 0.01 level of significance, there is sufficient evidence to conclude that women perceive the problem of sexual harassment on the job as much more prevalent than do
Men)
B) There is insufficient evidence to conclude with at least 99% confidence that women perceive the problem of sexual harassment on the job as much more prevalent than do
Men)
C) There is no evidence of a significant difference between the men and women in their perception.
D) More information is needed to draw any conclusions from the data set.
Unlock Deck
Unlock for access to all 95 flashcards in this deck.
Unlock Deck
k this deck
69
The Wall Street Journal recently ran an article indicating differences in perception of sexual
Harassment on the job between men and women.The article claimed that women perceived the
Problem to be much more prevalent than did men.One question asked to both men and women
Was: "Do you think sexual harassment is a major problem in the American workplace?" Some
24% of the men compared to 62% of the women responded "Yes." Suppose that 150 women and
200 men were interviewed.What is the value of the test statistic?
A) 7.173
B) 7.106
C) 6.635
D) 2.33
Unlock Deck
Unlock for access to all 95 flashcards in this deck.
Unlock Deck
k this deck
70
SCENARIO 10-7
Referring to Scenario 10-7, the decision rule is to reject the null hypothesis if ________.
Referring to Scenario 10-7, the decision rule is to reject the null hypothesis if ________.
Unlock Deck
Unlock for access to all 95 flashcards in this deck.
Unlock Deck
k this deck
71
Unlock Deck
Unlock for access to all 95 flashcards in this deck.
Unlock Deck
k this deck
72
Unlock Deck
Unlock for access to all 95 flashcards in this deck.
Unlock Deck
k this deck
73
SCENARIO 10-7
True or False: Referring to Scenario 10-7, the null hypothesis should be rejected.
True or False: Referring to Scenario 10-7, the null hypothesis should be rejected.
Unlock Deck
Unlock for access to all 95 flashcards in this deck.
Unlock Deck
k this deck
74
Moving companies are required by the government to publish a Carrier Performance Report each
Year.One of the descriptive statistics they must include is the annual percentage of shipments on
Which a $50 or greater claim for loss or damage was filed.Suppose two companies, Econo-Move
And On-the-Move, each decide to estimate this figure by sampling their records, and they report
The data shown in the following table.
The owner of On-the-Move is hoping to use these data to show that the company is superior to
Econo-Move with regard to the percentage of claims filed.Which test would be used to properly
Analyze the data in this experiment?
A)t test for the difference between two means
B)F test for the ratio of variances
C)Separate variance t test for the difference between two means
D)Z test for the difference between two proportions
Year.One of the descriptive statistics they must include is the annual percentage of shipments on
Which a $50 or greater claim for loss or damage was filed.Suppose two companies, Econo-Move
And On-the-Move, each decide to estimate this figure by sampling their records, and they report
The data shown in the following table.
The owner of On-the-Move is hoping to use these data to show that the company is superior to
Econo-Move with regard to the percentage of claims filed.Which test would be used to properly
Analyze the data in this experiment?
A)t test for the difference between two means
B)F test for the ratio of variances
C)Separate variance t test for the difference between two means
D)Z test for the difference between two proportions
Unlock Deck
Unlock for access to all 95 flashcards in this deck.
Unlock Deck
k this deck
75
SCENARIO 10-6
To investigate the efficacy of a diet, a random sample of 16 male patients is selected from a
population of adult males using the diet.The weight of each individual in the sample is taken at the
start of the diet and at a medical follow-up 4 weeks later.Assuming that the population of differences
in weight before versus after the diet follow a normal distribution, the t-test for related samples can be
used to determine if there was a significant decrease in the mean weight during this period.Suppose
the mean decrease in weights over all 16 subjects in the study is 3.0 pounds with the standard
deviation of differences computed as 6.0 pounds.
Referring to Scenario 10-6, what is the 95% confidence interval estimate for the mean difference
in weight before and after the diet?
Unlock Deck
Unlock for access to all 95 flashcards in this deck.
Unlock Deck
k this deck
76
SCENARIO 10-7
Referring to Scenario 10-7, what is the 95% confidence interval estimate for the mean difference
in prices?
Referring to Scenario 10-7, what is the 95% confidence interval estimate for the mean difference
in prices?
Unlock Deck
Unlock for access to all 95 flashcards in this deck.
Unlock Deck
k this deck
77
SCENARIO 10-6
To investigate the efficacy of a diet, a random sample of 16 male patients is selected from a
population of adult males using the diet.The weight of each individual in the sample is taken at the
start of the diet and at a medical follow-up 4 weeks later.Assuming that the population of differences
in weight before versus after the diet follow a normal distribution, the t-test for related samples can be
used to determine if there was a significant decrease in the mean weight during this period.Suppose
the mean decrease in weights over all 16 subjects in the study is 3.0 pounds with the standard
deviation of differences computed as 6.0 pounds.
Referring to Scenario 10-6, what is the 99% confidence interval estimate for the mean difference
in weight before and after the diet?
Unlock Deck
Unlock for access to all 95 flashcards in this deck.
Unlock Deck
k this deck
78
SCENARIO 10-7
Referring to Scenario 10-7, the test to perform is a
A) pooled-variance t test for differences between two means.
B) separate-variance t test for differences between two means.
C) Z test for the difference between two proportions.
D) paired t-test for the mean difference.
Referring to Scenario 10-7, the test to perform is a
A) pooled-variance t test for differences between two means.
B) separate-variance t test for differences between two means.
C) Z test for the difference between two proportions.
D) paired t-test for the mean difference.
Unlock Deck
Unlock for access to all 95 flashcards in this deck.
Unlock Deck
k this deck
79
SCENARIO 10-7
Referring to Scenario 10-7, the hypotheses that the buyer should test are a null hypothesis that
________ versus an alternative hypothesis that ________.
Referring to Scenario 10-7, the hypotheses that the buyer should test are a null hypothesis that
________ versus an alternative hypothesis that ________.
Unlock Deck
Unlock for access to all 95 flashcards in this deck.
Unlock Deck
k this deck
80
Unlock Deck
Unlock for access to all 95 flashcards in this deck.
Unlock Deck
k this deck
Unlock Deck
Unlock for access to all 95 flashcards in this deck.


