Deck 9: Fundamentals of Hypothesis Testing: One-Sample Tests
Full screen (f)
Question
Question
Question
Question
Question
Question
Question
Question
Question
Question
Question
Question
Question
Question
Question
Question
Question
Question
Question
Question
Question
Question

Question
Question
Question
Question
Which of the following statements is not true about the level of significance in a hypothesis test?
A) The larger the level of significance, the more likely you are to reject the null hypothesis.
B) The level of significance is the maximum risk we are willing to accept in making a Type I error.
C)
D) The significance level is another name for Type II error.
A) The larger the level of significance, the more likely you are to reject the null hypothesis.
B) The level of significance is the maximum risk we are willing to accept in making a Type I error.
C)
D) The significance level is another name for Type II error.
Question
Question
Question
Question
Question
Question
Question
Question
Question
Question
Question
Question
Question
Question
Question
Question
Question
Question
Question
SCENARIO 9-1
Microsoft Excel was used on a set of data involving the number of defective items found in a random
sample of 46 cases of light bulbs produced during a morning shift at a plant.A manager wants to
know if the mean number of defective bulbs per case is greater than 20 during the morning shift.She
will make her decision using a test with a level of significance of 0.10.The following information
was extracted from the Microsoft Excel output for the sample of 46 cases: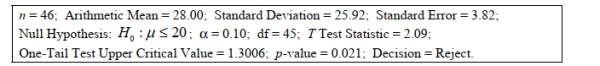
Referring to Scenario 9-1, what critical value should the manager use to determine the rejection
Region?
A) 1.6794
B) 1.3011
C) 1.3006
D) 0.6800
Question
Question
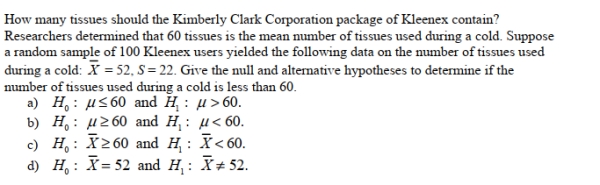
The owner of a local nightclub has recently surveyed a random sample of n = 250 customers of
The club.She would now like to determine whether or not the mean age of her customers is
Greater than 30.If so, she plans to alter the entertainment to appeal to an older crowd.If not, no
Entertainment changes will be made.The appropriate hypotheses to test are: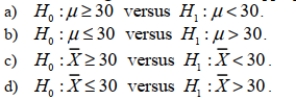
The club.She would now like to determine whether or not the mean age of her customers is
Greater than 30.If so, she plans to alter the entertainment to appeal to an older crowd.If not, no
Entertainment changes will be made.The appropriate hypotheses to test are:
Question
Question
SCENARIO 9-1
Microsoft Excel was used on a set of data involving the number of defective items found in a random
sample of 46 cases of light bulbs produced during a morning shift at a plant.A manager wants to
know if the mean number of defective bulbs per case is greater than 20 during the morning shift.She
will make her decision using a test with a level of significance of 0.10.The following information
was extracted from the Microsoft Excel output for the sample of 46 cases:
Referring to Scenario 9-1, state the alternative hypothesis for this study.
Question
Question
Question
SCENARIO 9-1
Microsoft Excel was used on a set of data involving the number of defective items found in a random
sample of 46 cases of light bulbs produced during a morning shift at a plant.A manager wants to
know if the mean number of defective bulbs per case is greater than 20 during the morning shift.She
will make her decision using a test with a level of significance of 0.10.The following information
was extracted from the Microsoft Excel output for the sample of 46 cases:
Referring to Scenario 9-1, the parameter the manager is interested in is:
A) the mean number of defective light bulbs per case produced at the plant.
B) the mean number of defective light bulbs per case among the 46 cases.
C) the mean number of defective light bulbs per case produced during the morning shift.
D) the proportion of cases with defective light bulbs produced at the plant.
Question
A pizza chain is considering opening a new store in an area that currently does not have any such
Stores.The chain will open if there is evidence that more than 5,000 of the 20,000 households in
The area have a favorable view of its brain.It conducts a telephone poll of 300 randomly selected
Households in the area and finds that 96 have a favorable view.The decision on the hypothesis
Test using a 5% level of significance is: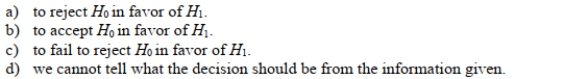
Question
Question
Question
Question
A pizza chain is considering opening a new store in an area that currently does not have any such
Stores.The chain will open if there is evidence that more than 5,000 of the 20,000 households in
The area have a favorable view of its brain.It conducts a telephone poll of 300 randomly selected
Households in the area and finds that 96 have a favorable view.State the test of hypothesis that is
Of interest to the pizza chain.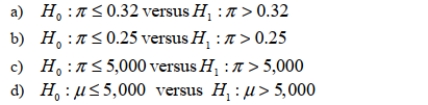
Question
Question
Question
Question
SCENARIO 9-1
Microsoft Excel was used on a set of data involving the number of defective items found in a random
sample of 46 cases of light bulbs produced during a morning shift at a plant.A manager wants to
know if the mean number of defective bulbs per case is greater than 20 during the morning shift.She
will make her decision using a test with a level of significance of 0.10.The following information
was extracted from the Microsoft Excel output for the sample of 46 cases:
True or False: Referring to Scenario 9-1, the manager can conclude that there is sufficient
evidence to show that the mean number of defective bulbs per case is greater than 20 during the
morning shift with no more than a 1% probability of incorrectly rejecting the true null hypothesis.
Question
Question
SCENARIO 9-1
Microsoft Excel was used on a set of data involving the number of defective items found in a random
sample of 46 cases of light bulbs produced during a morning shift at a plant.A manager wants to
know if the mean number of defective bulbs per case is greater than 20 during the morning shift.She
will make her decision using a test with a level of significance of 0.10.The following information
was extracted from the Microsoft Excel output for the sample of 46 cases:
True or False: Referring to Scenario 9-1, the evidence proves beyond a doubt that the mean
number of defective bulbs per case is greater than 20 during the morning shift.
Question
SCENARIO 9-1
Microsoft Excel was used on a set of data involving the number of defective items found in a random
sample of 46 cases of light bulbs produced during a morning shift at a plant.A manager wants to
know if the mean number of defective bulbs per case is greater than 20 during the morning shift.She
will make her decision using a test with a level of significance of 0.10.The following information
was extracted from the Microsoft Excel output for the sample of 46 cases:
True or False: Referring to Scenario 9-1, the null hypothesis would be rejected.
Question
Question
Question
Question
SCENARIO 9-1
Microsoft Excel was used on a set of data involving the number of defective items found in a random
sample of 46 cases of light bulbs produced during a morning shift at a plant.A manager wants to
know if the mean number of defective bulbs per case is greater than 20 during the morning shift.She
will make her decision using a test with a level of significance of 0.10.The following information
was extracted from the Microsoft Excel output for the sample of 46 cases:
True or False: Referring to Scenario 9-1, the null hypothesis would be rejected if a 5% probability
of committing a Type I error is allowed.
Question
Question
SCENARIO 9-1
Microsoft Excel was used on a set of data involving the number of defective items found in a random
sample of 46 cases of light bulbs produced during a morning shift at a plant.A manager wants to
know if the mean number of defective bulbs per case is greater than 20 during the morning shift.She
will make her decision using a test with a level of significance of 0.10.The following information
was extracted from the Microsoft Excel output for the sample of 46 cases:
True or False: Referring to Scenario 9-1, if these data were used to perform a two-tail test, the p-
value would be 0.042.
Question
Question
SCENARIO 9-1
Microsoft Excel was used on a set of data involving the number of defective items found in a random
sample of 46 cases of light bulbs produced during a morning shift at a plant.A manager wants to
know if the mean number of defective bulbs per case is greater than 20 during the morning shift.She
will make her decision using a test with a level of significance of 0.10.The following information
was extracted from the Microsoft Excel output for the sample of 46 cases:
True or False: Referring to Scenario 9-1, the null hypothesis would be rejected if a 1% probability
of committing a Type I error is allowed.
Question
SCENARIO 9-1
Microsoft Excel was used on a set of data involving the number of defective items found in a random
sample of 46 cases of light bulbs produced during a morning shift at a plant.A manager wants to
know if the mean number of defective bulbs per case is greater than 20 during the morning shift.She
will make her decision using a test with a level of significance of 0.10.The following information
was extracted from the Microsoft Excel output for the sample of 46 cases:
True or False: Referring to Scenario 9-1, the manager can conclude that there is sufficient
evidence to show that the mean number of defective bulbs per case is greater than 20 during the
morning shift with no more than a 5% probability of incorrectly rejecting the true null hypothesis.
Question
Question
Question
Question
SCENARIO 9-1
Microsoft Excel was used on a set of data involving the number of defective items found in a random
sample of 46 cases of light bulbs produced during a morning shift at a plant.A manager wants to
know if the mean number of defective bulbs per case is greater than 20 during the morning shift.She
will make her decision using a test with a level of significance of 0.10.The following information
was extracted from the Microsoft Excel output for the sample of 46 cases:
True or False: Referring to Scenario 9-1, the manager can conclude that there is sufficient
evidence to show that the mean number of defective bulbs per case is greater than 20 during the
morning shift using a level of significance of 0.10.
Question
Question
Question

Unlock Deck
Sign up to unlock the cards in this deck!
Unlock Deck
Unlock Deck
1/133
Play
Full screen (f)
Deck 9: Fundamentals of Hypothesis Testing: One-Sample Tests
1
D
2
B
3
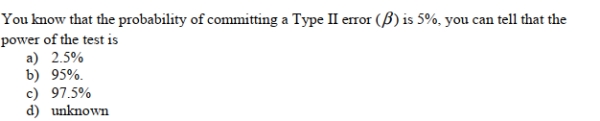
The power of a test is measured by its capability of
A) rejecting a null hypothesis that is true.
B) not rejecting a null hypothesis that is true.
C) rejecting a null hypothesis that is false.
D) not rejecting a null hypothesis that is false.
A) rejecting a null hypothesis that is true.
B) not rejecting a null hypothesis that is true.
C) rejecting a null hypothesis that is false.
D) not rejecting a null hypothesis that is false.
C
4
Which of the following would be an appropriate null hypothesis?
A) The mean of a population is equal to 55.
B) The mean of a sample is equal to 55.
C) The mean of a population is greater than 55.
D) Only (a) and (c) are appropriate.
A) The mean of a population is equal to 55.
B) The mean of a sample is equal to 55.
C) The mean of a population is greater than 55.
D) Only (a) and (c) are appropriate.
Unlock Deck
Unlock for access to all 133 flashcards in this deck.
Unlock Deck
k this deck
5
Which of the following would be an appropriate null hypothesis?
A) The population proportion is less than 0.65.
B) The sample proportion is less than 0.65.
C) The population proportion is not less than 0.65.
D) The sample proportion is no less than 0.65.
A) The population proportion is less than 0.65.
B) The sample proportion is less than 0.65.
C) The population proportion is not less than 0.65.
D) The sample proportion is no less than 0.65.
Unlock Deck
Unlock for access to all 133 flashcards in this deck.
Unlock Deck
k this deck
6
Unlock Deck
Unlock for access to all 133 flashcards in this deck.
Unlock Deck
k this deck
7
True or False: For a given level of significance, if the sample size is increased but the summary
statistics remain the same, the probability of committing a Type II error will increase.
statistics remain the same, the probability of committing a Type II error will increase.
Unlock Deck
Unlock for access to all 133 flashcards in this deck.
Unlock Deck
k this deck
8
For a given sample size n, if the level of significance (α)is decreased, the power of the test
A) will increase.
B) will decrease.
C) will remain the same.
D) cannot be determined.
A) will increase.
B) will decrease.
C) will remain the same.
D) cannot be determined.
Unlock Deck
Unlock for access to all 133 flashcards in this deck.
Unlock Deck
k this deck
9
Unlock Deck
Unlock for access to all 133 flashcards in this deck.
Unlock Deck
k this deck
10
Unlock Deck
Unlock for access to all 133 flashcards in this deck.
Unlock Deck
k this deck
11
A Type I error is committed when
A) you reject a null hypothesis that is true.
B) you don't reject a null hypothesis that is true.
C) you reject a null hypothesis that is false.
D) you don't reject a null hypothesis that is false.
A) you reject a null hypothesis that is true.
B) you don't reject a null hypothesis that is true.
C) you reject a null hypothesis that is false.
D) you don't reject a null hypothesis that is false.
Unlock Deck
Unlock for access to all 133 flashcards in this deck.
Unlock Deck
k this deck
12
If a researcher rejects a true null hypothesis, she has made a _______error.
Unlock Deck
Unlock for access to all 133 flashcards in this deck.
Unlock Deck
k this deck
13
If an economist wishes to determine whether there is evidence that mean family income in a
Community equals $50,000
A) either a one-tail or two-tail test could be used with equivalent results.
B) a one-tail test should be utilized.
C) a two-tail test should be utilized.
D) None of the above.
Community equals $50,000
A) either a one-tail or two-tail test could be used with equivalent results.
B) a one-tail test should be utilized.
C) a two-tail test should be utilized.
D) None of the above.
Unlock Deck
Unlock for access to all 133 flashcards in this deck.
Unlock Deck
k this deck
14
A Type II error is committed when
A) you reject a null hypothesis that is true.
B) you don't reject a null hypothesis that is true.
C) you reject a null hypothesis that is false.
D) you don't reject a null hypothesis that is false.
A) you reject a null hypothesis that is true.
B) you don't reject a null hypothesis that is true.
C) you reject a null hypothesis that is false.
D) you don't reject a null hypothesis that is false.
Unlock Deck
Unlock for access to all 133 flashcards in this deck.
Unlock Deck
k this deck
15
True or False: For a given level of significance, if the sample size is increased but the summary
statistics remain the same, the probability of committing a Type I error will increase.
statistics remain the same, the probability of committing a Type I error will increase.
Unlock Deck
Unlock for access to all 133 flashcards in this deck.
Unlock Deck
k this deck
16
Which of the following would be an appropriate alternative hypothesis?
A) The mean of a population is equal to 55.
B) The mean of a sample is equal to 55.
C) The mean of a population is greater than 55.
D) The mean of a sample is greater than 55.
A) The mean of a population is equal to 55.
B) The mean of a sample is equal to 55.
C) The mean of a population is greater than 55.
D) The mean of a sample is greater than 55.
Unlock Deck
Unlock for access to all 133 flashcards in this deck.
Unlock Deck
k this deck
17
Unlock Deck
Unlock for access to all 133 flashcards in this deck.
Unlock Deck
k this deck
18
If an economist wishes to determine whether there is evidence that mean family income in a
Community exceeds $50,000
A) either a one-tail or two-tail test could be used with equivalent results.
B) a one-tail test should be utilized.
C) a two-tail test should be utilized.
D) None of the above.
Community exceeds $50,000
A) either a one-tail or two-tail test could be used with equivalent results.
B) a one-tail test should be utilized.
C) a two-tail test should be utilized.
D) None of the above.
Unlock Deck
Unlock for access to all 133 flashcards in this deck.
Unlock Deck
k this deck
19
True or False: For a given sample size, the probability of committing a Type II error will increase
when the probability of committing a Type I error is reduced.
when the probability of committing a Type I error is reduced.
Unlock Deck
Unlock for access to all 133 flashcards in this deck.
Unlock Deck
k this deck
20
Which of the following would be an appropriate alternative hypothesis?
A) The population proportion is less than 0.65.
B) The sample proportion is less than 0.65.
C) The population proportion is not less than 0.65.
D) The sample proportion is not less than 0.65.
A) The population proportion is less than 0.65.
B) The sample proportion is less than 0.65.
C) The population proportion is not less than 0.65.
D) The sample proportion is not less than 0.65.
Unlock Deck
Unlock for access to all 133 flashcards in this deck.
Unlock Deck
k this deck
21
If a researcher does not reject a false null hypothesis, she has made a _______error.
Unlock Deck
Unlock for access to all 133 flashcards in this deck.
Unlock Deck
k this deck
22
Unlock Deck
Unlock for access to all 133 flashcards in this deck.
Unlock Deck
k this deck
23
Unlock Deck
Unlock for access to all 133 flashcards in this deck.
Unlock Deck
k this deck
24
Unlock Deck
Unlock for access to all 133 flashcards in this deck.
Unlock Deck
k this deck
25
Unlock Deck
Unlock for access to all 133 flashcards in this deck.
Unlock Deck
k this deck
26
Which of the following statements is not true about the level of significance in a hypothesis test?
A) The larger the level of significance, the more likely you are to reject the null hypothesis.
B) The level of significance is the maximum risk we are willing to accept in making a Type I error.
C)
D) The significance level is another name for Type II error.
A) The larger the level of significance, the more likely you are to reject the null hypothesis.
B) The level of significance is the maximum risk we are willing to accept in making a Type I error.
C)
D) The significance level is another name for Type II error.
Unlock Deck
Unlock for access to all 133 flashcards in this deck.
Unlock Deck
k this deck
27
Unlock Deck
Unlock for access to all 133 flashcards in this deck.
Unlock Deck
k this deck
28
Unlock Deck
Unlock for access to all 133 flashcards in this deck.
Unlock Deck
k this deck
29
The power of a statistical test is
A) the probability of not rejecting H0 when it is false.
B) the probability of rejecting H0 when it is true.
C) the probability of not rejecting H0 when it is true.
D) the probability of rejecting H0 when it is false.
A) the probability of not rejecting H0 when it is false.
B) the probability of rejecting H0 when it is true.
C) the probability of not rejecting H0 when it is true.
D) the probability of rejecting H0 when it is false.
Unlock Deck
Unlock for access to all 133 flashcards in this deck.
Unlock Deck
k this deck
30
Unlock Deck
Unlock for access to all 133 flashcards in this deck.
Unlock Deck
k this deck
31
Unlock Deck
Unlock for access to all 133 flashcards in this deck.
Unlock Deck
k this deck
32
Unlock Deck
Unlock for access to all 133 flashcards in this deck.
Unlock Deck
k this deck
33
Unlock Deck
Unlock for access to all 133 flashcards in this deck.
Unlock Deck
k this deck
34
Unlock Deck
Unlock for access to all 133 flashcards in this deck.
Unlock Deck
k this deck
35
Unlock Deck
Unlock for access to all 133 flashcards in this deck.
Unlock Deck
k this deck
36
If a researcher does not reject a true null hypothesis, she has made a _______decision.
Unlock Deck
Unlock for access to all 133 flashcards in this deck.
Unlock Deck
k this deck
37
Unlock Deck
Unlock for access to all 133 flashcards in this deck.
Unlock Deck
k this deck
38
If a researcher rejects a false null hypothesis, she has made a _______decision.
Unlock Deck
Unlock for access to all 133 flashcards in this deck.
Unlock Deck
k this deck
39
Unlock Deck
Unlock for access to all 133 flashcards in this deck.
Unlock Deck
k this deck
40
Unlock Deck
Unlock for access to all 133 flashcards in this deck.
Unlock Deck
k this deck
41
The marketing manager for an automobile manufacturer is interested in determining the
Proportion of new compact-car owners who would have purchased a GPS navigation system if it
Had been available for an additional cost of $300.The manager believes from previous
Information that the proportion is 0.30.Suppose that a survey of 200 new compact-car owners is
Selected and 79 indicate that they would have purchased the GPS navigation system.If you were
To conduct a test to determine whether there is evidence that the proportion is different from 0.30
And decided not to reject the null hypothesis, what conclusion could you reach?
A) There is sufficient evidence that the proportion is 0.30.
B) There is not sufficient evidence that the proportion is 0.30.
C) There is sufficient evidence that the proportion is 0.30.
D) There is not sufficient evidence that the proportion is not 0.30.
Unlock Deck
Unlock for access to all 133 flashcards in this deck.
Unlock Deck
k this deck
42
A is a numerical quantity computed from the data of a sample and is used
In reaching a decision on whether or not to reject the null hypothesis.
A) significance level
B) critical value
C) test statistic
D) parameter
In reaching a decision on whether or not to reject the null hypothesis.
A) significance level
B) critical value
C) test statistic
D) parameter
Unlock Deck
Unlock for access to all 133 flashcards in this deck.
Unlock Deck
k this deck
43
The owner of a local nightclub has recently surveyed a random sample of n = 250 customers of
The club.She would now like to determine whether or not the mean age of her customers is
Greater than 30.If so, she plans to alter the entertainment to appeal to an older crowd.If not, no
Entertainment changes will be made.Suppose she found that the sample mean was 30.45 years
And the sample standard deviation was 5 years.What is the p-value associated with the test
Statistic?
A) 0.3577
B) 0.1423
C) 0.0780
D) 0.02
Unlock Deck
Unlock for access to all 133 flashcards in this deck.
Unlock Deck
k this deck
44
A manager of the credit department for an oil company would like to determine whether the mean
Monthly balance of credit card holders is equal to $75.An auditor selects a random sample of 100
Accounts and finds that the mean owed is $83.40 with a sample standard deviation of $23.65.If
You wanted to test whether the mean balance is different from $75 and decided to reject the null
Hypothesis, what conclusion could you reach?
A) There is not evidence that the mean balance is $75.
B) There is not evidence that the mean balance is not $75.
C) There is evidence that the mean balance is $75.
D) There is evidence that the mean balance is not $75.
Unlock Deck
Unlock for access to all 133 flashcards in this deck.
Unlock Deck
k this deck
45
SCENARIO 9-1
Microsoft Excel was used on a set of data involving the number of defective items found in a random
sample of 46 cases of light bulbs produced during a morning shift at a plant.A manager wants to
know if the mean number of defective bulbs per case is greater than 20 during the morning shift.She
will make her decision using a test with a level of significance of 0.10.The following information
was extracted from the Microsoft Excel output for the sample of 46 cases:
Referring to Scenario 9-1, what critical value should the manager use to determine the rejection
Region?
A) 1.6794
B) 1.3011
C) 1.3006
D) 0.6800
Unlock Deck
Unlock for access to all 133 flashcards in this deck.
Unlock Deck
k this deck
46
A pizza chain is considering opening a new store in an area that currently does not have any such
Stores.The chain will open if there is evidence that more than 5,000 of the 20,000 households in
The area have a favorable view of its brain.It conducts a telephone poll of 300 randomly selected
Households in the area and finds that 96 have a favorable view.The pizza chain's conclusion from
The hypothesis test using a 5% level of significance is:
A) to open a new store.
B) not to open a new store.
C) to delay opening a new store until additional evidence is collected.
D) we cannot tell what the decision should be from the information given.
Unlock Deck
Unlock for access to all 133 flashcards in this deck.
Unlock Deck
k this deck
47
The owner of a local nightclub has recently surveyed a random sample of n = 250 customers of
The club.She would now like to determine whether or not the mean age of her customers is
Greater than 30.If so, she plans to alter the entertainment to appeal to an older crowd.If not, no
Entertainment changes will be made.The appropriate hypotheses to test are:
The club.She would now like to determine whether or not the mean age of her customers is
Greater than 30.If so, she plans to alter the entertainment to appeal to an older crowd.If not, no
Entertainment changes will be made.The appropriate hypotheses to test are:
Unlock Deck
Unlock for access to all 133 flashcards in this deck.
Unlock Deck
k this deck
48
A survey claims that 9 out of 10 doctors recommend aspirin for their patients with headaches.To
Test this claim against the alternative that the actual proportion of doctors who recommend aspirin
Is less than 0.90, a random sample of 100 doctors results in 83 who indicate that they recommend
Aspirin.The value of the test statistic in this problem is approximately equal to:
A) - 4.12
B) - 2.33
C) - 1.86
D) - 0.07
Unlock Deck
Unlock for access to all 133 flashcards in this deck.
Unlock Deck
k this deck
49
SCENARIO 9-1
Microsoft Excel was used on a set of data involving the number of defective items found in a random
sample of 46 cases of light bulbs produced during a morning shift at a plant.A manager wants to
know if the mean number of defective bulbs per case is greater than 20 during the morning shift.She
will make her decision using a test with a level of significance of 0.10.The following information
was extracted from the Microsoft Excel output for the sample of 46 cases:
Referring to Scenario 9-1, state the alternative hypothesis for this study.
Unlock Deck
Unlock for access to all 133 flashcards in this deck.
Unlock Deck
k this deck
50
If, as a result of a hypothesis test, you reject the null hypothesis when it is false, then you have
Committed
A) a Type II error.
B) a Type I error.
C) no error.
D) an acceptance error.
Committed
A) a Type II error.
B) a Type I error.
C) no error.
D) an acceptance error.
Unlock Deck
Unlock for access to all 133 flashcards in this deck.
Unlock Deck
k this deck
51
A pizza chain is considering opening a new store in an area that currently does not have any such
Stores.The chain will open if there is evidence that more than 5,000 of the 20,000 households in
The area have a favorable view of its brain.It conducts a telephone poll of 300 randomly selected
Households in the area and finds that 96 have a favorable view.The value of the test statistic in
This problem is approximately equal to:
A) 2.80
B) 2.60
C) 1.94
D) 1.30
Unlock Deck
Unlock for access to all 133 flashcards in this deck.
Unlock Deck
k this deck
52
SCENARIO 9-1
Microsoft Excel was used on a set of data involving the number of defective items found in a random
sample of 46 cases of light bulbs produced during a morning shift at a plant.A manager wants to
know if the mean number of defective bulbs per case is greater than 20 during the morning shift.She
will make her decision using a test with a level of significance of 0.10.The following information
was extracted from the Microsoft Excel output for the sample of 46 cases:
Referring to Scenario 9-1, the parameter the manager is interested in is:
A) the mean number of defective light bulbs per case produced at the plant.
B) the mean number of defective light bulbs per case among the 46 cases.
C) the mean number of defective light bulbs per case produced during the morning shift.
D) the proportion of cases with defective light bulbs produced at the plant.
Unlock Deck
Unlock for access to all 133 flashcards in this deck.
Unlock Deck
k this deck
53
A pizza chain is considering opening a new store in an area that currently does not have any such
Stores.The chain will open if there is evidence that more than 5,000 of the 20,000 households in
The area have a favorable view of its brain.It conducts a telephone poll of 300 randomly selected
Households in the area and finds that 96 have a favorable view.The decision on the hypothesis
Test using a 5% level of significance is:
Unlock Deck
Unlock for access to all 133 flashcards in this deck.
Unlock Deck
k this deck
54
A pizza chain is considering opening a new store in an area that currently does not have any such
Stores.The chain will open if there is evidence that more than 5,000 of the 20,000 households in
The area have a favorable view of its brain.It conducts a telephone poll of 300 randomly selected
Households in the area and finds that 96 have a favorable view.The p-value associated with the
Test statistic in this problem is approximately equal to:
A) 0.0100
B) 0.0051
C) 0.0026
D) 0.0013
Unlock Deck
Unlock for access to all 133 flashcards in this deck.
Unlock Deck
k this deck
55
The owner of a local nightclub has recently surveyed a random sample of n = 250 customers of
The club.She would now like to determine whether or not the mean age of her customers is
Greater than 30.If so, she plans to alter the entertainment to appeal to an older crowd.If not, no
Entertainment changes will be made.Suppose she found that the sample mean was 30.45 years
And the sample standard deviation was 5 years.If she wants to have a level of significance at 0.01
What conclusion can she make?
A) There is not sufficient evidence that the mean age of her customers is greater than 30.
B) There is sufficient evidence that the mean age of her customers is greater than 30.
C) There is not sufficient evidence that the mean age of her customers is not greater than 30.
D) There is sufficient evidence that the mean age of her customers is not greater than 30.
Unlock Deck
Unlock for access to all 133 flashcards in this deck.
Unlock Deck
k this deck
56
The value that separates a rejection region from a non-rejection region is called the _______.
Unlock Deck
Unlock for access to all 133 flashcards in this deck.
Unlock Deck
k this deck
57
A pizza chain is considering opening a new store in an area that currently does not have any such
Stores.The chain will open if there is evidence that more than 5,000 of the 20,000 households in
The area have a favorable view of its brain.It conducts a telephone poll of 300 randomly selected
Households in the area and finds that 96 have a favorable view.State the test of hypothesis that is
Of interest to the pizza chain.
Unlock Deck
Unlock for access to all 133 flashcards in this deck.
Unlock Deck
k this deck
58
An entrepreneur is considering the purchase of a coin-operated laundry.The current owner claims
That over the past 5 years, the mean daily revenue was $675 with a population standard deviation
Of $75.A sample of 30 days reveals a daily mean revenue of $625.If you were to test the null
Hypothesis that the daily mean revenue was $675 and decide not to reject the null hypothesis,
What can you conclude?
A) There is not enough evidence to conclude that the daily mean revenue was $675.
B) There is not enough evidence to conclude that the daily mean revenue was not $675.
C) There is enough evidence to conclude that the daily mean revenue was $675.
D) There is enough evidence to conclude that the daily mean revenue was not $675.
Unlock Deck
Unlock for access to all 133 flashcards in this deck.
Unlock Deck
k this deck
59
A manager of the credit department for an oil company would like to determine whether the mean
Monthly balance of credit card holders is equal to $75.An auditor selects a random sample of 100
Accounts and finds that the mean owed is $83.40 with a sample standard deviation of $23.65.If
You were to conduct a test to determine whether the auditor should conclude that there is
Evidence that the mean balance is different from $75, which test would you use?
A) Z-test of a population mean
B) Z-test of a population proportion
C) t-test of population mean
D) t-test of a population proportion
Unlock Deck
Unlock for access to all 133 flashcards in this deck.
Unlock Deck
k this deck
60
An entrepreneur is considering the purchase of a coin-operated laundry.The current owner claims
That over the past 5 years, the mean daily revenue was $675 with a population standard deviation
Of $75.A sample of 30 days reveals a daily mean revenue of $625.If you were to test the null
Hypothesis that the daily mean revenue was $675, which test would you use?
A) Z-test of a population mean
B) Z-test of a population proportion
C) t-test of population mean
D) t-test of a population proportion
Unlock Deck
Unlock for access to all 133 flashcards in this deck.
Unlock Deck
k this deck
61
SCENARIO 9-1
Microsoft Excel was used on a set of data involving the number of defective items found in a random
sample of 46 cases of light bulbs produced during a morning shift at a plant.A manager wants to
know if the mean number of defective bulbs per case is greater than 20 during the morning shift.She
will make her decision using a test with a level of significance of 0.10.The following information
was extracted from the Microsoft Excel output for the sample of 46 cases:
True or False: Referring to Scenario 9-1, the manager can conclude that there is sufficient
evidence to show that the mean number of defective bulbs per case is greater than 20 during the
morning shift with no more than a 1% probability of incorrectly rejecting the true null hypothesis.
Unlock Deck
Unlock for access to all 133 flashcards in this deck.
Unlock Deck
k this deck
62
True or False: The smaller the p-value, the stronger is the evidence against the null hypothesis.
Unlock Deck
Unlock for access to all 133 flashcards in this deck.
Unlock Deck
k this deck
63
SCENARIO 9-1
Microsoft Excel was used on a set of data involving the number of defective items found in a random
sample of 46 cases of light bulbs produced during a morning shift at a plant.A manager wants to
know if the mean number of defective bulbs per case is greater than 20 during the morning shift.She
will make her decision using a test with a level of significance of 0.10.The following information
was extracted from the Microsoft Excel output for the sample of 46 cases:
True or False: Referring to Scenario 9-1, the evidence proves beyond a doubt that the mean
number of defective bulbs per case is greater than 20 during the morning shift.
Unlock Deck
Unlock for access to all 133 flashcards in this deck.
Unlock Deck
k this deck
64
SCENARIO 9-1
Microsoft Excel was used on a set of data involving the number of defective items found in a random
sample of 46 cases of light bulbs produced during a morning shift at a plant.A manager wants to
know if the mean number of defective bulbs per case is greater than 20 during the morning shift.She
will make her decision using a test with a level of significance of 0.10.The following information
was extracted from the Microsoft Excel output for the sample of 46 cases:
True or False: Referring to Scenario 9-1, the null hypothesis would be rejected.
Unlock Deck
Unlock for access to all 133 flashcards in this deck.
Unlock Deck
k this deck
65
True or False: In testing a hypothesis, you should always raise the question concerning the
purpose of the study, survey or experiment.
purpose of the study, survey or experiment.
Unlock Deck
Unlock for access to all 133 flashcards in this deck.
Unlock Deck
k this deck
66
True or False: In a hypothesis test, it is irrelevant whether the test is a one-tail or two-tail test.
Unlock Deck
Unlock for access to all 133 flashcards in this deck.
Unlock Deck
k this deck
67
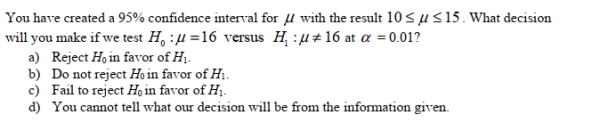
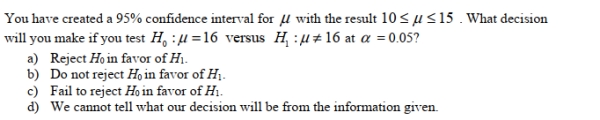
True or False: A sample is used to obtain a 95% confidence interval for the mean of a population.
The confidence interval goes from 15 to 19.If the same sample had been used to test the null
hypothesis that the mean of the population is equal to 20 versus the alternative hypothesis that the
mean of the population differs from 20, the null hypothesis could be rejected at a level of
significance of 0.05.
Unlock Deck
Unlock for access to all 133 flashcards in this deck.
Unlock Deck
k this deck
68
SCENARIO 9-1
Microsoft Excel was used on a set of data involving the number of defective items found in a random
sample of 46 cases of light bulbs produced during a morning shift at a plant.A manager wants to
know if the mean number of defective bulbs per case is greater than 20 during the morning shift.She
will make her decision using a test with a level of significance of 0.10.The following information
was extracted from the Microsoft Excel output for the sample of 46 cases:
True or False: Referring to Scenario 9-1, the null hypothesis would be rejected if a 5% probability
of committing a Type I error is allowed.
Unlock Deck
Unlock for access to all 133 flashcards in this deck.
Unlock Deck
k this deck
69
True or False: A sample is used to obtain a 95% confidence interval for the mean of a population.
The confidence interval goes from 15 to 19.If the same sample had been used to test the null
hypothesis that the mean of the population is equal to 20 versus the alternative hypothesis that the
mean of the population differs from 20, the null hypothesis could be rejected at a level of
significance of 0.10.
Unlock Deck
Unlock for access to all 133 flashcards in this deck.
Unlock Deck
k this deck
70
SCENARIO 9-1
Microsoft Excel was used on a set of data involving the number of defective items found in a random
sample of 46 cases of light bulbs produced during a morning shift at a plant.A manager wants to
know if the mean number of defective bulbs per case is greater than 20 during the morning shift.She
will make her decision using a test with a level of significance of 0.10.The following information
was extracted from the Microsoft Excel output for the sample of 46 cases:
True or False: Referring to Scenario 9-1, if these data were used to perform a two-tail test, the p-
value would be 0.042.
Unlock Deck
Unlock for access to all 133 flashcards in this deck.
Unlock Deck
k this deck
71
True or False: The statement of the null hypothesis always contains an equality.
Unlock Deck
Unlock for access to all 133 flashcards in this deck.
Unlock Deck
k this deck
72
SCENARIO 9-1
Microsoft Excel was used on a set of data involving the number of defective items found in a random
sample of 46 cases of light bulbs produced during a morning shift at a plant.A manager wants to
know if the mean number of defective bulbs per case is greater than 20 during the morning shift.She
will make her decision using a test with a level of significance of 0.10.The following information
was extracted from the Microsoft Excel output for the sample of 46 cases:
True or False: Referring to Scenario 9-1, the null hypothesis would be rejected if a 1% probability
of committing a Type I error is allowed.
Unlock Deck
Unlock for access to all 133 flashcards in this deck.
Unlock Deck
k this deck
73
SCENARIO 9-1
Microsoft Excel was used on a set of data involving the number of defective items found in a random
sample of 46 cases of light bulbs produced during a morning shift at a plant.A manager wants to
know if the mean number of defective bulbs per case is greater than 20 during the morning shift.She
will make her decision using a test with a level of significance of 0.10.The following information
was extracted from the Microsoft Excel output for the sample of 46 cases:
True or False: Referring to Scenario 9-1, the manager can conclude that there is sufficient
evidence to show that the mean number of defective bulbs per case is greater than 20 during the
morning shift with no more than a 5% probability of incorrectly rejecting the true null hypothesis.
Unlock Deck
Unlock for access to all 133 flashcards in this deck.
Unlock Deck
k this deck
74
True or False: The larger the p-value, the more likely you are to reject the null hypothesis.
Unlock Deck
Unlock for access to all 133 flashcards in this deck.
Unlock Deck
k this deck
75
True or False: A sample is used to obtain a 95% confidence interval for the mean of a population.
The confidence interval goes from 15 to 19.If the same sample had been used to test the null
hypothesis that the mean of the population is equal to 18 versus the alternative hypothesis that the
mean of the population differs from 18, the null hypothesis could be rejected at a level of
significance of 0.05.
Unlock Deck
Unlock for access to all 133 flashcards in this deck.
Unlock Deck
k this deck
76
True or False: A sample is used to obtain a 95% confidence interval for the mean of a population.
The confidence interval goes from 15 to 19.If the same sample had been used to test the null
hypothesis that the mean of the population is equal to 20 versus the alternative hypothesis that the
mean of the population differs from 20, the null hypothesis could be rejected at a level of
significance of 0.02.
Unlock Deck
Unlock for access to all 133 flashcards in this deck.
Unlock Deck
k this deck
77
SCENARIO 9-1
Microsoft Excel was used on a set of data involving the number of defective items found in a random
sample of 46 cases of light bulbs produced during a morning shift at a plant.A manager wants to
know if the mean number of defective bulbs per case is greater than 20 during the morning shift.She
will make her decision using a test with a level of significance of 0.10.The following information
was extracted from the Microsoft Excel output for the sample of 46 cases:
True or False: Referring to Scenario 9-1, the manager can conclude that there is sufficient
evidence to show that the mean number of defective bulbs per case is greater than 20 during the
morning shift using a level of significance of 0.10.
Unlock Deck
Unlock for access to all 133 flashcards in this deck.
Unlock Deck
k this deck
78
True or False: A proper methodology in performing hypothesis tests is to ask whether a random
sample can be selected from the population of interest.
sample can be selected from the population of interest.
Unlock Deck
Unlock for access to all 133 flashcards in this deck.
Unlock Deck
k this deck
79
True or False: The test statistic measures how close the computed sample statistic has come to the
hypothesized population parameter.
hypothesized population parameter.
Unlock Deck
Unlock for access to all 133 flashcards in this deck.
Unlock Deck
k this deck
80
True or False: A sample is used to obtain a 95% confidence interval for the mean of a population.
The confidence interval goes from 15 to 19.If the same sample had been used to test the null
hypothesis that the mean of the population is equal to 20 versus the alternative hypothesis that the
mean of the population differs from 20, the null hypothesis could be accepted at a level of
significance of 0.01.
Unlock Deck
Unlock for access to all 133 flashcards in this deck.
Unlock Deck
k this deck
Unlock Deck
Unlock for access to all 133 flashcards in this deck.


