Deck 11: Chi-Square and Analysis of Variance
Full screen (f)
Question
Question
Question
Question
Question
Question
Question
Question
Question
Question
Question
Question
Question
Question
Question
Question
Question
Question
Question
Question
Question
Question
Question
Question
Question
Question
Question
You roll a die 48 times with the following results. 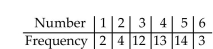 Use a significance level of 0.05 to test the claim that the die is fair.
Use a significance level of 0.05 to test the claim that the die is fair. Question
Question
Question
Question
Question
Question
Question
Question
Question
Question
Question
Question
Question
Question
Question
Question
Question
An observed frequency distribution is as follows: 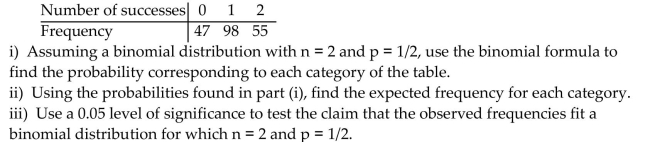
Question
Question
Question
Question
An observed frequency distribution of exam scores is as follows: 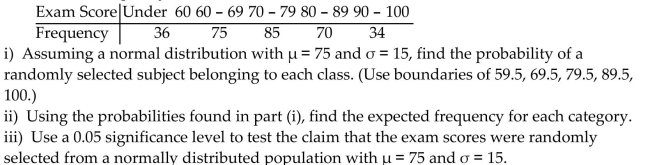
Question
Question
Question
Question
Question
Question
Question
Question
Question
Question
Question
Question
Question
Question
Question
Question
Question

Unlock Deck
Sign up to unlock the cards in this deck!
Unlock Deck
Unlock Deck
1/65
Play
Full screen (f)
Deck 11: Chi-Square and Analysis of Variance
1
Test the claim that the samples come from populations with the same mean. Assume that the populations are normally distributed with the same variance.
-Given the sample data below, test the claim that the populations have the same mean. Use a significance level of 0.05.
-Given the sample data below, test the claim that the populations have the same mean. Use a significance level of 0.05.
Test statistic: . Critical value: .
Reject the claim of equal means. The different brands do not appear to have the same mean.
Reject the claim of equal means. The different brands do not appear to have the same mean.
2
The test statistic . Describe variance within samples and variance between samples. What relationship between variance within samples and variance between samples would result in the conclusion that the value of F is significant?
Variance between samples measures the variation between the sample means, that is the variation due to the treatment. The variance within the samples depends solely on the sample variances and is a measure of pooled variation. The F ratio compares the two. If the F ratio is relatively close to 1, the two variances are about the same, and we conclude that there are no significant differences among the sample means. When the value of F is excessively large (that is, greater than 1), we conclude that the variation among the samples is not the same and that the means are not equal.
3
A researcher wishes to test the effectiveness of a flu vaccination. 150 people are vaccinated, 180 people are vaccinated with a placebo, and 100 people are not vaccinated. The number in each group who later caught the flu was recorded. The results are shown below.
Use a 0.05 significance level to test the claim that the proportion of people catching the flu is the same in all three groups.
Use a 0.05 significance level to test the claim that the proportion of people catching the flu is the same in all three groups.
: The proportion of people catching the flu is the same in all three groups.
: The proportions are different.
Test statistic: . Critical value: .
Reject the null hypothesis. There is sufficient evidence to warrant rejection of the claim that the proportion of people catching the flu is the same in all three groups.
: The proportions are different.
Test statistic: . Critical value: .
Reject the null hypothesis. There is sufficient evidence to warrant rejection of the claim that the proportion of people catching the flu is the same in all three groups.
4
Test the claim that the samples come from populations with the same mean. Assume that the populations are normally distributed with the same variance.
-A consumer magazine wants to compare the lifetimes of ballpoint pens of three different types. The magazine takes a random sample of pens of each type in the following table.
Do the data indicate that there is a difference in mean lifetime for the three brands of ballpoint pens?
-A consumer magazine wants to compare the lifetimes of ballpoint pens of three different types. The magazine takes a random sample of pens of each type in the following table.
Do the data indicate that there is a difference in mean lifetime for the three brands of ballpoint pens?
Unlock Deck
Unlock for access to all 65 flashcards in this deck.
Unlock Deck
k this deck
5
Define categorical data and give an example.
Unlock Deck
Unlock for access to all 65 flashcards in this deck.
Unlock Deck
k this deck
6
Use a X² test to test the claim that in the given contingency table, the row variable and the column variable are independent.
-The table below shows the age and favorite type of music of 668 randomly selected people.
Use a 5 percent level of significance to test the null hypothesis that age and preferred music type are independent.
-The table below shows the age and favorite type of music of 668 randomly selected people.
Use a 5 percent level of significance to test the null hypothesis that age and preferred music type are independent.
Unlock Deck
Unlock for access to all 65 flashcards in this deck.
Unlock Deck
k this deck
7
The following table shows the number of employees who called in sick at a business for different days of a particular week.
i) At the 0.05 level of significance, test the claim that sick days occur with equal frequency on the different days of the week.
ii) Test the claim after changing the frequency for Saturday to 152. Describe the effect of this outlier on the test.
i) At the 0.05 level of significance, test the claim that sick days occur with equal frequency on the different days of the week.
ii) Test the claim after changing the frequency for Saturday to 152. Describe the effect of this outlier on the test.
Unlock Deck
Unlock for access to all 65 flashcards in this deck.
Unlock Deck
k this deck
8
Use the data given below to verify that the t test for independent samples and the ANOVA method are equivalent.
i) Use a t test with a 0.05 significance level to test the claim that the two samples come from populations with the same means.
ii) Use the ANOVA method with a 0.05 significance level to test the same claim.
iii) Verify that the squares of the t test statistic and the critical value are equal to the F test statistic and critical value.
Unlock Deck
Unlock for access to all 65 flashcards in this deck.
Unlock Deck
k this deck
9
At the 0.025 significance level, test the claim that the four brands have the same mean if the following sample results have been obtained.
Unlock Deck
Unlock for access to all 65 flashcards in this deck.
Unlock Deck
k this deck
10
According to Benford's Law, a variety of different data sets include numbers with leading (first) digits that follow the distribution shown in the table below. Test for goodness-of-fit with Benford's Law.
-When working for the Brooklyn District Attorney, investigator Robert Burton analyzed the leading digits of the amounts from 784 checks issued by seven suspect companies. The frequencies were found to be 0, 9, 0, 70, 485, 189, 8, 23, and 0, and those digits correspond to the leading digits of 1, 2, 3, 4, 5, 6, 7, 8, and 9, respectively. If the observed frequencies are substantially different from the frequencies expected with Benford's Law, the check amounts appear to result from fraud. Use a 0.05 significance level to test for goodness-of-fit with Benford's Law. Does it appear that the checks are the result of fraud?
-When working for the Brooklyn District Attorney, investigator Robert Burton analyzed the leading digits of the amounts from 784 checks issued by seven suspect companies. The frequencies were found to be 0, 9, 0, 70, 485, 189, 8, 23, and 0, and those digits correspond to the leading digits of 1, 2, 3, 4, 5, 6, 7, 8, and 9, respectively. If the observed frequencies are substantially different from the frequencies expected with Benford's Law, the check amounts appear to result from fraud. Use a 0.05 significance level to test for goodness-of-fit with Benford's Law. Does it appear that the checks are the result of fraud?
Unlock Deck
Unlock for access to all 65 flashcards in this deck.
Unlock Deck
k this deck
11
A researcher wishes to test whether the proportion of college students who smoke is the same in four different colleges. She randomly selects 100 students from each college and records the number that smoke. The results are shown below.
Use a 0.01 significance level to test the claim that the proportion of students smoking is the same at all four colleges.
Use a 0.01 significance level to test the claim that the proportion of students smoking is the same at all four colleges.
Unlock Deck
Unlock for access to all 65 flashcards in this deck.
Unlock Deck
k this deck
12
Four independent samples of 100 values each are randomly drawn from populations that are normally distributed with equal variances. You wish to test the claim that
i) If you test the individual claims , how many ways can you pair off the 4 means?
ii) Assume that the tests are independent and that for each test of equality between two means, there is a probability of not making a type I error. If all possible pairs of means are tested for equality, what is the probability of making no type I errors?
iii) If you use analysis of variance to test the claim that at the level of significance, what is the probability of not making a type I error?
Unlock Deck
Unlock for access to all 65 flashcards in this deck.
Unlock Deck
k this deck
13
Use a significance level of 0.01 to test the claim that workplace accidents are distributed on workdays as follows: Monday 25%, Tuesday: 15%, Wednesday: 15%, Thursday: 15%, and Friday: 30%.
In a study of 100 workplace accidents, 26 occurred on a Monday, 15 occurred on a Tuesday, 17 occurred on a Wednesday, 17 occurred on a Thursday, and 25 occurred on a Friday.
In a study of 100 workplace accidents, 26 occurred on a Monday, 15 occurred on a Tuesday, 17 occurred on a Wednesday, 17 occurred on a Thursday, and 25 occurred on a Friday.
Unlock Deck
Unlock for access to all 65 flashcards in this deck.
Unlock Deck
k this deck
14
Test the claim that the samples come from populations with the same mean. Assume that the populations are normally distributed with the same variance.
-The data below represent the weight losses for people on three different exercise programs.
At the 1% significance level, does it appear that a difference exists in the true mean weight loss produced by the three exercise programs?
-The data below represent the weight losses for people on three different exercise programs.
At the 1% significance level, does it appear that a difference exists in the true mean weight loss produced by the three exercise programs?
Unlock Deck
Unlock for access to all 65 flashcards in this deck.
Unlock Deck
k this deck
15
Suppose you are to test for equality of four different population means, with H0: µA = µB . Write the hypotheses for the paired tests. Use methods of probability to explain why the process of ANOVA has a higher degree of confidence than testing each of the pairs separately.
Unlock Deck
Unlock for access to all 65 flashcards in this deck.
Unlock Deck
k this deck
16
An observed frequency distribution of exam scores is as follows:
i) Assuming a normal distribution with and , find the probability of a randomly selected subject belonging to each class. (Use boundaries of , 100.)
ii) Using the probabilities found in part (i), find the expected frequency for each category.
iii) Use a significance level to test the claim that the exam scores were randomly selected from a normally distributed population with and .
Unlock Deck
Unlock for access to all 65 flashcards in this deck.
Unlock Deck
k this deck
17
A survey conducted in a small business yielded the results shown in the table. i) Test the claim that health care coverage is independent of gender. Use a 0.05
significance level.
ii) Using Yates' correction, replace and repeat the test.
What effect does Yates' correction have on the value of the test statistic?
significance level.
ii) Using Yates' correction, replace and repeat the test.
What effect does Yates' correction have on the value of the test statistic?
Unlock Deck
Unlock for access to all 65 flashcards in this deck.
Unlock Deck
k this deck
18
Use a test to test the claim that in the given contingency table, the row variable and the column variable are independent.
-Responses to a survey question are broken down according to employment status and the sample results are given below. At the 0.10 significance level, test the claim that response and employment status are independent.
-Responses to a survey question are broken down according to employment status and the sample results are given below. At the 0.10 significance level, test the claim that response and employment status are independent.
Unlock Deck
Unlock for access to all 65 flashcards in this deck.
Unlock Deck
k this deck
19
Test the claim that the samples come from populations with the same mean. Assume that the populations are normally distributed with the same variance.
-At the 0.025 significance level, test the claim that the three brands have the same mean if the following sample results have been obtained.
-At the 0.025 significance level, test the claim that the three brands have the same mean if the following sample results have been obtained.
Unlock Deck
Unlock for access to all 65 flashcards in this deck.
Unlock Deck
k this deck
20
Use a test to test the claim that in the given contingency table, the row variable and the column variable are independent.
-Use the sample data below to test whether car color affects the likelihood of being in an accident. Use a significance level of 0.01.
-Use the sample data below to test whether car color affects the likelihood of being in an accident. Use a significance level of 0.01.
Unlock Deck
Unlock for access to all 65 flashcards in this deck.
Unlock Deck
k this deck
21
Describe the null hypothesis for the test of independence. List the assumptions for the X² test of independence. What is the major difference between the assumptions for this test and the assumptions for the previous tests we have studied?
Unlock Deck
Unlock for access to all 65 flashcards in this deck.
Unlock Deck
k this deck
22
When using statistical software packages, the critical value is typically not given. What method is used to determine whether you reject or fail to reject the null hypothesis?
Unlock Deck
Unlock for access to all 65 flashcards in this deck.
Unlock Deck
k this deck
23
At a high school debate tournament, half of the teams were asked to wear suits and ties and the rest were asked to wear jeans and t-shirts. The results are given in the table below.
Test the hypothesis at the 0.05 level that the proportion of wins is the same for teams wearing suits as for teams wearing jeans.
Test the hypothesis at the 0.05 level that the proportion of wins is the same for teams wearing suits as for teams wearing jeans.
Unlock Deck
Unlock for access to all 65 flashcards in this deck.
Unlock Deck
k this deck
24
Test the claim that the samples come from populations with the same mean. Assume that the populations are normally distributed with the same variance.
-At the 0.025 significance level, test the claim that the four brands have the same mean if the following sample results have been obtained.
-At the 0.025 significance level, test the claim that the four brands have the same mean if the following sample results have been obtained.
Unlock Deck
Unlock for access to all 65 flashcards in this deck.
Unlock Deck
k this deck
25
Using the data below and a 0.05 significance level, test the claim that the responses occur with percentages of 15%, 20%, 25%, 25%, and 15% respectively.
Unlock Deck
Unlock for access to all 65 flashcards in this deck.
Unlock Deck
k this deck
26
Explain the computation of expected values for contingency tables in terms of
probabilities. Refer to the assumptions of the null hypothesis as part of your explanation.
You might give a brief example to illustrate.
probabilities. Refer to the assumptions of the null hypothesis as part of your explanation.
You might give a brief example to illustrate.
Unlock Deck
Unlock for access to all 65 flashcards in this deck.
Unlock Deck
k this deck
27
You roll a die 48 times with the following results. Use a significance level of 0.05 to test the claim that the die is fair.
Use a significance level of 0.05 to test the claim that the die is fair. Unlock Deck
Unlock for access to all 65 flashcards in this deck.
Unlock Deck
k this deck
28
A survey conducted in a small town yielded the results shown in the table.
i) Test the claim that the intention to vote in the next presidential election is independent of the gender of the person being surveyed. Use a 0.05 significance level.
ii) Using Yates' correction, replace and repeat the test.
What effect does Yates' correction have on the value of the test statistic?
Unlock Deck
Unlock for access to all 65 flashcards in this deck.
Unlock Deck
k this deck
29
Among the four northwestern states, Washington has 51% of the total population, Oregon has 30%, Idaho has 11%, and Montana has 8%. A market researcher selects a sample of 1000 subjects, with 450 in Washington, 340 in Oregon, 150 in Idaho, and 60 in Montana. At the 0.05 significance level, test the claim that the sample of 1000 subjects has a distribution that agrees with the distribution of state populations.
Unlock Deck
Unlock for access to all 65 flashcards in this deck.
Unlock Deck
k this deck
30
Describe the null and alternative hypotheses for one-way ANOVA. Give an example.
Unlock Deck
Unlock for access to all 65 flashcards in this deck.
Unlock Deck
k this deck
31
A survey conducted in a small business yielded the results shown in the table. i) Test the claim that health care coverage is independent of gender. Use a 0.05
significance level.
ii) Using Yates' correction, replace and repeat the test.
What effect does Yates' correction have on the value of the test statistic?
significance level.
ii) Using Yates' correction, replace and repeat the test.
What effect does Yates' correction have on the value of the test statistic?
Unlock Deck
Unlock for access to all 65 flashcards in this deck.
Unlock Deck
k this deck
32
Use a 0.01 significance level to test the claim that the proportion of men who plan to vote in the next election is the same as the proportion of women who plan to vote. 300 men and 300 women were randomly selected and asked whether they planned to vote in the next election. The results are shown below.
Unlock Deck
Unlock for access to all 65 flashcards in this deck.
Unlock Deck
k this deck
33
In studying the occurrence of genetic characteristics, the following sample data were obtained. At the 0.05 significance level, test the claim that the characteristics occur with the same frequency.
Unlock Deck
Unlock for access to all 65 flashcards in this deck.
Unlock Deck
k this deck
34
Define the term "treatment". What other term means the same thing? Give an example.
Unlock Deck
Unlock for access to all 65 flashcards in this deck.
Unlock Deck
k this deck
35
Draw an example of an F distribution and list the characteristics of the F distribution.
Unlock Deck
Unlock for access to all 65 flashcards in this deck.
Unlock Deck
k this deck
36
Use a test to test the claim that in the given contingency table, the row variable and the column variable are independent.
-Responses to a survey question are broken down according to gender and the sample results are given below. At the 0.05 significance level, test the claim that response and gender are independent.
-Responses to a survey question are broken down according to gender and the sample results are given below. At the 0.05 significance level, test the claim that response and gender are independent.
Unlock Deck
Unlock for access to all 65 flashcards in this deck.
Unlock Deck
k this deck
37
Use a test to test the claim that in the given contingency table, the row variable and the column variable are independent.
-160 students who were majoring in either math or English were asked a test question, and the researcher recorded whether they answered the question correctly. The sample results are given below. At the 0.10 significance level, test the claim that response and major are independent.
-160 students who were majoring in either math or English were asked a test question, and the researcher recorded whether they answered the question correctly. The sample results are given below. At the 0.10 significance level, test the claim that response and major are independent.
Unlock Deck
Unlock for access to all 65 flashcards in this deck.
Unlock Deck
k this deck
38
Describe the test of homogeneity. What characteristic distinguishes a test of homogeneity from a test of independence?
Unlock Deck
Unlock for access to all 65 flashcards in this deck.
Unlock Deck
k this deck
39
Use the data given below to verify that the t test for independent samples and the ANOVA method are equivalent.
i) Use a t test with a 0.05 significance level to test the claim that the two samples come from populations with the same means.
ii) Use the ANOVA method with a 0.05 significance level to test the same claim.
iii) Verify that the squares of the t test statistic and the critical value are equal to the F test statistic and critical value.
i) Use a t test with a 0.05 significance level to test the claim that the two samples come from populations with the same means.
ii) Use the ANOVA method with a 0.05 significance level to test the same claim.
iii) Verify that the squares of the t test statistic and the critical value are equal to the F test statistic and critical value.
Unlock Deck
Unlock for access to all 65 flashcards in this deck.
Unlock Deck
k this deck
40
At the same time each day, a researcher records the temperature in each of three greenhouses. The table shows the temperatures in degrees Fahrenheit recorded for one week.
i) Use a 0.05 significance level to test the claim that the average temperature is the same in each greenhouse.
ii) How are the analysis of variance results affected if the same constant is added to every one of the original sample values?
i) Use a 0.05 significance level to test the claim that the average temperature is the same in each greenhouse.
ii) How are the analysis of variance results affected if the same constant is added to every one of the original sample values?
Unlock Deck
Unlock for access to all 65 flashcards in this deck.
Unlock Deck
k this deck
41
What can you conclude about the equality of the population means?
A) Accept the null hypothesis since the p-value is greater than the significance level.
B) Reject the null hypothesis since the p-value is less than the significance level.
C) Reject the null hypothesis since the p-value is greater than the significance level.
D) Accept the null hypothesis since the p-value is less than the significance level.
Unlock Deck
Unlock for access to all 65 flashcards in this deck.
Unlock Deck
k this deck
42
In studying the responses to a multiple-choice test question, the following sample data were obtained. At the 0.05 significance level, test the claim that the responses occur with the same frequency.
Unlock Deck
Unlock for access to all 65 flashcards in this deck.
Unlock Deck
k this deck
43
An observed frequency distribution is as follows:
i) Assuming a binomial distribution with and , use the binomial formula to find the probability corresponding to each category of the table.
ii) Using the probabilities found in part (i), find the expected frequency for each category.
iii) Use a level of significance to test the claim that the observed frequencies fit a binomial distribution for which and .
Unlock Deck
Unlock for access to all 65 flashcards in this deck.
Unlock Deck
k this deck
44
An observed frequency distribution is as follows:
Unlock Deck
Unlock for access to all 65 flashcards in this deck.
Unlock Deck
k this deck
45
Find the critical value.
A) 4.07
B) 8.85
C) 7.59
D) 1.6
A) 4.07
B) 8.85
C) 7.59
D) 1.6
Unlock Deck
Unlock for access to all 65 flashcards in this deck.
Unlock Deck
k this deck
46
Test the claim that the samples come from populations with the same mean. Assume that the populations are normally distributed with the same variance.
-Random samples of four different models of cars were selected and the gas mileage of each car was measured. The results are shown below.
Test the claim that the four different models have the same population mean. Use a significance level of 0.05.
-Random samples of four different models of cars were selected and the gas mileage of each car was measured. The results are shown below.
Test the claim that the four different models have the same population mean. Use a significance level of 0.05.
Unlock Deck
Unlock for access to all 65 flashcards in this deck.
Unlock Deck
k this deck
47
According to Benford's Law, a variety of different data sets include numbers with leading (first) digits that follow the distribution shown in the table below. Test for goodness-of-fit with Benford's Law.
-When working for the Brooklyn District Attorney, investigator Robert Burton analyzed the leading digits of the amounts from 784 checks issued by seven suspect companies. The frequencies were found to be 0, 18, 0, 79, 476, 180, 8, 23, and 0, and those digits correspond to the leading digits of 1, 2, 3, 4, 5, 6, 7, 8, and 9, respectively. If the observed frequencies are substantially different from the frequencies expected with Benford's Law, the check amounts appear to result from fraud. Use a 0.05 significance level to test for goodness-of-fit with Benford's Law. Does it appear that the checks are the result of fraud?
-When working for the Brooklyn District Attorney, investigator Robert Burton analyzed the leading digits of the amounts from 784 checks issued by seven suspect companies. The frequencies were found to be 0, 18, 0, 79, 476, 180, 8, 23, and 0, and those digits correspond to the leading digits of 1, 2, 3, 4, 5, 6, 7, 8, and 9, respectively. If the observed frequencies are substantially different from the frequencies expected with Benford's Law, the check amounts appear to result from fraud. Use a 0.05 significance level to test for goodness-of-fit with Benford's Law. Does it appear that the checks are the result of fraud?
Unlock Deck
Unlock for access to all 65 flashcards in this deck.
Unlock Deck
k this deck
48
An observed frequency distribution of exam scores is as follows:
Unlock Deck
Unlock for access to all 65 flashcards in this deck.
Unlock Deck
k this deck
49
At the same time each day, a researcher records the temperature in each of three greenhouses. The table shows the temperatures in degrees Fahrenheit recorded for one week.
i) Use a 0.05 significance level to test the claim that the average temperature is the same in each greenhouse.
ii) How are the analysis of variance results affected if 8° is added to each temperature listed for greenhouse #3?
i) Use a 0.05 significance level to test the claim that the average temperature is the same in each greenhouse.
ii) How are the analysis of variance results affected if 8° is added to each temperature listed for greenhouse #3?
Unlock Deck
Unlock for access to all 65 flashcards in this deck.
Unlock Deck
k this deck
50
According to Benford's Law, a variety of different data sets include numbers with leading (first) digits that follow the distribution shown in the table below. Test for goodness-of-fit with Benford's Law.
-When working for the Brooklyn District Attorney, investigator Robert Burton analyzed the leading digits of the amounts from 784 checks issued by seven suspect companies. The frequencies were found to be 0, 12, 0, 73, 482, 186, 8, 23, and 0, and those digits correspond to the leading digits of 1, 2, 3, 4, 5, 6, 7, 8, and 9, respectively. If the observed frequencies are substantially different from the frequencies expected with Benford's Law, the check amounts appear to result from fraud. Use a 0.05 significance level to test for goodness-of-fit with Benford's Law. Does it appear that the checks are the result of fraud?
-When working for the Brooklyn District Attorney, investigator Robert Burton analyzed the leading digits of the amounts from 784 checks issued by seven suspect companies. The frequencies were found to be 0, 12, 0, 73, 482, 186, 8, 23, and 0, and those digits correspond to the leading digits of 1, 2, 3, 4, 5, 6, 7, 8, and 9, respectively. If the observed frequencies are substantially different from the frequencies expected with Benford's Law, the check amounts appear to result from fraud. Use a 0.05 significance level to test for goodness-of-fit with Benford's Law. Does it appear that the checks are the result of fraud?
Unlock Deck
Unlock for access to all 65 flashcards in this deck.
Unlock Deck
k this deck
51
A company manager wishes to test a union leader's claim that absences occur on the different week days with the same frequencies. Test this claim at the 0.05 level of significance if the following sample data have been compiled.
Unlock Deck
Unlock for access to all 65 flashcards in this deck.
Unlock Deck
k this deck
52
Six independent samples of 100 values each are randomly drawn from populations that are normally distributed with equal variances. You wish to test the claim that
i) If you test the individual claims , how many ways can you pair off the 6 means?
ii) Assume that the tests are independent and that for each test of equality between two means, there is a probability of not making a type I error. If all possible pairs of means are tested for equality, what is the probability of making no type I errors?
iii) If you use analysis of variance to test the claim that at the level of significance, what is the probability of not making a type I error?
Unlock Deck
Unlock for access to all 65 flashcards in this deck.
Unlock Deck
k this deck
53
Given below are the analysis of variance results from a Minitab display. Assume that you want to use a 0.05 significance level in testing the null hypothesis that the different samples come from populations with the same mean.
-What can you conclude about the equality of the population means?
A) Accept the null hypothesis since the p-value is less than the significance level.
B) Reject the null hypothesis since the p-value is less than the significance level.
C) Accept the null hypothesis since the p-value is greater than the significance level.
D) Reject the null hypothesis since the p-value is greater than the significance level.
Unlock Deck
Unlock for access to all 65 flashcards in this deck.
Unlock Deck
k this deck
54
Given below are the analysis of variance results from a Minitab display. Assume that you want to use a 0.05 significance level in testing the null hypothesis that the different samples come from populations with the same mean.
-Identify the p-value.
A) 5.17
B) 0.011
C) 4.500
D) 0.870
-Identify the p-value.
A) 5.17
B) 0.011
C) 4.500
D) 0.870
Unlock Deck
Unlock for access to all 65 flashcards in this deck.
Unlock Deck
k this deck
55
Fill in the missing entries in the following partially completed one-way ANOVA table.
A)
B)
C)
D)
A)
B)
C)
D)
Unlock Deck
Unlock for access to all 65 flashcards in this deck.
Unlock Deck
k this deck
56
Use a test to test the claim that in the given contingency table, the row variable and the column variable are independent.
-Tests for adverse reactions to a new drug yielded the results given in the table. At the 0.05 significance level, test the claim that the treatment (drug or placebo) is independent of the reaction (whether or not headaches were experienced).
-Tests for adverse reactions to a new drug yielded the results given in the table. At the 0.05 significance level, test the claim that the treatment (drug or placebo) is independent of the reaction (whether or not headaches were experienced).
Unlock Deck
Unlock for access to all 65 flashcards in this deck.
Unlock Deck
k this deck
57
Describe a goodness-of-fit test. What assumptions are made when using a goodness-of-fit test?
Unlock Deck
Unlock for access to all 65 flashcards in this deck.
Unlock Deck
k this deck
58
List the assumptions for testing hypotheses that three or more means are equivalent.
Unlock Deck
Unlock for access to all 65 flashcards in this deck.
Unlock Deck
k this deck
59
Test the claim that the samples come from populations with the same mean. Assume that the populations are normally distributed with the same variance.
-Given the sample data below, test the claim that the populations have the same mean. Use a significance level of 0.05.
-Given the sample data below, test the claim that the populations have the same mean. Use a significance level of 0.05.
Unlock Deck
Unlock for access to all 65 flashcards in this deck.
Unlock Deck
k this deck
60
In the chi-square test of independence, the formula used is . Discuss the meaning of and and explain the circumstances under which the values will be smaller or larger. What is the relationship between a significant value and the values of O and E?
Unlock Deck
Unlock for access to all 65 flashcards in this deck.
Unlock Deck
k this deck
61
Find the critical value.
A) 3.06
B) 8.70
C) 3.24
D) 5.42
A) 3.06
B) 8.70
C) 3.24
D) 5.42
Unlock Deck
Unlock for access to all 65 flashcards in this deck.
Unlock Deck
k this deck
62
Given below are the analysis of variance results from a Minitab display. Assume that you want to use a 0.05 significance level in testing the null hypothesis that the different samples come from populations with the same mean.
-Identify the value of the test statistic.
A) 5.17
B) 13.500
C) 4.500
D) 0.011
-Identify the value of the test statistic.
A) 5.17
B) 13.500
C) 4.500
D) 0.011
Unlock Deck
Unlock for access to all 65 flashcards in this deck.
Unlock Deck
k this deck
63
Identify the p-value.
A) 0.264
B) 1.6
C) 10.00
D) 6.25
A) 0.264
B) 1.6
C) 10.00
D) 6.25
Unlock Deck
Unlock for access to all 65 flashcards in this deck.
Unlock Deck
k this deck
64
Identify the value of the test statistic.
A) 0.264
B) 1.6
C) 30
D) 10.00
A) 0.264
B) 1.6
C) 30
D) 10.00
Unlock Deck
Unlock for access to all 65 flashcards in this deck.
Unlock Deck
k this deck
65
Fill in the missing entries in the following partially completed one-way ANOVA table.
A)
B)
C)
D)
A)
B)
C)
D)
Unlock Deck
Unlock for access to all 65 flashcards in this deck.
Unlock Deck
k this deck
Unlock Deck
Unlock for access to all 65 flashcards in this deck.


