Deck 2: Describing Motion: Kinematics in One Dimension
Full screen (f)
Question
Question
Question
Question
Question
Question
Question
Question
Question
Question
Question
Question
Question
Question
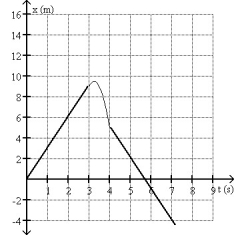
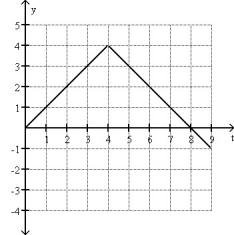
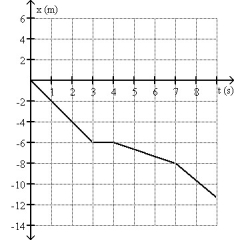
FIGURE 2-1 
Fig. 2-1 shows the position of an object as a function of time. During which time interval is the object at rest between 0.0 s and 9.0 s?
A)The object is at rest between 6.0 s and 9.0 s.
B)The object is always at rest except at the instants t = 3.0 s and t = 6.0 s.
C)The object is at rest between 0.0 s and 3.0 s.
D)The object is at rest between 3.0 s and 6.0 s.
E)The object is never at rest.
Question
Question
Question
Question
Question
Question
Question
Question
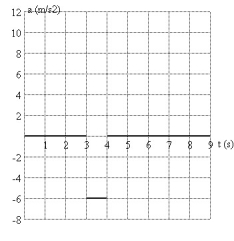
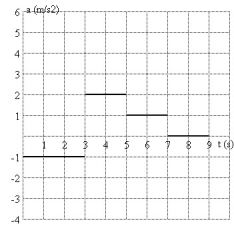
FIGURE 2-3 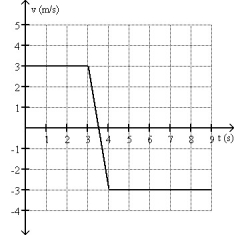
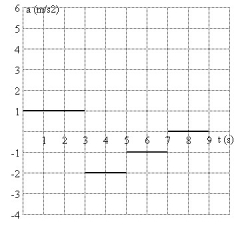
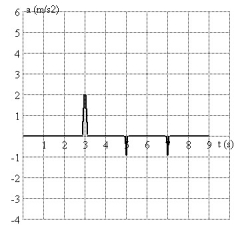
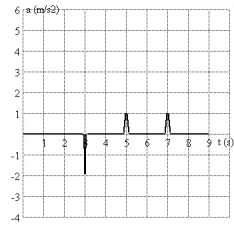
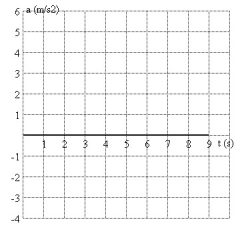
Fig. 2-3 shows the velocity of an object as a function of time. Which graph best represents the acceleration as a function of time?
A)
B)
C)
D)
E)none of the above
Fig. 2-3 shows the velocity of an object as a function of time. Which graph best represents the acceleration as a function of time?
A)
B)
C)
D)
E)none of the above
Question
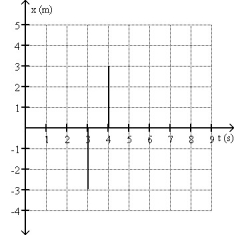
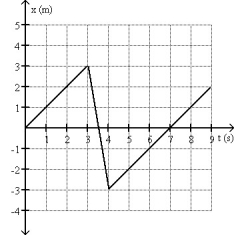
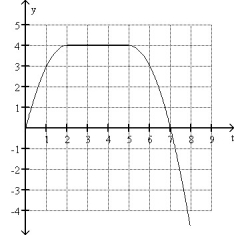
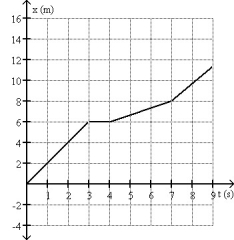
FIGURE 2-4 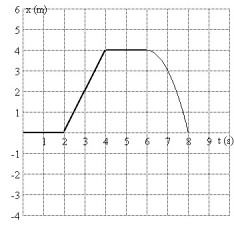
A graph of position as a function of time is shown in Fig. 2-4. During which time interval could the object be possibly moving with non-zero constant acceleration?
A)0.1 s to 1.9 s
B)4.1 s to 5.9 s
C)2.1 s to 3.9 s
D)6.1 s to 7.9 s
E)There is no interval that is consistent with constant non-zero acceleration.
Question
Question
Question
Question
Question
Question
Question
Question
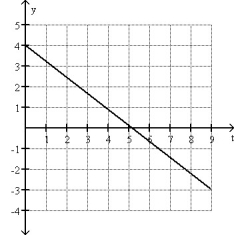
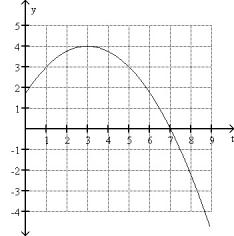
FIGURE 2-2 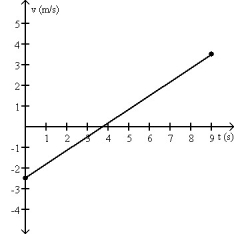
The motion of a particle is described in the velocity vs. time graph shown in Fig. 2-2. We can say that its speed
A)increases.
B)decreases.
C)increases and then decreases.
D)decreases and then increases.
E)remains constant.
The motion of a particle is described in the velocity vs. time graph shown in Fig. 2-2. We can say that its speed
A)increases.
B)decreases.
C)increases and then decreases.
D)decreases and then increases.
E)remains constant.
Question
Question
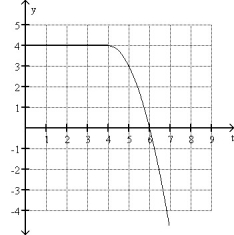
FIGURE 2-5 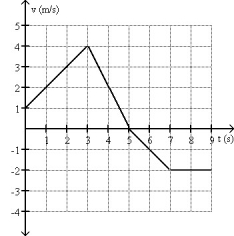
A plot of position as a function of time is shown in Fig. 2-5. Which graph represents the acceleration as a function of time?
A)
B)
C)
D)
E)
A plot of position as a function of time is shown in Fig. 2-5. Which graph represents the acceleration as a function of time?
A)
B)
C)
D)
E)
Question
Question
Question
Question
Question
Question
Question
Question
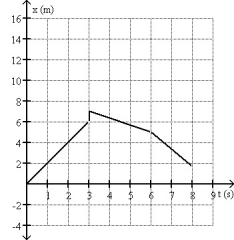
FIGURE 2-6 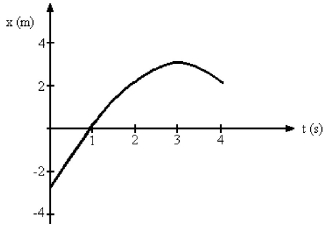
Fig. 2-6 represents the position of a particle as it travels along the x-axis. What is the average velocity of the particle between t = 2 s and t = 4 s?
Fig. 2-6 represents the position of a particle as it travels along the x-axis. What is the average velocity of the particle between t = 2 s and t = 4 s?
Question
Question
FIGURE 2-6
Fig. 2-6 represents the position of a particle as it travels along the x-axis. What is the average speed of the particle between t = 0 s and t = 3 s?
Fig. 2-6 represents the position of a particle as it travels along the x-axis. What is the average speed of the particle between t = 0 s and t = 3 s?
Question
Question
FIGURE 2-6
Fig. 2-6 represents the position of a particle as it travels along the x-axis. What is the magnitude of the instantaneous velocity of the particle when t = 1 s?
Fig. 2-6 represents the position of a particle as it travels along the x-axis. What is the magnitude of the instantaneous velocity of the particle when t = 1 s?
Question
Question
Question
Question
Question
Question
Which of the following graphs could possibly represent the motion as a function of time of an object in free fall?
A)
B)
C)
D)
E)
A)
B)
C)
D)
E)
Question
FIGURE 2-6
Fig. 2-6 represents the position of a particle as it travels along the x-axis. What is the average speed of the particle between t = 2 s and t = 4 s?
Fig. 2-6 represents the position of a particle as it travels along the x-axis. What is the average speed of the particle between t = 2 s and t = 4 s?
Question
FIGURE 2-6
Fig. 2-6 represents the position of a particle as it travels along the x-axis. What is the average velocity of the particle between t = 0 s and t = 3 s?
Fig. 2-6 represents the position of a particle as it travels along the x-axis. What is the average velocity of the particle between t = 0 s and t = 3 s?
Question
Question
Question
Question
Question
Question
Question
Which graph below could represent the motion of the object described in the following sentences? The object that starts its motion with a constant velocity of 2.0 m/s east. After 3.0 s, the object stops for 1.0 s. The object then moves toward the west a distance of 2.0 m in 3.0 s. The object continues traveling in the same direction, but increases its speed by 1.0 m/s for the next 2.0 s.
A)
B)
C)
D)
E)None of the above graphs could represent the motion described.
A)
B)
C)
D)
E)None of the above graphs could represent the motion described.
Question
FIGURE 2-7 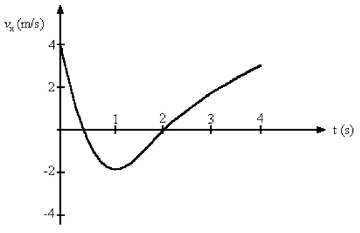
Fig. 2-7 represents the velocity of a particle as it travels along the x-axis. At what value of t is the instantaneous acceleration equal to zero?
Fig. 2-7 represents the velocity of a particle as it travels along the x-axis. At what value of t is the instantaneous acceleration equal to zero?
Question
Question
FIGURE 2-7
Fig. 2-7 represents the velocity of a particle as it travels along the x-axis. What is the average acceleration of the particle between t = 2 s and t = 4 s?
Fig. 2-7 represents the velocity of a particle as it travels along the x-axis. What is the average acceleration of the particle between t = 2 s and t = 4 s?
Question
Question
Question
FIGURE 2-7
Fig. 2-7 represents the velocity of a particle as it travels along the x-axis. In what direction is the acceleration at t = 0.5 s?
Fig. 2-7 represents the velocity of a particle as it travels along the x-axis. In what direction is the acceleration at t = 0.5 s?
Question
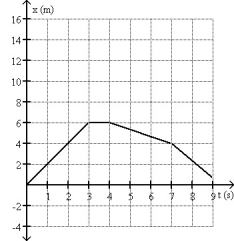
FIGURE 2-10 
Fig. 2-10 shows the position of an object as a function of time. What is the displacement of the object between time and time t = 9.0 s?
A)3.0 m
B)19.5 m
C)5.0 m
D)1.0 m
E)-1.0 m
Fig. 2-10 shows the position of an object as a function of time. What is the displacement of the object between time
and time t = 9.0 s?A)3.0 m
B)19.5 m
C)5.0 m
D)1.0 m
E)-1.0 m
Question
FIGURE 2-10 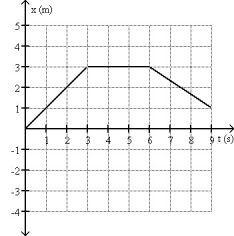
Fig. 2-10 shows the position of an object as a function of time. What is the average speed of the object between time and time t = 9.0 s?
A)0.11 m/s
B)-0.33 m/s
C)0.33 m/s
D)0.56 m/s
E)-0.11 m/s
Fig. 2-10 shows the position of an object as a function of time. What is the average speed of the object between time
and time t = 9.0 s?A)0.11 m/s
B)-0.33 m/s
C)0.33 m/s
D)0.56 m/s
E)-0.11 m/s
Question
FIGURE 2-10
Fig. 2-10 shows the position of an object as a function of time. What is the length of the path the object followed during the time interval from time t = 0.0 s and time t = 9.0 s?
A)-1.0 m
B)3.0 m
C)1.0 m
D)19.5 m
E)5.0 m
Fig. 2-10 shows the position of an object as a function of time. What is the length of the path the object followed during the time interval from time t = 0.0 s and time t = 9.0 s?
A)-1.0 m
B)3.0 m
C)1.0 m
D)19.5 m
E)5.0 m
Question
Question
Question
Question
FIGURE 2-8 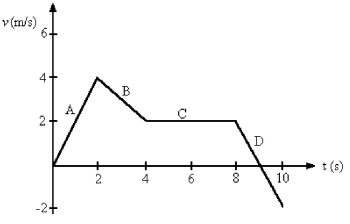
Fig. 2-8 shows the velocity-versus-time graph for a basketball player traveling up and down the court in a straight-line path. Find the displacement of the player for each of the segments A, B, C and D.
Fig. 2-8 shows the velocity-versus-time graph for a basketball player traveling up and down the court in a straight-line path. Find the displacement of the player for each of the segments A, B, C and D.
Question
Question
Question
FIGURE 2-9 
Refer to Fig. 2-9. If you start from the Bakery, travel to the Cafe, and then to the Art Gallery, what is the distance you have traveled?
A)6.5 km
B)2.5 km
C)10.5 km
D)0 km
E)1.5 km
Refer to Fig. 2-9. If you start from the Bakery, travel to the Cafe, and then to the Art Gallery, what is the distance you have traveled?
A)6.5 km
B)2.5 km
C)10.5 km
D)0 km
E)1.5 km
Question
FIGURE 2-7
Fig. 2-7 represents the velocity of a particle as it travels along the x-axis. In what direction is the acceleration at t = 3.0 s?
Fig. 2-7 represents the velocity of a particle as it travels along the x-axis. In what direction is the acceleration at t = 3.0 s?
Question
Question
FIGURE 2-9 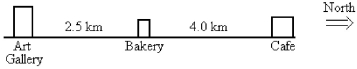
Refer to Fig. 2-9. If you start from the Bakery, travel to the Art Gallery, and then to the Cafe, in 1.0 hour, what is your average speed?
A)6.5 km/hr
B)2.5 km/hr
C)9.0 km/hr
D)10.5 km/hr
E)1.5 km/hr
Refer to Fig. 2-9. If you start from the Bakery, travel to the Art Gallery, and then to the Cafe, in 1.0 hour, what is your average speed?
A)6.5 km/hr
B)2.5 km/hr
C)9.0 km/hr
D)10.5 km/hr
E)1.5 km/hr
Question
FIGURE 2-9
Refer to Fig. 2-9. If you start from the Bakery, travel to the Cafe, and then to the Art Gallery, what is the magnitude of your displacement?
A)6.5 km
B)2.5 km
C)10.5 km
D)9.0 km
E)1.5 km
Refer to Fig. 2-9. If you start from the Bakery, travel to the Cafe, and then to the Art Gallery, what is the magnitude of your displacement?
A)6.5 km
B)2.5 km
C)10.5 km
D)9.0 km
E)1.5 km

Unlock Deck
Sign up to unlock the cards in this deck!
Unlock Deck
Unlock Deck
1/119
Play
Full screen (f)
Deck 2: Describing Motion: Kinematics in One Dimension
1
Which statement is correct about the relationship between the instantaneous speed and the magnitude of the instantaneous velocity?
A)The average speed can be less than, greater than or equal to the magnitude of the average velocity.
B)The instantaneous speed is always equal to the magnitude of the instantaneous velocity.
C)The average speed is always less than or equal to the magnitude of the average velocity.
D)The instantaneous speed is always greater than or equal to the magnitude of the instantaneous velocity.
E)The average speed is always one-half the magnitude of the average velocity.
The instantaneous speed is always equal to the magnitude of the instantaneous velocity.
2
If the position versus time graph of an object is a horizontal line, the object is
A)moving with constant non-zero speed.
B)moving with constant non-zero acceleration.
C)at rest.
D)moving with infinite speed.
E)none of the above
A)moving with constant non-zero speed.
B)moving with constant non-zero acceleration.
C)at rest.
D)moving with infinite speed.
E)none of the above
at rest.
3
When the velocity and acceleration of an object have the same sign, the speed of the object increases.
True
4
Suppose that an object is moving with a constant velocity. Make a statement concerning its acceleration.
A)The acceleration must be constantly increasing.
B)The acceleration must be constantly decreasing.
C)The acceleration must be a constant non-zero value.
D)The acceleration must be equal to zero.
E)A statement cannot be made without additional information.
A)The acceleration must be constantly increasing.
B)The acceleration must be constantly decreasing.
C)The acceleration must be a constant non-zero value.
D)The acceleration must be equal to zero.
E)A statement cannot be made without additional information.
Unlock Deck
Unlock for access to all 119 flashcards in this deck.
Unlock Deck
k this deck
5
Suppose that an object is moving with constant acceleration. Which of the following is an accurate statement concerning its motion?
A)In equal times its speed changes by equal amounts.
B)In equal times its velocity changes by equal amounts.
C)In equal times it moves equal distances.
D)The object is not moving; it is at rest.
E)A statement cannot be made without additional information.
A)In equal times its speed changes by equal amounts.
B)In equal times its velocity changes by equal amounts.
C)In equal times it moves equal distances.
D)The object is not moving; it is at rest.
E)A statement cannot be made without additional information.
Unlock Deck
Unlock for access to all 119 flashcards in this deck.
Unlock Deck
k this deck
6
Suppose that an object travels from one point in space to another. Make a comparison between the displacement and the distance traveled.
A)The displacement is either greater than or equal to the distance traveled.
B)The displacement is always equal to the distance traveled.
C)The displacement is either less than or equal to the distance traveled.
D)The displacement can be either greater than, smaller than, or equal to the distance traveled.
E)If the displacement is equal to zero, then the distance traveled will also equal zero.
Unlock Deck
Unlock for access to all 119 flashcards in this deck.
Unlock Deck
k this deck
7
Which statement below about the distance between the starting and ending positions and the displacement between the starting and ending positions is correct?
A)The distance between the starting and ending positions is twice the magnitude of the displacement between the starting and ending positions.
B)The distance between the starting and ending positions is equal to the magnitude of the displacement between the starting and ending positions.
C)The distance between the starting and ending positions is the negative of the magnitude of the displacement between the starting and ending positions.
D)The distance between the starting and ending positions is greater than the magnitude of the displacement between the starting and ending positions.
E)The distance between the starting and ending positions is less than the magnitude of the displacement between the starting and ending positions.
Unlock Deck
Unlock for access to all 119 flashcards in this deck.
Unlock Deck
k this deck
8
The slope of a tangent line at a given time value on a position versus time graph gives
A)displacement.
B)instantaneous velocity.
C)average velocity.
D)instantaneous acceleration.
E)average acceleration
A)displacement.
B)instantaneous velocity.
C)average velocity.
D)instantaneous acceleration.
E)average acceleration
Unlock Deck
Unlock for access to all 119 flashcards in this deck.
Unlock Deck
k this deck
9
If the position versus time graph of an object is a vertical line, the object is
A)moving with constant non-zero speed.
B)moving with constant non-zero acceleration.
C)at rest.
D)moving with infinite speed.
E)none of the above
A)moving with constant non-zero speed.
B)moving with constant non-zero acceleration.
C)at rest.
D)moving with infinite speed.
E)none of the above
Unlock Deck
Unlock for access to all 119 flashcards in this deck.
Unlock Deck
k this deck
10
When is the average velocity of an object equal to the instantaneous velocity?
A)always
B)never
C)only when the velocity is constant
D)only when the velocity is increasing at a constant rate
E)only when the velocity is decreasing at a constant rate
A)always
B)never
C)only when the velocity is constant
D)only when the velocity is increasing at a constant rate
E)only when the velocity is decreasing at a constant rate
Unlock Deck
Unlock for access to all 119 flashcards in this deck.
Unlock Deck
k this deck
11
Car A is traveling at twice the speed of car B. They both hit the brakes at the same time and undergo identical decelerations. How does the distance required for car A to stop compare with that for car B?
Unlock Deck
Unlock for access to all 119 flashcards in this deck.
Unlock Deck
k this deck
12
The average velocity of a car traveling with a constant acceleration during a certain time interval is equal to the mean of the velocities at the beginning and end of that time interval.
Unlock Deck
Unlock for access to all 119 flashcards in this deck.
Unlock Deck
k this deck
13
Which statement is correct about the relationship between the average speed and the magnitude of the average velocity for any motion?
A)The average speed is always one-half the magnitude of the average velocity.
B)The average speed is always greater than or equal to the magnitude of the average velocity.
C)The average speed can be less than, greater than or equal to the magnitude of the average velocity.
D)The average speed is always less than or equal to the magnitude of the average velocity.
E)The average speed is always equal to the magnitude of the average velocity.
Unlock Deck
Unlock for access to all 119 flashcards in this deck.
Unlock Deck
k this deck
14
FIGURE 2-1
Fig. 2-1 shows the position of an object as a function of time. During which time interval is the object at rest between 0.0 s and 9.0 s?
A)The object is at rest between 6.0 s and 9.0 s.
B)The object is always at rest except at the instants t = 3.0 s and t = 6.0 s.
C)The object is at rest between 0.0 s and 3.0 s.
D)The object is at rest between 3.0 s and 6.0 s.
E)The object is never at rest.
Unlock Deck
Unlock for access to all 119 flashcards in this deck.
Unlock Deck
k this deck
15
The slope of a line connecting two points on a position versus time graph gives
A)displacement.
B)instantaneous velocity.
C)average velocity.
D)instantaneous acceleration.
E)average acceleration.
A)displacement.
B)instantaneous velocity.
C)average velocity.
D)instantaneous acceleration.
E)average acceleration.
Unlock Deck
Unlock for access to all 119 flashcards in this deck.
Unlock Deck
k this deck
16
At a given instant, the acceleration of a certain particle is zero. This means that
A)the velocity is constant.
B)the velocity is increasing.
C)the velocity is decreasing.
D)the velocity is not changing at that instant.
E)the velocity is zero.
A)the velocity is constant.
B)the velocity is increasing.
C)the velocity is decreasing.
D)the velocity is not changing at that instant.
E)the velocity is zero.
Unlock Deck
Unlock for access to all 119 flashcards in this deck.
Unlock Deck
k this deck
17
It is possible to have a zero acceleration, and still be moving.
Unlock Deck
Unlock for access to all 119 flashcards in this deck.
Unlock Deck
k this deck
18
Suppose that a car traveling to the East (+x direction) begins to slow down as it approaches a traffic light. Make a statement concerning its acceleration.
A)The car is decelerating, and its acceleration is positive.
B)The car is decelerating, and its acceleration is negative.
C)The acceleration is zero.
D)The car is accelerating, and its acceleration is positive.
E)The car is accelerating, and its acceleration is negative.
A)The car is decelerating, and its acceleration is positive.
B)The car is decelerating, and its acceleration is negative.
C)The acceleration is zero.
D)The car is accelerating, and its acceleration is positive.
E)The car is accelerating, and its acceleration is negative.
Unlock Deck
Unlock for access to all 119 flashcards in this deck.
Unlock Deck
k this deck
19
Car A is traveling at twice the speed of car B. They both hit the brakes at the same time and undergo identical decelerations. How does the time required for car A to stop compare with that for car B?
Unlock Deck
Unlock for access to all 119 flashcards in this deck.
Unlock Deck
k this deck
20
When the velocity and acceleration of an object have opposite signs, the speed of the object increases.
Unlock Deck
Unlock for access to all 119 flashcards in this deck.
Unlock Deck
k this deck
21
If the velocity of an object is zero, does it mean that the acceleration is zero? Support your answer with an example.
A)no, and an example would be an object starting from rest
B)no, and an example would be an object coming to a stop
C)yes, and an example would be an object sitting at rest
D)yes, because of the way in which velocity is defined
E)yes, because of the way in which acceleration is defined
A)no, and an example would be an object starting from rest
B)no, and an example would be an object coming to a stop
C)yes, and an example would be an object sitting at rest
D)yes, because of the way in which velocity is defined
E)yes, because of the way in which acceleration is defined
Unlock Deck
Unlock for access to all 119 flashcards in this deck.
Unlock Deck
k this deck
22
FIGURE 2-3
Fig. 2-3 shows the velocity of an object as a function of time. Which graph best represents the acceleration as a function of time?
A)
B)
C)
D)
E)none of the above
Fig. 2-3 shows the velocity of an object as a function of time. Which graph best represents the acceleration as a function of time?
A)
B)
C)
D)
E)none of the above
Unlock Deck
Unlock for access to all 119 flashcards in this deck.
Unlock Deck
k this deck
23
FIGURE 2-4
A graph of position as a function of time is shown in Fig. 2-4. During which time interval could the object be possibly moving with non-zero constant acceleration?
A)0.1 s to 1.9 s
B)4.1 s to 5.9 s
C)2.1 s to 3.9 s
D)6.1 s to 7.9 s
E)There is no interval that is consistent with constant non-zero acceleration.
Unlock Deck
Unlock for access to all 119 flashcards in this deck.
Unlock Deck
k this deck
24
A car is traveling north at 20.0 m/s at time t = 0.00 s. The same car is traveling north at 24.0 m/s at time t = 8.00 s. What statement is necessarily true about the acceleration of the car?
A)The car undergoes constant acceleration of 0.500 m/s2 during the time from t = 0.00 s to t = 8.0 s.
B)The car undergoes constant acceleration of 4.00 m/s2 during the time from t = 0.00 s to t = 8.0 s
C)The car has zero acceleration during the time from t = 0.00 s to t = 8.0 s
D)The average acceleration of the car is 0.500 m/s2 during the time from t = 0.00 s to t = 8.0 s
E)The average acceleration of the car is 4.00 m/s2 during the time from t = 0.00 s to t = 8.0 s
Unlock Deck
Unlock for access to all 119 flashcards in this deck.
Unlock Deck
k this deck
25
During the time that the acceleration of a particle is constant, its velocity-vs.-time curve is
A)a straight line.
B)a parabola opening downward.
C)a parabola opening upward.
D)a parabola opening toward the left.
E)a parabola opening toward the right.
A)a straight line.
B)a parabola opening downward.
C)a parabola opening upward.
D)a parabola opening toward the left.
E)a parabola opening toward the right.
Unlock Deck
Unlock for access to all 119 flashcards in this deck.
Unlock Deck
k this deck
26
An object is moving with constant non-zero acceleration on the +x axis. The position versus time graph of this object is
A)a horizontal straight line.
B)a vertical straight line.
C)a straight line making an angle with the time axis.
D)a parabolic curve.
E)a hyperbolic curve.
A)a horizontal straight line.
B)a vertical straight line.
C)a straight line making an angle with the time axis.
D)a parabolic curve.
E)a hyperbolic curve.
Unlock Deck
Unlock for access to all 119 flashcards in this deck.
Unlock Deck
k this deck
27
The slope of a tangent line at a given time value on a velocity versus time graph gives
A)displacement.
B)instantaneous velocity.
C)average velocity.
D)instantaneous acceleration.
E)average acceleration.
A)displacement.
B)instantaneous velocity.
C)average velocity.
D)instantaneous acceleration.
E)average acceleration.
Unlock Deck
Unlock for access to all 119 flashcards in this deck.
Unlock Deck
k this deck
28
The slope of a line connecting two points on a velocity versus time graph gives
A)displacement.
B)instantaneous velocity.
C)average velocity.
D)instantaneous acceleration.
E)average acceleration.
A)displacement.
B)instantaneous velocity.
C)average velocity.
D)instantaneous acceleration.
E)average acceleration.
Unlock Deck
Unlock for access to all 119 flashcards in this deck.
Unlock Deck
k this deck
29
Can an object have increasing speed while its acceleration is decreasing? Support your answer with an example.
A)No, this is impossible because of the way in which acceleration is defined.
B)No, because if acceleration is decreasing the object will be slowing down.
C)Yes, and an example would be an object falling in the absence of air friction.
D)Yes, and an example would be an object rising in the absence of air friction.
E)Yes, and an example would be an object released from rest in the presence of air friction.
Unlock Deck
Unlock for access to all 119 flashcards in this deck.
Unlock Deck
k this deck
30
Can an object's velocity change direction when its acceleration is constant? Support your answer with an example.
A)No, this is not possible because it is always speeding up.
B)No, this is not possible because it is always slowing up.
C)No, this is not possible because it is always speeding up or always slowing down, but it can never turn around.
D)Yes, this is possible, and a rock thrown straight up is an example.
E)Yes, this is possible, and a car that starts from rest, speeds up, slows to a stop, and then backs up is an example.
Unlock Deck
Unlock for access to all 119 flashcards in this deck.
Unlock Deck
k this deck
31
FIGURE 2-2
The motion of a particle is described in the velocity vs. time graph shown in Fig. 2-2. We can say that its speed
A)increases.
B)decreases.
C)increases and then decreases.
D)decreases and then increases.
E)remains constant.
The motion of a particle is described in the velocity vs. time graph shown in Fig. 2-2. We can say that its speed
A)increases.
B)decreases.
C)increases and then decreases.
D)decreases and then increases.
E)remains constant.
Unlock Deck
Unlock for access to all 119 flashcards in this deck.
Unlock Deck
k this deck
32
If the velocity versus time graph of an object is a straight line making an angle of 30 degrees with the time axis, the object is
A)moving with constant non-zero speed.
B)moving with constant non-zero acceleration.
C)at rest.
D)moving with infinite speed.
E)none of the above
A)moving with constant non-zero speed.
B)moving with constant non-zero acceleration.
C)at rest.
D)moving with infinite speed.
E)none of the above
Unlock Deck
Unlock for access to all 119 flashcards in this deck.
Unlock Deck
k this deck
33
FIGURE 2-5
A plot of position as a function of time is shown in Fig. 2-5. Which graph represents the acceleration as a function of time?
A)
B)
C)
D)
E)
A plot of position as a function of time is shown in Fig. 2-5. Which graph represents the acceleration as a function of time?
A)
B)
C)
D)
E)
Unlock Deck
Unlock for access to all 119 flashcards in this deck.
Unlock Deck
k this deck
34
If the velocity versus time graph of an object is a horizontal line, the object is
A)moving with constant non-zero speed.
B)moving with constant non-zero acceleration.
C)at rest.
D)moving with infinite speed.
E)none of the above
A)moving with constant non-zero speed.
B)moving with constant non-zero acceleration.
C)at rest.
D)moving with infinite speed.
E)none of the above
Unlock Deck
Unlock for access to all 119 flashcards in this deck.
Unlock Deck
k this deck
35
An object is moving with constant non-zero velocity on the +x axis. The position versus time graph of this object is
A)a horizontal straight line.
B)a vertical straight line.
C)a straight line making an angle with the time axis.
D)a parabolic curve.
E)a hyperbolic curve.
A)a horizontal straight line.
B)a vertical straight line.
C)a straight line making an angle with the time axis.
D)a parabolic curve.
E)a hyperbolic curve.
Unlock Deck
Unlock for access to all 119 flashcards in this deck.
Unlock Deck
k this deck
36
When is the average acceleration of an object equal to the instantaneous acceleration?
A)always
B)never
C)only when the acceleration is constant
D)only when the acceleration is increasing at a constant rate
E)only when the acceleration is decreasing at a constant rate
A)always
B)never
C)only when the acceleration is constant
D)only when the acceleration is increasing at a constant rate
E)only when the acceleration is decreasing at a constant rate
Unlock Deck
Unlock for access to all 119 flashcards in this deck.
Unlock Deck
k this deck
37
An object is moving with constant non-zero acceleration on the +x axis. The velocity versus time graph of this object is
A)a horizontal straight line.
B)a vertical straight line.
C)a straight line making an angle with the time axis.
D)a parabolic curve.
E)a hyperbolic curve.
A)a horizontal straight line.
B)a vertical straight line.
C)a straight line making an angle with the time axis.
D)a parabolic curve.
E)a hyperbolic curve.
Unlock Deck
Unlock for access to all 119 flashcards in this deck.
Unlock Deck
k this deck
38
Under what condition is average velocity equal to the average of the object's initial and final velocity?
A)The acceleration must be constantly increasing.
B)The acceleration must be constantly decreasing.
C)The acceleration must be constant.
D)This can only occur if there is no acceleration.
E)This is impossible.
A)The acceleration must be constantly increasing.
B)The acceleration must be constantly decreasing.
C)The acceleration must be constant.
D)This can only occur if there is no acceleration.
E)This is impossible.
Unlock Deck
Unlock for access to all 119 flashcards in this deck.
Unlock Deck
k this deck
39
An object is moving with constant non-zero velocity on the +x axis. The velocity versus time graph of this object is
A)a horizontal straight line.
B)a vertical straight line.
C)a straight line making an angle with the time axis.
D)a parabolic curve.
E)a hyperbolic curve.
A)a horizontal straight line.
B)a vertical straight line.
C)a straight line making an angle with the time axis.
D)a parabolic curve.
E)a hyperbolic curve.
Unlock Deck
Unlock for access to all 119 flashcards in this deck.
Unlock Deck
k this deck
40
Suppose that a car traveling to the West (-x direction) begins to slow down as it approaches a traffic light. Make a statement concerning its acceleration.
A)The car is decelerating, and its acceleration is positive.
B)The car is decelerating, and its acceleration is negative.
C)The acceleration is zero.
D)The car is accelerating, and its acceleration is positive.
E)The car is accelerating, and its acceleration is negative.
A)The car is decelerating, and its acceleration is positive.
B)The car is decelerating, and its acceleration is negative.
C)The acceleration is zero.
D)The car is accelerating, and its acceleration is positive.
E)The car is accelerating, and its acceleration is negative.
Unlock Deck
Unlock for access to all 119 flashcards in this deck.
Unlock Deck
k this deck
41
FIGURE 2-6
Fig. 2-6 represents the position of a particle as it travels along the x-axis. What is the average velocity of the particle between t = 2 s and t = 4 s?
Fig. 2-6 represents the position of a particle as it travels along the x-axis. What is the average velocity of the particle between t = 2 s and t = 4 s?
Unlock Deck
Unlock for access to all 119 flashcards in this deck.
Unlock Deck
k this deck
42
The position of a particle as a function of time is given by x(t) = (3.5 m/s)t - (5.0 m/s2)t2. What is the average velocity of the particle between t = 0.30 s and t = 0.40 s?
Unlock Deck
Unlock for access to all 119 flashcards in this deck.
Unlock Deck
k this deck
43
FIGURE 2-6
Fig. 2-6 represents the position of a particle as it travels along the x-axis. What is the average speed of the particle between t = 0 s and t = 3 s?
Fig. 2-6 represents the position of a particle as it travels along the x-axis. What is the average speed of the particle between t = 0 s and t = 3 s?
Unlock Deck
Unlock for access to all 119 flashcards in this deck.
Unlock Deck
k this deck
44
A ball is thrown straight up, reaches a maximum height, then falls to its initial height. Make a statement about the direction of the velocity and acceleration as the ball is coming down.
A)Both its velocity and its acceleration point upward.
B)Its velocity points upward and its acceleration points downward.
C)Its velocity points downward and its acceleration points upward.
D)Both its velocity and its acceleration point downward.
E)Neither velocity nor acceleration can be determined without additional information.
Unlock Deck
Unlock for access to all 119 flashcards in this deck.
Unlock Deck
k this deck
45
FIGURE 2-6
Fig. 2-6 represents the position of a particle as it travels along the x-axis. What is the magnitude of the instantaneous velocity of the particle when t = 1 s?
Fig. 2-6 represents the position of a particle as it travels along the x-axis. What is the magnitude of the instantaneous velocity of the particle when t = 1 s?
Unlock Deck
Unlock for access to all 119 flashcards in this deck.
Unlock Deck
k this deck
46
If a car accelerates at 4.0 m/s2, how long will it take to reach a speed of 80 km/hr, starting from rest?
Unlock Deck
Unlock for access to all 119 flashcards in this deck.
Unlock Deck
k this deck
47
Two objects are dropped from a bridge, an interval of 1.0 s apart. During the time that both objects continue to fall, their separation
A)increases.
B)decreases.
C)stays constant.
D)increases at first, but then stays constant.
E)decreases at first, but then stays constant.
A)increases.
B)decreases.
C)stays constant.
D)increases at first, but then stays constant.
E)decreases at first, but then stays constant.
Unlock Deck
Unlock for access to all 119 flashcards in this deck.
Unlock Deck
k this deck
48
Arthur and Betty start walking toward each other when they are 100 m apart. Arthur has a speed of 3.0 m/s and Betty has a speed of 2.0 m/s. Their dog, Spot, starts by Arthur's side at the same time and runs back and forth between them at 5.0 m/s. By the time Arthur and Betty meet, what distance has Spot run?
Unlock Deck
Unlock for access to all 119 flashcards in this deck.
Unlock Deck
k this deck
49
A stone is thrown straight up. When it reaches its highest point,
A)both its velocity and its acceleration are zero.
B)its velocity is zero and its acceleration is not zero.
C)its velocity is not zero and its acceleration is zero.
D)neither its velocity nor its acceleration is zero.
E)neither velocity nor acceleration can be determined without additional information.
Unlock Deck
Unlock for access to all 119 flashcards in this deck.
Unlock Deck
k this deck
50
The area under a curve in a velocity versus time graph gives
A)distance traveled.
B)displacement.
C)speed.
D)velocity.
E)acceleration.
A)distance traveled.
B)displacement.
C)speed.
D)velocity.
E)acceleration.
Unlock Deck
Unlock for access to all 119 flashcards in this deck.
Unlock Deck
k this deck
51
Which of the following graphs could possibly represent the motion as a function of time of an object in free fall?
A)
B)
C)
D)
E)
A)
B)
C)
D)
E)
Unlock Deck
Unlock for access to all 119 flashcards in this deck.
Unlock Deck
k this deck
52
FIGURE 2-6
Fig. 2-6 represents the position of a particle as it travels along the x-axis. What is the average speed of the particle between t = 2 s and t = 4 s?
Fig. 2-6 represents the position of a particle as it travels along the x-axis. What is the average speed of the particle between t = 2 s and t = 4 s?
Unlock Deck
Unlock for access to all 119 flashcards in this deck.
Unlock Deck
k this deck
53
FIGURE 2-6
Fig. 2-6 represents the position of a particle as it travels along the x-axis. What is the average velocity of the particle between t = 0 s and t = 3 s?
Fig. 2-6 represents the position of a particle as it travels along the x-axis. What is the average velocity of the particle between t = 0 s and t = 3 s?
Unlock Deck
Unlock for access to all 119 flashcards in this deck.
Unlock Deck
k this deck
54
Two objects are dropped from a bridge, an interval of 1.0 s apart. As time progresses, the difference in their speeds
A)increases.
B)remains constant.
C)decreases.
D)increases at first, but then stays constant.
E)decreases at first, but then stays constant.
A)increases.
B)remains constant.
C)decreases.
D)increases at first, but then stays constant.
E)decreases at first, but then stays constant.
Unlock Deck
Unlock for access to all 119 flashcards in this deck.
Unlock Deck
k this deck
55
Arthur and Betty start walking toward each other when they are 100 m apart. Arthur has a speed of 3.0 m/s and Betty has a speed of 2.0 m/s. Their dog, Spot, starts from Arthur's side at the same time and runs back and forth between them. By the time Arthur and Betty meet, what is Spot's displacement?
Unlock Deck
Unlock for access to all 119 flashcards in this deck.
Unlock Deck
k this deck
56
Suppose a ball is thrown straight up, reaches a maximum height, then falls to its initial height. Make a statement about the direction of the velocity and acceleration as the ball is going up.
A)Both its velocity and its acceleration point upward.
B)Its velocity points upward and its acceleration points downward.
C)Its velocity points downward and its acceleration points upward.
D)Both its velocity and its acceleration points downward.
E)Neither velocity nor acceleration can be determined without additional information.
Unlock Deck
Unlock for access to all 119 flashcards in this deck.
Unlock Deck
k this deck
57
Two objects are thrown from the top of a tall building. One is thrown up, and the other is thrown down, both with the same initial speed. What are their speeds when they hit the street?
A)The one thrown up is traveling faster.
B)The one thrown down is traveling faster.
C)They are traveling at the same speed.
D)It is impossible to tell because the height of the building is not given.
E)It is impossible to tell because a numerical value for the initial speed is not given.
A)The one thrown up is traveling faster.
B)The one thrown down is traveling faster.
C)They are traveling at the same speed.
D)It is impossible to tell because the height of the building is not given.
E)It is impossible to tell because a numerical value for the initial speed is not given.
Unlock Deck
Unlock for access to all 119 flashcards in this deck.
Unlock Deck
k this deck
58
A certain car can accelerate from 0 to 100 km/hr in 6.0 seconds. What is the average acceleration of that car in m/s2?
Unlock Deck
Unlock for access to all 119 flashcards in this deck.
Unlock Deck
k this deck
59
Arthur and Betty start walking toward each other when they are 100 m apart. Arthur has a speed of 3.0 m/s and Betty has a speed of 2.0 m/s. How long does it take for them to meet?
Unlock Deck
Unlock for access to all 119 flashcards in this deck.
Unlock Deck
k this deck
60
Which graph below could represent the motion of the object described in the following sentences? The object that starts its motion with a constant velocity of 2.0 m/s east. After 3.0 s, the object stops for 1.0 s. The object then moves toward the west a distance of 2.0 m in 3.0 s. The object continues traveling in the same direction, but increases its speed by 1.0 m/s for the next 2.0 s.
A)
B)
C)
D)
E)None of the above graphs could represent the motion described.
A)
B)
C)
D)
E)None of the above graphs could represent the motion described.
Unlock Deck
Unlock for access to all 119 flashcards in this deck.
Unlock Deck
k this deck
61
FIGURE 2-7
Fig. 2-7 represents the velocity of a particle as it travels along the x-axis. At what value of t is the instantaneous acceleration equal to zero?
Fig. 2-7 represents the velocity of a particle as it travels along the x-axis. At what value of t is the instantaneous acceleration equal to zero?
Unlock Deck
Unlock for access to all 119 flashcards in this deck.
Unlock Deck
k this deck
62
A man walks south at a speed of 2.00 m/s for 30.0 minutes. He then turns around and walks north a distance 6000 m in 15.0 minutes. What is the displacement of the man from his starting position?
A)1800 m north
B)3600 m south
C)5940 m south
D)4200 m south
E)2400 m north
A)1800 m north
B)3600 m south
C)5940 m south
D)4200 m south
E)2400 m north
Unlock Deck
Unlock for access to all 119 flashcards in this deck.
Unlock Deck
k this deck
63
FIGURE 2-7
Fig. 2-7 represents the velocity of a particle as it travels along the x-axis. What is the average acceleration of the particle between t = 2 s and t = 4 s?
Fig. 2-7 represents the velocity of a particle as it travels along the x-axis. What is the average acceleration of the particle between t = 2 s and t = 4 s?
Unlock Deck
Unlock for access to all 119 flashcards in this deck.
Unlock Deck
k this deck
64
A ball is thrown straight up with a speed of 30 m/s.
(a.) How long does it take the ball to reach the maximum height?
(b.) What is the maximum height reached by the ball?
(c.) What is its speed after 4.2 s?
(a.) How long does it take the ball to reach the maximum height?
(b.) What is the maximum height reached by the ball?
(c.) What is its speed after 4.2 s?
Unlock Deck
Unlock for access to all 119 flashcards in this deck.
Unlock Deck
k this deck
65
A foul ball is hit straight up into the air with a speed of 30.0 m/s.
(a.) Calculate the time required for the ball to rise to its maximum height.
(b.) Calculate the maximum height reached by the ball.
(c.) Determine the time at which the ball pass a point 25.0 m above the point of contact between the bat and ball.
(d.) Explain why there are two answers to part c.
(a.) Calculate the time required for the ball to rise to its maximum height.
(b.) Calculate the maximum height reached by the ball.
(c.) Determine the time at which the ball pass a point 25.0 m above the point of contact between the bat and ball.
(d.) Explain why there are two answers to part c.
Unlock Deck
Unlock for access to all 119 flashcards in this deck.
Unlock Deck
k this deck
66
FIGURE 2-7
Fig. 2-7 represents the velocity of a particle as it travels along the x-axis. In what direction is the acceleration at t = 0.5 s?
Fig. 2-7 represents the velocity of a particle as it travels along the x-axis. In what direction is the acceleration at t = 0.5 s?
Unlock Deck
Unlock for access to all 119 flashcards in this deck.
Unlock Deck
k this deck
67
FIGURE 2-10
Fig. 2-10 shows the position of an object as a function of time. What is the displacement of the object between time and time t = 9.0 s?
A)3.0 m
B)19.5 m
C)5.0 m
D)1.0 m
E)-1.0 m
Fig. 2-10 shows the position of an object as a function of time. What is the displacement of the object between time
and time t = 9.0 s?A)3.0 m
B)19.5 m
C)5.0 m
D)1.0 m
E)-1.0 m
Unlock Deck
Unlock for access to all 119 flashcards in this deck.
Unlock Deck
k this deck
68
FIGURE 2-10
Fig. 2-10 shows the position of an object as a function of time. What is the average speed of the object between time and time t = 9.0 s?
A)0.11 m/s
B)-0.33 m/s
C)0.33 m/s
D)0.56 m/s
E)-0.11 m/s
Fig. 2-10 shows the position of an object as a function of time. What is the average speed of the object between time
and time t = 9.0 s?A)0.11 m/s
B)-0.33 m/s
C)0.33 m/s
D)0.56 m/s
E)-0.11 m/s
Unlock Deck
Unlock for access to all 119 flashcards in this deck.
Unlock Deck
k this deck
69
FIGURE 2-10
Fig. 2-10 shows the position of an object as a function of time. What is the length of the path the object followed during the time interval from time t = 0.0 s and time t = 9.0 s?
A)-1.0 m
B)3.0 m
C)1.0 m
D)19.5 m
E)5.0 m
Fig. 2-10 shows the position of an object as a function of time. What is the length of the path the object followed during the time interval from time t = 0.0 s and time t = 9.0 s?
A)-1.0 m
B)3.0 m
C)1.0 m
D)19.5 m
E)5.0 m
Unlock Deck
Unlock for access to all 119 flashcards in this deck.
Unlock Deck
k this deck
70
The position of an object is given as a function of time as x(t) = (3.00 m/s)t + (2.00 m/s2)t2. What is the displacement of the object between t = 4.00 s and t = 5.00 s?
A)8.00 m
B)5.00 m
C)21.0 m
D)65.0 m
E)44.0 m
A)8.00 m
B)5.00 m
C)21.0 m
D)65.0 m
E)44.0 m
Unlock Deck
Unlock for access to all 119 flashcards in this deck.
Unlock Deck
k this deck
71
A man walks south at a speed of 2.00 m/s for 15.0 minutes. He then turns around and walks north a distance 2000 m in 15.0 minutes. What is the average speed of the man during his entire motion?
A)1.89 m/s
B)3.35 m/s
C)3.21 m/s
D)2.82 m/s
E)2.11 m/s
A)1.89 m/s
B)3.35 m/s
C)3.21 m/s
D)2.82 m/s
E)2.11 m/s
Unlock Deck
Unlock for access to all 119 flashcards in this deck.
Unlock Deck
k this deck
72
A car with good tires on a dry road can decelerate at about 5.0 m/s2 when braking. Suppose a car is initially traveling at 55 mi/h.
(a.) How much time does it take the car to stop?
(b.) What is the stopping distance?
(a.) How much time does it take the car to stop?
(b.) What is the stopping distance?
Unlock Deck
Unlock for access to all 119 flashcards in this deck.
Unlock Deck
k this deck
73
FIGURE 2-8
Fig. 2-8 shows the velocity-versus-time graph for a basketball player traveling up and down the court in a straight-line path. Find the displacement of the player for each of the segments A, B, C and D.
Fig. 2-8 shows the velocity-versus-time graph for a basketball player traveling up and down the court in a straight-line path. Find the displacement of the player for each of the segments A, B, C and D.
Unlock Deck
Unlock for access to all 119 flashcards in this deck.
Unlock Deck
k this deck
74
A person walks in a distance x northward, turns around and walks a distance 7.00x southward. If the total displacement of the person from his starting position is 400 m south. What was the total distance walked?
A)421 m
B)457 m
C)515 m
D)533 m
E)400 m
A)421 m
B)457 m
C)515 m
D)533 m
E)400 m
Unlock Deck
Unlock for access to all 119 flashcards in this deck.
Unlock Deck
k this deck
75
A man walks south at a speed of 2.00 m/s for 60.0 minutes. He then turns around and walks north a distance 3000 m in 25.0 minutes. What is the average velocity of the man during his entire motion?
A)0.824 m/s south
B)1.93 m/s south
C)2.00 m/s south
D)1.79 m/s south
E)800 m/s south
A)0.824 m/s south
B)1.93 m/s south
C)2.00 m/s south
D)1.79 m/s south
E)800 m/s south
Unlock Deck
Unlock for access to all 119 flashcards in this deck.
Unlock Deck
k this deck
76
FIGURE 2-9
Refer to Fig. 2-9. If you start from the Bakery, travel to the Cafe, and then to the Art Gallery, what is the distance you have traveled?
A)6.5 km
B)2.5 km
C)10.5 km
D)0 km
E)1.5 km
Refer to Fig. 2-9. If you start from the Bakery, travel to the Cafe, and then to the Art Gallery, what is the distance you have traveled?
A)6.5 km
B)2.5 km
C)10.5 km
D)0 km
E)1.5 km
Unlock Deck
Unlock for access to all 119 flashcards in this deck.
Unlock Deck
k this deck
77
FIGURE 2-7
Fig. 2-7 represents the velocity of a particle as it travels along the x-axis. In what direction is the acceleration at t = 3.0 s?
Fig. 2-7 represents the velocity of a particle as it travels along the x-axis. In what direction is the acceleration at t = 3.0 s?
Unlock Deck
Unlock for access to all 119 flashcards in this deck.
Unlock Deck
k this deck
78
At the instant a traffic light turns green, a car that has been waiting at the intersection starts ahead with a constant acceleration of 2.00 m/s2. At that moment a truck traveling with a constant velocity of 15.0 m/s overtakes and passes the car.
(a.) Calculate the time necessary for the car to reach the truck.
(b.) Calculate the distance beyond the traffic light that the car will pass the truck.
(c.) Determine the speed of the car when it passes the truck.
(a.) Calculate the time necessary for the car to reach the truck.
(b.) Calculate the distance beyond the traffic light that the car will pass the truck.
(c.) Determine the speed of the car when it passes the truck.
Unlock Deck
Unlock for access to all 119 flashcards in this deck.
Unlock Deck
k this deck
79
FIGURE 2-9
Refer to Fig. 2-9. If you start from the Bakery, travel to the Art Gallery, and then to the Cafe, in 1.0 hour, what is your average speed?
A)6.5 km/hr
B)2.5 km/hr
C)9.0 km/hr
D)10.5 km/hr
E)1.5 km/hr
Refer to Fig. 2-9. If you start from the Bakery, travel to the Art Gallery, and then to the Cafe, in 1.0 hour, what is your average speed?
A)6.5 km/hr
B)2.5 km/hr
C)9.0 km/hr
D)10.5 km/hr
E)1.5 km/hr
Unlock Deck
Unlock for access to all 119 flashcards in this deck.
Unlock Deck
k this deck
80
FIGURE 2-9
Refer to Fig. 2-9. If you start from the Bakery, travel to the Cafe, and then to the Art Gallery, what is the magnitude of your displacement?
A)6.5 km
B)2.5 km
C)10.5 km
D)9.0 km
E)1.5 km
Refer to Fig. 2-9. If you start from the Bakery, travel to the Cafe, and then to the Art Gallery, what is the magnitude of your displacement?
A)6.5 km
B)2.5 km
C)10.5 km
D)9.0 km
E)1.5 km
Unlock Deck
Unlock for access to all 119 flashcards in this deck.
Unlock Deck
k this deck
Unlock Deck
Unlock for access to all 119 flashcards in this deck.


