Deck 7: The Normal Probability Distribution
Full screen (f)
Question
State the Properties of the Normal Curve

Question
Question
Question
Question
Explain the Role of Area in the Normal Density Function
Question
State the Properties of the Normal Curve

Question
Explain the Role of Area in the Normal Density Function
Question
Question
Question
Question
State the Properties of the Normal Curve
Question
Question
Question
Question
Question
State the Properties of the Normal Curve

Question
Question
Question
Explain the Role of Area in the Normal Density Function
Question
Graph a Normal Curve
You are performing a study about the weight of preschoolers. A previous study found the weights to be normally distributed with a mean of 30 and a standard deviation of 4. You randomly sample 30 preschool children and find their weights to be as follows.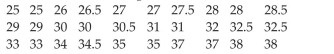 a) Draw a histogram to display the data. Is it reasonable to assume that the weights are normally distributed Why b) Find the mean and standard deviation of your sample. c) Is there a high probability that the mean and standard deviation of your sample are consistent with those found in previous studies Explain your reasoning.
You are performing a study about the weight of preschoolers. A previous study found the weights to be normally distributed with a mean of 30 and a standard deviation of 4. You randomly sample 30 preschool children and find their weights to be as follows.
a) Draw a histogram to display the data. Is it reasonable to assume that the weights are normally distributed Why b) Find the mean and standard deviation of your sample. c) Is there a high probability that the mean and standard deviation of your sample are consistent with those found in previous studies Explain your reasoning. Question
Find the Area under the Standard Normal Curve

Question
Question
Find the Area under the Standard Normal Curve

Question
Find the Area under the Standard Normal Curve

Question
A random variable X is normally distributed with = 60. Convert the value of X to a z-score, if the standard deviation is
as given.

as given.
Question
Find the Area under the Standard Normal Curve

Question
A random variable X is normally distributed with = 60. Convert the value of X to a z-score, if the standard deviation is
as given.
as given.
Question
Find the Area under the Standard Normal Curve

Question
A random variable X is normally distributed with = 60. Convert the value of X to a z-score, if the standard deviation is
as given.

as given.
Question
A random variable X is normally distributed with = 60. Convert the value of X to a z-score, if the standard deviation is
as given.

as given.
Question
Find the Area under the Standard Normal Curve

Question
Question
A random variable X is normally distributed with = 60. Convert the value of X to a z-score, if the standard deviation is
as given.

as given.
Question
Question
Find the Area under the Standard Normal Curve

Question
Find the Area under the Standard Normal Curve

Question
A random variable X is normally distributed with = 60. Convert the value of X to a z-score, if the standard deviation is
as given.

as given.
Question
Find the Area under the Standard Normal Curve

Question
A random variable X is normally distributed with = 60. Convert the value of X to a z-score, if the standard deviation is
as given.

as given.
Question
Find the Area under the Standard Normal Curve

Question
Interpret the Area under the Standard Normal Curve as a Probability

Question
Interpret the Area under the Standard Normal Curve as a Probability

Question
Interpret the Area under the Standard Normal Curve as a Probability

Question
Interpret the Area under the Standard Normal Curve as a Probability

Question
Interpret the Area under the Standard Normal Curve as a Probability

Question
Interpret the Area under the Standard Normal Curve as a Probability

Question
Find the Area under the Standard Normal Curve
Question
Find z-scores for a Given Area

Question
Find z-scores for a Given Area

Question
Interpret the Area under the Standard Normal Curve as a Probability

Question
Find and Interpret the Area under a Normal Curve

Question
Find z-scores for a Given Area

Question
Find z-scores for a Given Area

Question
Interpret the Area under the Standard Normal Curve as a Probability

Question
Interpret the Area under the Standard Normal Curve as a Probability

Question
Find z-scores for a Given Area

Question
Interpret the Area under the Standard Normal Curve as a Probability

Question
Interpret the Area under the Standard Normal Curve as a Probability

Question
Find z-scores for a Given Area

Question
Find z-scores for a Given Area

Question
Question
Find and Interpret the Area under a Normal Curve

Question
Question
Question
Question
Question
Question
Question
Question
Question
Find and Interpret the Area under a Normal Curve

Question
Question
Question
Question
Question
Find and Interpret the Area under a Normal Curve

Question
Question
Find and Interpret the Area under a Normal Curve
The length of time it takes college students to find a parking spot in the library parking lot follows a normal distribution with a mean of 3.5 minutes and a standard deviation of 1 minute. Find the probability that a randomly selected college student will take between 2.0 and 4.5 minutes to find a parking spot in the library lot.
The length of time it takes college students to find a parking spot in the library parking lot follows a normal distribution with a mean of 3.5 minutes and a standard deviation of 1 minute. Find the probability that a randomly selected college student will take between 2.0 and 4.5 minutes to find a parking spot in the library lot.
Question
Find and Interpret the Area under a Normal Curve

Question
Find and Interpret the Area under a Normal Curve


Unlock Deck
Sign up to unlock the cards in this deck!
Unlock Deck
Unlock Deck
1/123
Play
Full screen (f)
Deck 7: The Normal Probability Distribution
1
State the Properties of the Normal Curve
A
2
State the Properties of the Normal Curve
The normal density curve is symmetric about
A) Its mean
B) The horizontal axis
C) An inflection point
D) A point located one standard deviation from the mean
The normal density curve is symmetric about
A) Its mean
B) The horizontal axis
C) An inflection point
D) A point located one standard deviation from the mean
A
3
Provide an appropriate response
A random number generator is set top generate integer random numbers between 1 and 10 inclusive following a uniform distribution. What is the probability of the random number generator generating a 7
A) 0.7
B) 0
C) 0.07
D) 0.5
A random number generator is set top generate integer random numbers between 1 and 10 inclusive following a uniform distribution. What is the probability of the random number generator generating a 7
A) 0.7
B) 0
C) 0.07
D) 0.5
A
4
Provide an appropriate response
A machine is set to pump cleanser into a process at the rate of 5 gallons per minute. Upon inspection, it is learned that the machine actually pumps cleanser at a rate described by the uniform distribution over the interval 4.5 to 7.5 gallons per minute. Find the probability that between 5.0 gallons and 6.0 gallons are pumped during a randomly selected minute.
A) 0.33
B) 0.67
C) 0
D) 1
Unlock Deck
Unlock for access to all 123 flashcards in this deck.
Unlock Deck
k this deck
5
Explain the Role of Area in the Normal Density Function
Unlock Deck
Unlock for access to all 123 flashcards in this deck.
Unlock Deck
k this deck
6
State the Properties of the Normal Curve
Unlock Deck
Unlock for access to all 123 flashcards in this deck.
Unlock Deck
k this deck
7
Explain the Role of Area in the Normal Density Function
Unlock Deck
Unlock for access to all 123 flashcards in this deck.
Unlock Deck
k this deck
8
Provide an appropriate response
Suppose x is a uniform random variable with c = 10 and d = 90. Find the probability that a randomly selected observation exceeds 26.
A) 0.8
B) 0.2
C) 0.1
D) 0.9
Suppose x is a uniform random variable with c = 10 and d = 90. Find the probability that a randomly selected observation exceeds 26.
A) 0.8
B) 0.2
C) 0.1
D) 0.9
Unlock Deck
Unlock for access to all 123 flashcards in this deck.
Unlock Deck
k this deck
9
Provide an appropriate response
High temperatures in a certain city for the month of August follow a uniform distribution over the interval 64°F to 94°F. Find the high temperature which 90% of the August days exceed.
A) 67°F
B) 91°F
C) 74°F
D) 94°F
High temperatures in a certain city for the month of August follow a uniform distribution over the interval 64°F to 94°F. Find the high temperature which 90% of the August days exceed.
A) 67°F
B) 91°F
C) 74°F
D) 94°F
Unlock Deck
Unlock for access to all 123 flashcards in this deck.
Unlock Deck
k this deck
10
Provide an appropriate response
Suppose a uniform random variable can be used to describe the outcome of an experiment with the outcomes ranging from 10 to 70. What is the probability that this experiment results in an outcome less than 20
A) 0.17
B) 0.13
C) 0.22
D) 1
Suppose a uniform random variable can be used to describe the outcome of an experiment with the outcomes ranging from 10 to 70. What is the probability that this experiment results in an outcome less than 20
A) 0.17
B) 0.13
C) 0.22
D) 1
Unlock Deck
Unlock for access to all 123 flashcards in this deck.
Unlock Deck
k this deck
11
State the Properties of the Normal Curve
Unlock Deck
Unlock for access to all 123 flashcards in this deck.
Unlock Deck
k this deck
12
Graph a Normal Curve
Compare a graph of the normal density function with mean of 0 and standard deviation of 1 with a graph of a normal density function with mean equal to 4 and standard deviation of 1. The graphs would
A) Have the same height but one would be shifted 4 units to the right.
B) Have the same height but one would be shifter 4 units to the left.
C) Have no horizontal displacement but one would be steeper that the other.
D) Have no horizontal displacement but one would be flatter than the other.
Unlock Deck
Unlock for access to all 123 flashcards in this deck.
Unlock Deck
k this deck
13
Provide an appropriate response
Suppose x is a uniform random variable with c = 30 and d = 70. Find the probability that a randomly selected observation is between 33 and 65.
A) 0.80
B) 0.20
C) 0.5
D) 0.8
Suppose x is a uniform random variable with c = 30 and d = 70. Find the probability that a randomly selected observation is between 33 and 65.
A) 0.80
B) 0.20
C) 0.5
D) 0.8
Unlock Deck
Unlock for access to all 123 flashcards in this deck.
Unlock Deck
k this deck
14
Provide an appropriate response
In a uniform probability distribution, any random variable is just as likely as any other random variable to occur, provided the random variables belong to the distribution.
In a uniform probability distribution, any random variable is just as likely as any other random variable to occur, provided the random variables belong to the distribution.
Unlock Deck
Unlock for access to all 123 flashcards in this deck.
Unlock Deck
k this deck
15
Provide an appropriate response
High temperatures in a certain city for the month of August follow a uniform distribution over the interval 65°F to 87°F. What is the probability that a randomly selected August day has a high temperature that exceeded 70°F
A) 0.7727
B) 0.2273
C) 0.4605
D) 0.0455
High temperatures in a certain city for the month of August follow a uniform distribution over the interval 65°F to 87°F. What is the probability that a randomly selected August day has a high temperature that exceeded 70°F
A) 0.7727
B) 0.2273
C) 0.4605
D) 0.0455
Unlock Deck
Unlock for access to all 123 flashcards in this deck.
Unlock Deck
k this deck
16
State the Properties of the Normal Curve
Unlock Deck
Unlock for access to all 123 flashcards in this deck.
Unlock Deck
k this deck
17
Graph a Normal Curve
Compare a graph of the normal density function with mean of 0 and standard deviation of 1 with a graph of a normal density function with mean equal to 0 and standard deviation of 0.5. The graphs would
A) Have no horizontal displacement but one would be steeper that the other.
B) Have no horizontal displacement but one would be flatter than the other.
C) Have the same height but one would be shifted 4 units to the right.
D) Have the same height but one would be shifter 4 units to the left.
Unlock Deck
Unlock for access to all 123 flashcards in this deck.
Unlock Deck
k this deck
18
Provide an appropriate response
The diameter of ball bearings produced in a manufacturing process can be explained using a uniform distribution over the interval 6.5 to 8.5 millimeters. What is the probability that a randomly selected ball bearing has a diameter greater than 7.4 millimeters
A) 0.55
B) 0.8706
C) 3.5
D) 0.4933
The diameter of ball bearings produced in a manufacturing process can be explained using a uniform distribution over the interval 6.5 to 8.5 millimeters. What is the probability that a randomly selected ball bearing has a diameter greater than 7.4 millimeters
A) 0.55
B) 0.8706
C) 3.5
D) 0.4933
Unlock Deck
Unlock for access to all 123 flashcards in this deck.
Unlock Deck
k this deck
19
Explain the Role of Area in the Normal Density Function
Unlock Deck
Unlock for access to all 123 flashcards in this deck.
Unlock Deck
k this deck
20
Graph a Normal Curve
You are performing a study about the weight of preschoolers. A previous study found the weights to be normally distributed with a mean of 30 and a standard deviation of 4. You randomly sample 30 preschool children and find their weights to be as follows. a) Draw a histogram to display the data. Is it reasonable to assume that the weights are normally distributed Why b) Find the mean and standard deviation of your sample. c) Is there a high probability that the mean and standard deviation of your sample are consistent with those found in previous studies Explain your reasoning.
You are performing a study about the weight of preschoolers. A previous study found the weights to be normally distributed with a mean of 30 and a standard deviation of 4. You randomly sample 30 preschool children and find their weights to be as follows.
a) Draw a histogram to display the data. Is it reasonable to assume that the weights are normally distributed Why b) Find the mean and standard deviation of your sample. c) Is there a high probability that the mean and standard deviation of your sample are consistent with those found in previous studies Explain your reasoning. Unlock Deck
Unlock for access to all 123 flashcards in this deck.
Unlock Deck
k this deck
21
Find the Area under the Standard Normal Curve
Unlock Deck
Unlock for access to all 123 flashcards in this deck.
Unlock Deck
k this deck
22
Explain the Role of Area in the Normal Density Function
The area under the normal curve drawn with regard to the population parameters is the same as the proportion of the population that has these characteristics.
The area under the normal curve drawn with regard to the population parameters is the same as the proportion of the population that has these characteristics.
Unlock Deck
Unlock for access to all 123 flashcards in this deck.
Unlock Deck
k this deck
23
Find the Area under the Standard Normal Curve
Unlock Deck
Unlock for access to all 123 flashcards in this deck.
Unlock Deck
k this deck
24
Find the Area under the Standard Normal Curve
Unlock Deck
Unlock for access to all 123 flashcards in this deck.
Unlock Deck
k this deck
25
A random variable X is normally distributed with = 60. Convert the value of X to a z-score, if the standard deviation is
as given.
as given.
Unlock Deck
Unlock for access to all 123 flashcards in this deck.
Unlock Deck
k this deck
26
Find the Area under the Standard Normal Curve
Unlock Deck
Unlock for access to all 123 flashcards in this deck.
Unlock Deck
k this deck
27
A random variable X is normally distributed with = 60. Convert the value of X to a z-score, if the standard deviation is
as given.
as given.
Unlock Deck
Unlock for access to all 123 flashcards in this deck.
Unlock Deck
k this deck
28
Find the Area under the Standard Normal Curve
Unlock Deck
Unlock for access to all 123 flashcards in this deck.
Unlock Deck
k this deck
29
A random variable X is normally distributed with = 60. Convert the value of X to a z-score, if the standard deviation is
as given.
as given.
Unlock Deck
Unlock for access to all 123 flashcards in this deck.
Unlock Deck
k this deck
30
A random variable X is normally distributed with = 60. Convert the value of X to a z-score, if the standard deviation is
as given.
as given.
Unlock Deck
Unlock for access to all 123 flashcards in this deck.
Unlock Deck
k this deck
31
Find the Area under the Standard Normal Curve
Unlock Deck
Unlock for access to all 123 flashcards in this deck.
Unlock Deck
k this deck
32
Explain the Role of Area in the Normal Density Function
The proportion of the population that has certain characteristics is the same as the probability that a randomly selected individual of the population has these same characteristics.
The proportion of the population that has certain characteristics is the same as the probability that a randomly selected individual of the population has these same characteristics.
Unlock Deck
Unlock for access to all 123 flashcards in this deck.
Unlock Deck
k this deck
33
A random variable X is normally distributed with = 60. Convert the value of X to a z-score, if the standard deviation is
as given.
as given.
Unlock Deck
Unlock for access to all 123 flashcards in this deck.
Unlock Deck
k this deck
34
Explain the Role of Area in the Normal Density Function
The area under the normal curve drawn with regard to the population parameters is the same as the probability that a randomly selected individual of a population has these characteristics.
The area under the normal curve drawn with regard to the population parameters is the same as the probability that a randomly selected individual of a population has these characteristics.
Unlock Deck
Unlock for access to all 123 flashcards in this deck.
Unlock Deck
k this deck
35
Find the Area under the Standard Normal Curve
Unlock Deck
Unlock for access to all 123 flashcards in this deck.
Unlock Deck
k this deck
36
Find the Area under the Standard Normal Curve
Unlock Deck
Unlock for access to all 123 flashcards in this deck.
Unlock Deck
k this deck
37
A random variable X is normally distributed with = 60. Convert the value of X to a z-score, if the standard deviation is
as given.
as given.
Unlock Deck
Unlock for access to all 123 flashcards in this deck.
Unlock Deck
k this deck
38
Find the Area under the Standard Normal Curve
Unlock Deck
Unlock for access to all 123 flashcards in this deck.
Unlock Deck
k this deck
39
A random variable X is normally distributed with = 60. Convert the value of X to a z-score, if the standard deviation is
as given.
as given.
Unlock Deck
Unlock for access to all 123 flashcards in this deck.
Unlock Deck
k this deck
40
Find the Area under the Standard Normal Curve
Unlock Deck
Unlock for access to all 123 flashcards in this deck.
Unlock Deck
k this deck
41
Interpret the Area under the Standard Normal Curve as a Probability
Unlock Deck
Unlock for access to all 123 flashcards in this deck.
Unlock Deck
k this deck
42
Interpret the Area under the Standard Normal Curve as a Probability
Unlock Deck
Unlock for access to all 123 flashcards in this deck.
Unlock Deck
k this deck
43
Interpret the Area under the Standard Normal Curve as a Probability
Unlock Deck
Unlock for access to all 123 flashcards in this deck.
Unlock Deck
k this deck
44
Interpret the Area under the Standard Normal Curve as a Probability
Unlock Deck
Unlock for access to all 123 flashcards in this deck.
Unlock Deck
k this deck
45
Interpret the Area under the Standard Normal Curve as a Probability
Unlock Deck
Unlock for access to all 123 flashcards in this deck.
Unlock Deck
k this deck
46
Interpret the Area under the Standard Normal Curve as a Probability
Unlock Deck
Unlock for access to all 123 flashcards in this deck.
Unlock Deck
k this deck
47
Find the Area under the Standard Normal Curve
Unlock Deck
Unlock for access to all 123 flashcards in this deck.
Unlock Deck
k this deck
48
Find z-scores for a Given Area
Unlock Deck
Unlock for access to all 123 flashcards in this deck.
Unlock Deck
k this deck
49
Find z-scores for a Given Area
Unlock Deck
Unlock for access to all 123 flashcards in this deck.
Unlock Deck
k this deck
50
Interpret the Area under the Standard Normal Curve as a Probability
Unlock Deck
Unlock for access to all 123 flashcards in this deck.
Unlock Deck
k this deck
51
Find and Interpret the Area under a Normal Curve
Unlock Deck
Unlock for access to all 123 flashcards in this deck.
Unlock Deck
k this deck
52
Find z-scores for a Given Area
Unlock Deck
Unlock for access to all 123 flashcards in this deck.
Unlock Deck
k this deck
53
Find z-scores for a Given Area
Unlock Deck
Unlock for access to all 123 flashcards in this deck.
Unlock Deck
k this deck
54
Interpret the Area under the Standard Normal Curve as a Probability
Unlock Deck
Unlock for access to all 123 flashcards in this deck.
Unlock Deck
k this deck
55
Interpret the Area under the Standard Normal Curve as a Probability
Unlock Deck
Unlock for access to all 123 flashcards in this deck.
Unlock Deck
k this deck
56
Find z-scores for a Given Area
Unlock Deck
Unlock for access to all 123 flashcards in this deck.
Unlock Deck
k this deck
57
Interpret the Area under the Standard Normal Curve as a Probability
Unlock Deck
Unlock for access to all 123 flashcards in this deck.
Unlock Deck
k this deck
58
Interpret the Area under the Standard Normal Curve as a Probability
Unlock Deck
Unlock for access to all 123 flashcards in this deck.
Unlock Deck
k this deck
59
Find z-scores for a Given Area
Unlock Deck
Unlock for access to all 123 flashcards in this deck.
Unlock Deck
k this deck
60
Find z-scores for a Given Area
Unlock Deck
Unlock for access to all 123 flashcards in this deck.
Unlock Deck
k this deck
61
Find and Interpret the Area under a Normal Curve
A firm believes the internal rate of return for its proposed investment can best be described by a normal distribution with mean 36% and standard deviation 3%. What is the probability that the internal rate of return for the investment exceeds 42%
A firm believes the internal rate of return for its proposed investment can best be described by a normal distribution with mean 36% and standard deviation 3%. What is the probability that the internal rate of return for the investment exceeds 42%
Unlock Deck
Unlock for access to all 123 flashcards in this deck.
Unlock Deck
k this deck
62
Find and Interpret the Area under a Normal Curve
Unlock Deck
Unlock for access to all 123 flashcards in this deck.
Unlock Deck
k this deck
63
Find and Interpret the Area under a Normal Curve
Farmers often sell fruits and vegetables at roadside stands during the summer. One such roadside stand has a daily demand for tomatoes that is approximately normally distributed with a mean equal to 440 tomatoes per day and a standard deviation equal to 30 tomatoes per day. If there are 398 tomatoes available to be sold at the roadside stand at the beginning of a day, what is the probability that they will all be sold
Farmers often sell fruits and vegetables at roadside stands during the summer. One such roadside stand has a daily demand for tomatoes that is approximately normally distributed with a mean equal to 440 tomatoes per day and a standard deviation equal to 30 tomatoes per day. If there are 398 tomatoes available to be sold at the roadside stand at the beginning of a day, what is the probability that they will all be sold
Unlock Deck
Unlock for access to all 123 flashcards in this deck.
Unlock Deck
k this deck
64
Find and Interpret the Area under a Normal Curve
Suppose a brewery has a filling machine that fills 12 ounce bottles of beer. It is known that the amount of beer poured by this filling machine follows a normal distribution with a mean of 12.12 ounces and a standard deviation of 0.04 ounce. Find the probability that the bottle contains between 12.02 and 12.08 ounces.
A) 0.1525
B) 0.8351
C) 0.1649
D) 0.8475
Unlock Deck
Unlock for access to all 123 flashcards in this deck.
Unlock Deck
k this deck
65
Find and Interpret the Area under a Normal Curve
The amount of soda a dispensing machine pours into a 12 ounce can of soda follows a normal distribution with a mean of 12.27 ounces and a standard deviation of 0.18 ounce. The cans only hold 12.45 ounces of soda. Every can that has more than 12.45 ounces of soda poured into it causes a spill and the can needs to go through a special cleaning process before it can be sold. What is the probability a randomly selected can will need to go through this process
A) 0.1587
B) 0.3413
C) 0.8413
D) 0.6587
Unlock Deck
Unlock for access to all 123 flashcards in this deck.
Unlock Deck
k this deck
66
Find and Interpret the Area under a Normal Curve
A new phone system was installed last year to help reduce the expense of personal calls that were being made by employees. Before the new system was installed, the amount being spent on personal calls followed a normal distribution with an average of $800 per month and a standard deviation of $50 per month. Refer to such expenses as PCE s (personal call expenses). Using the distribution above, what is the probability that a randomly selected month had a PCE of between $675.00 and $890.00
A) 0.9579
B) 0.0421
C) 0.9999
D) 0.0001
Unlock Deck
Unlock for access to all 123 flashcards in this deck.
Unlock Deck
k this deck
67
Find and Interpret the Area under a Normal Curve
The tread life of a particular brand of tire is a random variable best described by a normal distribution with a mean of 60,000 miles and a standard deviation of 1300 miles. What is the probability a particular tire of this brand will last longer than 58,700 miles
A) 0.8413
B) 0.1587
C) 0.2266
D) 0.7266
Unlock Deck
Unlock for access to all 123 flashcards in this deck.
Unlock Deck
k this deck
68
Find and Interpret the Area under a Normal Curve
The tread life of a particular brand of tire is a random variable best described by a normal distribution with a mean of 60,000 miles and a standard deviation of 2900 miles. What is the probability a certain tire of this brand will last between 53,910 miles and 54,780 miles
A) 0.0180
B) 0.9813
C) 0.4920
D) 0.4649
Unlock Deck
Unlock for access to all 123 flashcards in this deck.
Unlock Deck
k this deck
69
Find and Interpret the Area under a Normal Curve
A new phone system was installed last year to help reduce the expense of personal calls that were being made by employees. Before the new system was installed, the amount being spent on personal calls follows a normal distribution with an average of $700 per month and a standard deviation of $50 per month. Refer to such expenses as PCE s (personal call expenses). Find the probability that a randomly selected month had a PCE that falls below $550.
A) 0.0013
B) 0.7857
C) 0.2143
D) 0.9987
Unlock Deck
Unlock for access to all 123 flashcards in this deck.
Unlock Deck
k this deck
70
Find and Interpret the Area under a Normal Curve
Suppose a brewery has a filling machine that fills 12 ounce bottles of beer. It is known that the amount of beer poured by this filling machine follows a normal distribution with a mean of 12.43 ounces and a standard deviation of 0.04 ounce. Find the probability that the bottle contains fewer than 12.33 ounces of beer.
A) 0.0062
B) 0.4938
C) 0.9938
D) 0.5062
Unlock Deck
Unlock for access to all 123 flashcards in this deck.
Unlock Deck
k this deck
71
Find and Interpret the Area under a Normal Curve
Unlock Deck
Unlock for access to all 123 flashcards in this deck.
Unlock Deck
k this deck
72
Find and Interpret the Area under a Normal Curve
The length of time it takes college students to find a parking spot in the library parking lot follows a normal distribution with a mean of 3.0 minutes and a standard deviation of 1 minute. Find the probability that a randomly selected college student will find a parking spot in the library parking lot in less than 2.5 minutes.
A) 0.3085
B) 0.1915
C) 0.3551
D) 0.2674
Unlock Deck
Unlock for access to all 123 flashcards in this deck.
Unlock Deck
k this deck
73
Find and Interpret the Area under a Normal Curve
A physical fitness association is including the mile run in its secondary-school fitness test. The time for this event for boys in secondary school is known to possess a normal distribution with a mean of 460 seconds and a standard deviation of 60 seconds. Find the probability that a randomly selected boy in secondary school can run the mile in less than 322 seconds.
A) 0.0107
B) 0.4893
C) 0.9893
D) 0.5107
Unlock Deck
Unlock for access to all 123 flashcards in this deck.
Unlock Deck
k this deck
74
Find and Interpret the Area under a Normal Curve
A physical fitness association is including the mile run in its secondary-school fitness test. The time for this event for boys in secondary school is known to possess a normal distribution with a mean of 470 seconds and a standard deviation of 40 seconds. Find the probability that a randomly selected boy in secondary school will take longer than 378 seconds to run the mile.
A) 0.9893
B) 0.4893
C) 0.0107
D) 0.5107
Unlock Deck
Unlock for access to all 123 flashcards in this deck.
Unlock Deck
k this deck
75
Find and Interpret the Area under a Normal Curve
A firm believes the internal rate of return for its proposed investment can best be described by a normal distribution with mean 24% and standard deviation 3%. What is the probability that the internal rate of return for the investment will be at least 19.5%
A firm believes the internal rate of return for its proposed investment can best be described by a normal distribution with mean 24% and standard deviation 3%. What is the probability that the internal rate of return for the investment will be at least 19.5%
Unlock Deck
Unlock for access to all 123 flashcards in this deck.
Unlock Deck
k this deck
76
Find and Interpret the Area under a Normal Curve
Unlock Deck
Unlock for access to all 123 flashcards in this deck.
Unlock Deck
k this deck
77
Find and Interpret the Area under a Normal Curve
Suppose a brewery has a filling machine that fills 12 ounce bottles of beer. It is known that the amount of beer poured by this filling machine follows a normal distribution with a mean of 11.14 onces and a standard deviation of 0.04 ounce. Find the probability that the bottle contains more than 11.14 ounces of beer.
A) 0.5
B) 1
C) 0
D) 0.4
Unlock Deck
Unlock for access to all 123 flashcards in this deck.
Unlock Deck
k this deck
78
Find and Interpret the Area under a Normal Curve
The length of time it takes college students to find a parking spot in the library parking lot follows a normal distribution with a mean of 3.5 minutes and a standard deviation of 1 minute. Find the probability that a randomly selected college student will take between 2.0 and 4.5 minutes to find a parking spot in the library lot.
The length of time it takes college students to find a parking spot in the library parking lot follows a normal distribution with a mean of 3.5 minutes and a standard deviation of 1 minute. Find the probability that a randomly selected college student will take between 2.0 and 4.5 minutes to find a parking spot in the library lot.
Unlock Deck
Unlock for access to all 123 flashcards in this deck.
Unlock Deck
k this deck
79
Find and Interpret the Area under a Normal Curve
Unlock Deck
Unlock for access to all 123 flashcards in this deck.
Unlock Deck
k this deck
80
Find and Interpret the Area under a Normal Curve
Unlock Deck
Unlock for access to all 123 flashcards in this deck.
Unlock Deck
k this deck
Unlock Deck
Unlock for access to all 123 flashcards in this deck.


