Deck 14: Inference for Regression
Full screen (f)
Question
Question
A sales manager was interested in determining if there is a relationship between college GPA and sales performance among salespeople hired within the last year.A
Sample of recently hired salespeople was selected the number of units each sold last
Month recorded.The regression results are shown below.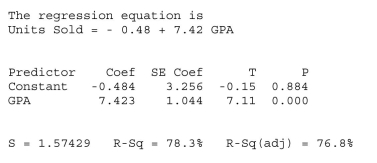 Based on these results, the residual standard deviation is
A)3.256.
B)1.044.
C)1.574.
D)34.70.
E)None of the above.
Sample of recently hired salespeople was selected the number of units each sold last
Month recorded.The regression results are shown below.
Based on these results, the residual standard deviation isA)3.256.
B)1.044.
C)1.574.
D)34.70.
E)None of the above.
Question
An operations manager was interested in determining if there is a relationship between the amount of training received by production line workers and the time it takes for them
To trouble shoot a process problem.A sample of recently trained line workers was
Selected.The number of hours of training time received and the time it took (in minutes)
For them to trouble shoot their last process problem were captured.A regression equation
Was fit to the data and the following residual plot obtained.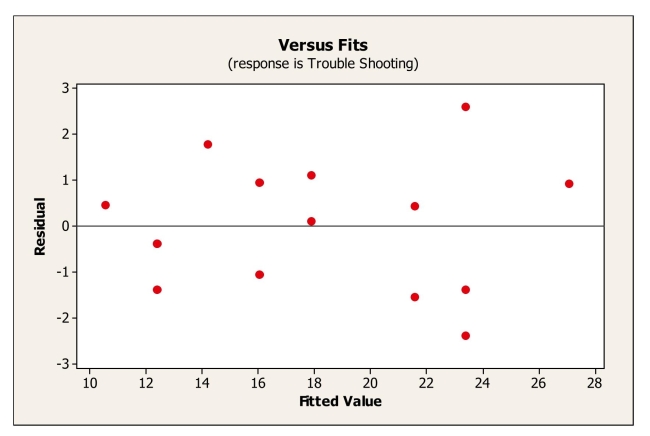 Based on this plot, we can say
A)that the nearly normal condition is satisfied.
B)that the nearly normal condition is not satisfied.
C)that the equal spread condition is satisfied.
D)that the linearity condition is not satisfied.
E)that the independence condition is not satisfied.
To trouble shoot a process problem.A sample of recently trained line workers was
Selected.The number of hours of training time received and the time it took (in minutes)
For them to trouble shoot their last process problem were captured.A regression equation
Was fit to the data and the following residual plot obtained.
Based on this plot, we can sayA)that the nearly normal condition is satisfied.
B)that the nearly normal condition is not satisfied.
C)that the equal spread condition is satisfied.
D)that the linearity condition is not satisfied.
E)that the independence condition is not satisfied.
Question
Question
A sales manager was interested in determining if there is a relationship between college GPA and sales performance among salespeople hired within the last year.A
Sample of recently hired salespeople was selected the number of units each sold last
Month recorded.The correct null hypothesis is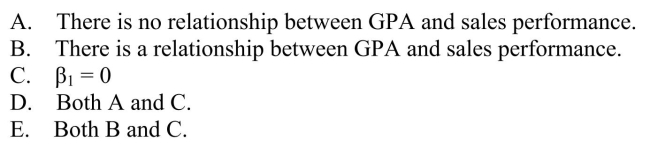
Sample of recently hired salespeople was selected the number of units each sold last
Month recorded.The correct null hypothesis is
Question
An operations manager was interested in determining if there is a relationship between the amount of training received by production line workers and the time it takes for them
To trouble shoot a process problem.A sample of 15 recently trained line workers was
Selected.The number of hours of training time received and the time it took (in minutes)
For them to trouble shoot their last process problem were captured.The regression output
Is shown below.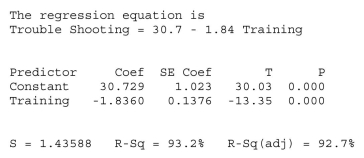 The 95% confidence interval for the slope of the regression equation is
A)-4 to 0.32
B)-1.9776 to -1.7224
C)-2.1332 to -1.5388
D)-3.611 to -0.069
E)None of the above.
To trouble shoot a process problem.A sample of 15 recently trained line workers was
Selected.The number of hours of training time received and the time it took (in minutes)
For them to trouble shoot their last process problem were captured.The regression output
Is shown below.
The 95% confidence interval for the slope of the regression equation isA)-4 to 0.32
B)-1.9776 to -1.7224
C)-2.1332 to -1.5388
D)-3.611 to -0.069
E)None of the above.
Question
As the carbon content in steel increases, its ductility tends to decrease.A researcher at a steel company measures carbon content and ductility for a sample of 15 types of steel.
Based on these data he obtained the following regression results.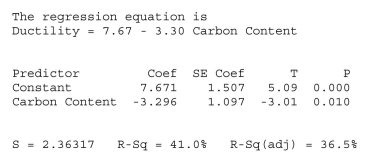 The 95% confidence interval for the slope of the regression equation is
A)-5.456 to -1.136
B)-4.393 to -2.199
C)6.164 to 9.178
D)-5.666 to -0.926
E)2.581 to 12.761
Based on these data he obtained the following regression results.
The 95% confidence interval for the slope of the regression equation isA)-5.456 to -1.136
B)-4.393 to -2.199
C)6.164 to 9.178
D)-5.666 to -0.926
E)2.581 to 12.761
Question
A sales manager was interested in determining if there is a relationship between college GPA and sales performance among salespeople hired within the last year.A
Sample of recently hired salespeople was selected the number of units each sold last
Month recorded.The regression results shown are below.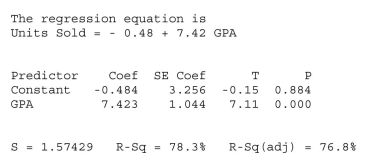 Based on these results, the percentage of variability in sales performance (units sold per
Month) accounted for by college GPA is
A)50.56%.
B)78.3%.
C)34.70%.
D)100%
E)None of the above.
Sample of recently hired salespeople was selected the number of units each sold last
Month recorded.The regression results shown are below.
Based on these results, the percentage of variability in sales performance (units sold perMonth) accounted for by college GPA is
A)50.56%.
B)78.3%.
C)34.70%.
D)100%
E)None of the above.
Question
Question
As the carbon content in steel increases, its ductility tends to decrease.A researcher at a steel company measures carbon content and ductility for a sample of 15 types of steel.
Based on these data he obtained the following regression results.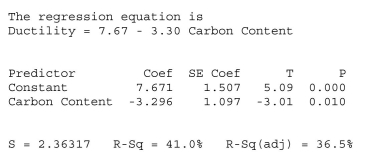 The standard error of the regression slope is
A)1.507
B)5.09
C)-3.296
D)2.36317
E)1.097
Based on these data he obtained the following regression results.
The standard error of the regression slope isA)1.507
B)5.09
C)-3.296
D)2.36317
E)1.097
Question
Here is a plot of residuals versus fitted values: 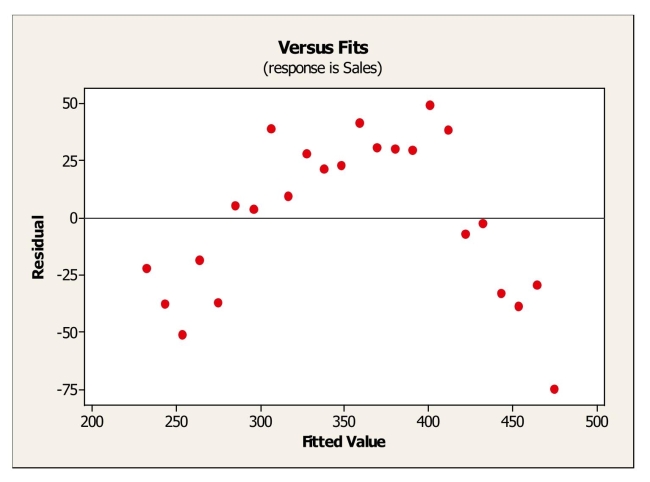 Based on the plot, we can say that
A)all conditions for inferences in regression are satisfied.
B)the equal spread condition is not satisfied.
C)the linearity condition is not satisfied.
D)the nearly normal condition is not satisfied.
E)the quantitative variables condition is not satisfied.
Based on the plot, we can say thatA)all conditions for inferences in regression are satisfied.
B)the equal spread condition is not satisfied.
C)the linearity condition is not satisfied.
D)the nearly normal condition is not satisfied.
E)the quantitative variables condition is not satisfied.
Question
Here is a plot of residuals versus fitted values. 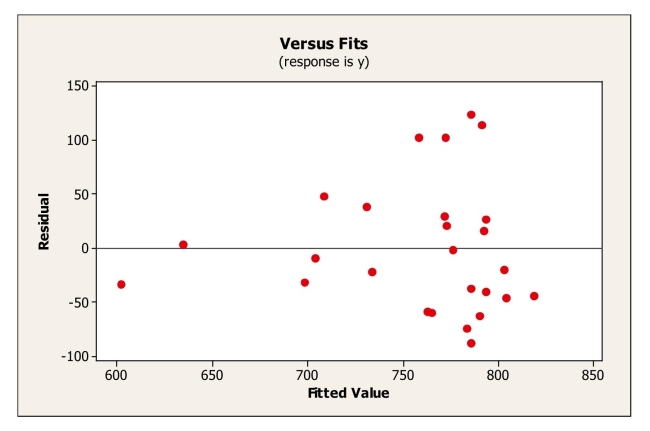
A)the equal spread condition is satisfied.
B)the equal spread condition is not satisfied.
C)the nearly normal condition is not satisfied.
D)the linearity condition is not satisfied.
E)the quantitative variables condition is not satisfied.
A)the equal spread condition is satisfied.
B)the equal spread condition is not satisfied.
C)the nearly normal condition is not satisfied.
D)the linearity condition is not satisfied.
E)the quantitative variables condition is not satisfied.
Question
Question
A sales manager was interested in determining if there is a relationship between college GPA and sales performance among salespeople hired within the last year.A
Sample of recently hired salespeople was selected the number of units each sold last
Month recorded.The regression results are shown below.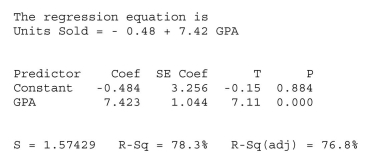 Based on these results, at α = .05 we will
A)reject the null hypothesis.
B)not reject the null hypothesis.
C)conclude that there is no significant relationship between GPA and sales performance.
Sample of recently hired salespeople was selected the number of units each sold last
Month recorded.The regression results are shown below.
Based on these results, at α = .05 we willA)reject the null hypothesis.
B)not reject the null hypothesis.
C)conclude that there is no significant relationship between GPA and sales performance.
Question
An operations manager was interested in determining if there is a relationship between the amount of training received by production line workers and the time it takes for them
To trouble shoot a process problem.A sample of recently trained line workers was
Selected.The number of hours of training time received and the time it took (in minutes)
For them to trouble shoot their last process problem were captured.A regression equation
Was fit to the data and the following histogram of residuals obtained.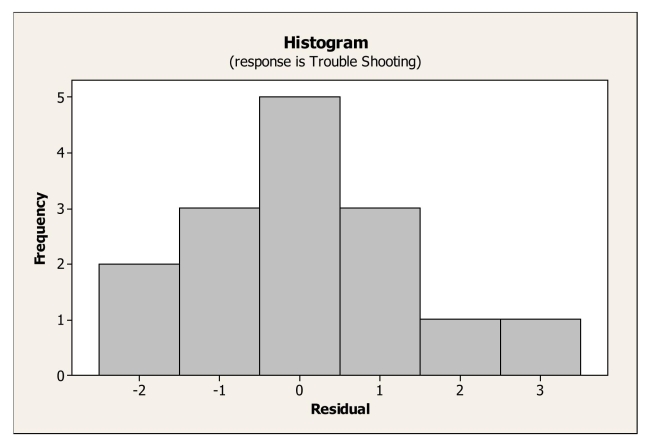 Based on this histogram we can say
A)that the nearly normal condition is satisfied.
B)that the nearly normal condition is not satisfied.
C)that the equal spread condition is satisfied.
D)that the linearity condition is not satisfied.
E)that the independence condition is not satisfied.
To trouble shoot a process problem.A sample of recently trained line workers was
Selected.The number of hours of training time received and the time it took (in minutes)
For them to trouble shoot their last process problem were captured.A regression equation
Was fit to the data and the following histogram of residuals obtained.
Based on this histogram we can sayA)that the nearly normal condition is satisfied.
B)that the nearly normal condition is not satisfied.
C)that the equal spread condition is satisfied.
D)that the linearity condition is not satisfied.
E)that the independence condition is not satisfied.
Question
An operations manager was interested in determining if there is a relationship between the amount of training received by production line workers and the time it takes for them
To trouble shoot a process problem.A sample of recently trained line workers was
Selected.The number of hours of training time received and the time it took (in minutes)
For them to trouble shoot their last process problem were captured.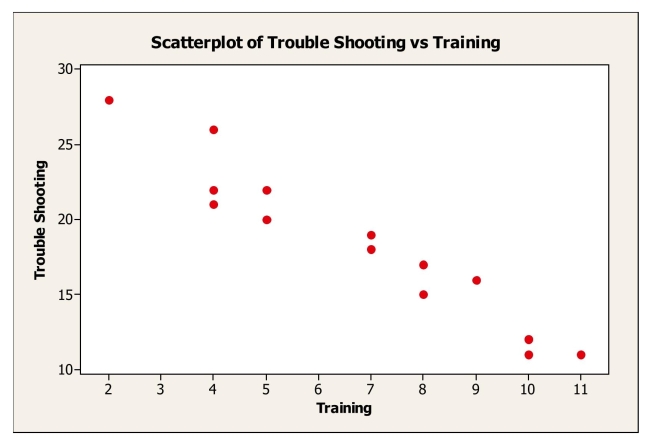 Based on the scatterplot of the data shown, we can say that
A)The slope of the regression line fit to these data will be positive.
B)The slope of the regression line fit to these data will be negative.
C)The linearity assumption is not satisfied.
D)The intercept of the regression line fit to these data will be negative.
E)The equal variance assumption is not satisfied.
To trouble shoot a process problem.A sample of recently trained line workers was
Selected.The number of hours of training time received and the time it took (in minutes)
For them to trouble shoot their last process problem were captured.
Based on the scatterplot of the data shown, we can say thatA)The slope of the regression line fit to these data will be positive.
B)The slope of the regression line fit to these data will be negative.
C)The linearity assumption is not satisfied.
D)The intercept of the regression line fit to these data will be negative.
E)The equal variance assumption is not satisfied.
Question
An operations manager was interested in determining if there is a relationship between the amount of training received by production line workers and the time it takes for them
To trouble shoot a process problem.A sample of recently trained line workers was
Selected.The number of hours of training time received and the time it took (in minutes)
For them to trouble shoot their last process problem were captured.The regression output
Is shown below.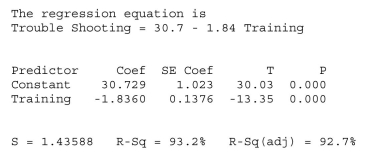 14-30 Chapter 14 Inference for Regression
At α = .05, we will
A)reject the null hypothesis.
B)not reject the null hypothesis.
C)will conclude that there is a significant relationship between amount of training
D)both A and C
To trouble shoot a process problem.A sample of recently trained line workers was
Selected.The number of hours of training time received and the time it took (in minutes)
For them to trouble shoot their last process problem were captured.The regression output
Is shown below.
14-30 Chapter 14 Inference for RegressionAt α = .05, we will
A)reject the null hypothesis.
B)not reject the null hypothesis.
C)will conclude that there is a significant relationship between amount of training
D)both A and C
Question

Unlock Deck
Sign up to unlock the cards in this deck!
Unlock Deck
Unlock Deck
1/18
Play
Full screen (f)
Deck 14: Inference for Regression
1
As the carbon content in steel increases, its ductility tends to decrease.A researcher at a steel company measures carbon content and ductility for a sample of 15 types of
Steel.The estimated regression equation fit to the data was found to be significant at α =
0)05.The 95% prediction interval for the ductility of steel with 0.5% carbon content was
Determined to be 0.45 to 11.59.The correct interpretation is
A)We can be 95% confident that the ductility of a particular type of steel with 0.5%
B)We can be 95% confident that the average ductility of all steel with 0.5% carbon
C)The ductility of steel with 0.5% carbon content will be between 45 and 11.59 most
D)95% of the time the average ductility of steel with 0.5% carbon content will be
E)We can be 95% confident that all steel with have ductility measurements between 0.45 and 11.59.
A
2
A sales manager was interested in determining if there is a relationship between college GPA and sales performance among salespeople hired within the last year.A
Sample of recently hired salespeople was selected the number of units each sold last
Month recorded.The regression results are shown below. Based on these results, the residual standard deviation is
A)3.256.
B)1.044.
C)1.574.
D)34.70.
E)None of the above.
Sample of recently hired salespeople was selected the number of units each sold last
Month recorded.The regression results are shown below.
Based on these results, the residual standard deviation isA)3.256.
B)1.044.
C)1.574.
D)34.70.
E)None of the above.
C
3
An operations manager was interested in determining if there is a relationship between the amount of training received by production line workers and the time it takes for them
To trouble shoot a process problem.A sample of recently trained line workers was
Selected.The number of hours of training time received and the time it took (in minutes)
For them to trouble shoot their last process problem were captured.A regression equation
Was fit to the data and the following residual plot obtained. Based on this plot, we can say
A)that the nearly normal condition is satisfied.
B)that the nearly normal condition is not satisfied.
C)that the equal spread condition is satisfied.
D)that the linearity condition is not satisfied.
E)that the independence condition is not satisfied.
To trouble shoot a process problem.A sample of recently trained line workers was
Selected.The number of hours of training time received and the time it took (in minutes)
For them to trouble shoot their last process problem were captured.A regression equation
Was fit to the data and the following residual plot obtained.
Based on this plot, we can sayA)that the nearly normal condition is satisfied.
B)that the nearly normal condition is not satisfied.
C)that the equal spread condition is satisfied.
D)that the linearity condition is not satisfied.
E)that the independence condition is not satisfied.
C
4
A researcher decides to investigate his students' suspicions that longer essays receive better scores on the SAT exam.He gathers data on the length of essays (number of lines)
And the SAT scores received for a sample of students enrolled at his university.Based on
14-26 Chapter 14 Inference for Regression
His regression results, the 95% confidence interval for the slope of the regression equation
Is -0.88 to 1.34.At α = 0.05, we can say
A)There is a statistically significant association between length of essays and SAT score.
B)The correlation between length of essays and SAT score is significant.
C)The slope of the regression equation is significantly different from zero.
D)The slope of the regression equation is not significantly different from zero.
E)The relationship between length of essays and SAT scores is significant and negative.
Unlock Deck
Unlock for access to all 18 flashcards in this deck.
Unlock Deck
k this deck
5
A sales manager was interested in determining if there is a relationship between college GPA and sales performance among salespeople hired within the last year.A
Sample of recently hired salespeople was selected the number of units each sold last
Month recorded.The correct null hypothesis is
Sample of recently hired salespeople was selected the number of units each sold last
Month recorded.The correct null hypothesis is
Unlock Deck
Unlock for access to all 18 flashcards in this deck.
Unlock Deck
k this deck
6
An operations manager was interested in determining if there is a relationship between the amount of training received by production line workers and the time it takes for them
To trouble shoot a process problem.A sample of 15 recently trained line workers was
Selected.The number of hours of training time received and the time it took (in minutes)
For them to trouble shoot their last process problem were captured.The regression output
Is shown below. The 95% confidence interval for the slope of the regression equation is
A)-4 to 0.32
B)-1.9776 to -1.7224
C)-2.1332 to -1.5388
D)-3.611 to -0.069
E)None of the above.
To trouble shoot a process problem.A sample of 15 recently trained line workers was
Selected.The number of hours of training time received and the time it took (in minutes)
For them to trouble shoot their last process problem were captured.The regression output
Is shown below.
The 95% confidence interval for the slope of the regression equation isA)-4 to 0.32
B)-1.9776 to -1.7224
C)-2.1332 to -1.5388
D)-3.611 to -0.069
E)None of the above.
Unlock Deck
Unlock for access to all 18 flashcards in this deck.
Unlock Deck
k this deck
7
As the carbon content in steel increases, its ductility tends to decrease.A researcher at a steel company measures carbon content and ductility for a sample of 15 types of steel.
Based on these data he obtained the following regression results. The 95% confidence interval for the slope of the regression equation is
A)-5.456 to -1.136
B)-4.393 to -2.199
C)6.164 to 9.178
D)-5.666 to -0.926
E)2.581 to 12.761
Based on these data he obtained the following regression results.
The 95% confidence interval for the slope of the regression equation isA)-5.456 to -1.136
B)-4.393 to -2.199
C)6.164 to 9.178
D)-5.666 to -0.926
E)2.581 to 12.761
Unlock Deck
Unlock for access to all 18 flashcards in this deck.
Unlock Deck
k this deck
8
A sales manager was interested in determining if there is a relationship between college GPA and sales performance among salespeople hired within the last year.A
Sample of recently hired salespeople was selected the number of units each sold last
Month recorded.The regression results shown are below. Based on these results, the percentage of variability in sales performance (units sold per
Month) accounted for by college GPA is
A)50.56%.
B)78.3%.
C)34.70%.
D)100%
E)None of the above.
Sample of recently hired salespeople was selected the number of units each sold last
Month recorded.The regression results shown are below.
Based on these results, the percentage of variability in sales performance (units sold perMonth) accounted for by college GPA is
A)50.56%.
B)78.3%.
C)34.70%.
D)100%
E)None of the above.
Unlock Deck
Unlock for access to all 18 flashcards in this deck.
Unlock Deck
k this deck
9
As the carbon content in steel increases, its ductility tends to decrease.A researcher at a steel company measures carbon content and ductility for a sample of 15 types of steel
Resulting in a correlation of -0.640.The calculated value of the t-statistic to test for a
Significant association between carbon content and ductility is
A)-3.01
B)4.692
C)-4.692
D)5.09
E)2.363
Resulting in a correlation of -0.640.The calculated value of the t-statistic to test for a
Significant association between carbon content and ductility is
A)-3.01
B)4.692
C)-4.692
D)5.09
E)2.363
Unlock Deck
Unlock for access to all 18 flashcards in this deck.
Unlock Deck
k this deck
10
As the carbon content in steel increases, its ductility tends to decrease.A researcher at a steel company measures carbon content and ductility for a sample of 15 types of steel.
Based on these data he obtained the following regression results. The standard error of the regression slope is
A)1.507
B)5.09
C)-3.296
D)2.36317
E)1.097
Based on these data he obtained the following regression results.
The standard error of the regression slope isA)1.507
B)5.09
C)-3.296
D)2.36317
E)1.097
Unlock Deck
Unlock for access to all 18 flashcards in this deck.
Unlock Deck
k this deck
11
Here is a plot of residuals versus fitted values: Based on the plot, we can say that
A)all conditions for inferences in regression are satisfied.
B)the equal spread condition is not satisfied.
C)the linearity condition is not satisfied.
D)the nearly normal condition is not satisfied.
E)the quantitative variables condition is not satisfied.
Based on the plot, we can say thatA)all conditions for inferences in regression are satisfied.
B)the equal spread condition is not satisfied.
C)the linearity condition is not satisfied.
D)the nearly normal condition is not satisfied.
E)the quantitative variables condition is not satisfied.
Unlock Deck
Unlock for access to all 18 flashcards in this deck.
Unlock Deck
k this deck
12
Here is a plot of residuals versus fitted values.
A)the equal spread condition is satisfied.
B)the equal spread condition is not satisfied.
C)the nearly normal condition is not satisfied.
D)the linearity condition is not satisfied.
E)the quantitative variables condition is not satisfied.
A)the equal spread condition is satisfied.
B)the equal spread condition is not satisfied.
C)the nearly normal condition is not satisfied.
D)the linearity condition is not satisfied.
E)the quantitative variables condition is not satisfied.
Unlock Deck
Unlock for access to all 18 flashcards in this deck.
Unlock Deck
k this deck
13
An operations manager was interested in determining if there is a relationship between the amount of training received by production line workers and the time it takes for them
To trouble shoot a process problem.A sample of recently trained line workers was
Selected.The number of hours of training time received and the time it took (in minutes)
For them to trouble shoot their last process problem were captured.The estimated
Regression equation fit to the data was found to be significant at α = 0.05.The 95%
Prediction interval for trouble shooting time with 8 hours of training was determined to
Be 12.822 to 19.261.The correct interpretation is
A)We can be 95% confident that the trouble shooting time by a particular line worker
B)We can be 95% confident that the average trouble shooting time by line workers
C)The troubleshooting time by a line worker who received 8 hours of training will be
D)95% of the time the average troubleshooting time is between 12.822 and 19.261
E)We can be 95% confident that troubleshooting times will be between 12.822 and 19.261 minutes.
Unlock Deck
Unlock for access to all 18 flashcards in this deck.
Unlock Deck
k this deck
14
A sales manager was interested in determining if there is a relationship between college GPA and sales performance among salespeople hired within the last year.A
Sample of recently hired salespeople was selected the number of units each sold last
Month recorded.The regression results are shown below. Based on these results, at α = .05 we will
A)reject the null hypothesis.
B)not reject the null hypothesis.
C)conclude that there is no significant relationship between GPA and sales performance.
Sample of recently hired salespeople was selected the number of units each sold last
Month recorded.The regression results are shown below.
Based on these results, at α = .05 we willA)reject the null hypothesis.
B)not reject the null hypothesis.
C)conclude that there is no significant relationship between GPA and sales performance.
Unlock Deck
Unlock for access to all 18 flashcards in this deck.
Unlock Deck
k this deck
15
An operations manager was interested in determining if there is a relationship between the amount of training received by production line workers and the time it takes for them
To trouble shoot a process problem.A sample of recently trained line workers was
Selected.The number of hours of training time received and the time it took (in minutes)
For them to trouble shoot their last process problem were captured.A regression equation
Was fit to the data and the following histogram of residuals obtained. Based on this histogram we can say
A)that the nearly normal condition is satisfied.
B)that the nearly normal condition is not satisfied.
C)that the equal spread condition is satisfied.
D)that the linearity condition is not satisfied.
E)that the independence condition is not satisfied.
To trouble shoot a process problem.A sample of recently trained line workers was
Selected.The number of hours of training time received and the time it took (in minutes)
For them to trouble shoot their last process problem were captured.A regression equation
Was fit to the data and the following histogram of residuals obtained.
Based on this histogram we can sayA)that the nearly normal condition is satisfied.
B)that the nearly normal condition is not satisfied.
C)that the equal spread condition is satisfied.
D)that the linearity condition is not satisfied.
E)that the independence condition is not satisfied.
Unlock Deck
Unlock for access to all 18 flashcards in this deck.
Unlock Deck
k this deck
16
An operations manager was interested in determining if there is a relationship between the amount of training received by production line workers and the time it takes for them
To trouble shoot a process problem.A sample of recently trained line workers was
Selected.The number of hours of training time received and the time it took (in minutes)
For them to trouble shoot their last process problem were captured. Based on the scatterplot of the data shown, we can say that
A)The slope of the regression line fit to these data will be positive.
B)The slope of the regression line fit to these data will be negative.
C)The linearity assumption is not satisfied.
D)The intercept of the regression line fit to these data will be negative.
E)The equal variance assumption is not satisfied.
To trouble shoot a process problem.A sample of recently trained line workers was
Selected.The number of hours of training time received and the time it took (in minutes)
For them to trouble shoot their last process problem were captured.
Based on the scatterplot of the data shown, we can say thatA)The slope of the regression line fit to these data will be positive.
B)The slope of the regression line fit to these data will be negative.
C)The linearity assumption is not satisfied.
D)The intercept of the regression line fit to these data will be negative.
E)The equal variance assumption is not satisfied.
Unlock Deck
Unlock for access to all 18 flashcards in this deck.
Unlock Deck
k this deck
17
An operations manager was interested in determining if there is a relationship between the amount of training received by production line workers and the time it takes for them
To trouble shoot a process problem.A sample of recently trained line workers was
Selected.The number of hours of training time received and the time it took (in minutes)
For them to trouble shoot their last process problem were captured.The regression output
Is shown below. 14-30 Chapter 14 Inference for Regression
At α = .05, we will
A)reject the null hypothesis.
B)not reject the null hypothesis.
C)will conclude that there is a significant relationship between amount of training
D)both A and C
To trouble shoot a process problem.A sample of recently trained line workers was
Selected.The number of hours of training time received and the time it took (in minutes)
For them to trouble shoot their last process problem were captured.The regression output
Is shown below.
14-30 Chapter 14 Inference for RegressionAt α = .05, we will
A)reject the null hypothesis.
B)not reject the null hypothesis.
C)will conclude that there is a significant relationship between amount of training
D)both A and C
Unlock Deck
Unlock for access to all 18 flashcards in this deck.
Unlock Deck
k this deck
18
A sales manager was interested in determining if there is a relationship between college GPA and sales performance (number of units sold in the previous month) among
Salespeople hired within the last year.The estimated regression equation fit to the data
Was found to be significant at α = 0.05.The 95% confidence interval for the number of
Units sold when GPA = 3.00 was determined to be 20.914 to 22.657.The correct
Interpretation is
A)We can be 95% confident that the number of units sold per month by a particular
B)We can be 95% confident that the average number of units sold per month by
C)The number of units sold per month by a salesperson with a college GPA of 3.00 will
D)95% of the time the average number of units sold per month will be between 20.914
E)We can be 95% confident that each month between 20.914 and 22.657 units will be
Unlock Deck
Unlock for access to all 18 flashcards in this deck.
Unlock Deck
k this deck
Unlock Deck
Unlock for access to all 18 flashcards in this deck.


