Deck 9: Estimation and Confidence Intervals
Full screen (f)
Question
Question
Question
Question
Question
Question
Question
Question
Question
Question
Question
Question
Question
Question
Question
Question
Question
Question
Question
Question
Question
Question
Question
Question
Question
Question
Question
Question
Question
Question
Question
Question
Question
Question
Question
Question
Question
Question
Question
Question
Question
Question
Question
Question
Question
Question
Question
Question
Question
Question
Question
Question
Question
Question
Question
Question
Question
Question
Question
Question
A nationwide survey of college students was conducted and found that students spend two hours
Per class hour studying. A professor at your school wants to determine whether the time students
Spend at your school is significantly different from the two hours. A random sample of fifteen
Statistics students is carried out and the findings indicate an average of 1.75 hours with a standard
Deviation of 0.24 hours.
Given the following printout, what can you determine?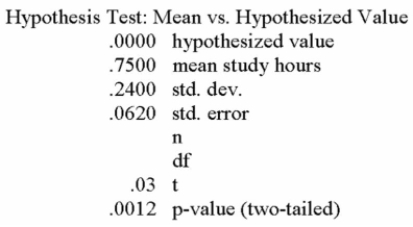
A) The alternate hypothesis is μ ≤ 2
B) You should accept the null hypothesis at the 0.05 level of significance.
C) There is less than a 1% chance of getting these results if the null hypothesis is true, so you have very strong evidence to suggest that the average number of study hours is different
From 2.
D) You should reject the null hypothesis at the 0.05 level of significance, but accept it when testing at the 0.01 level of significance.
E) You should accept the null hypothesis at the 0.05 level of significance, but reject it when testing at the 0.01 level of significance.
Question
Question
Question
Question
The mean weight of newborn infants at a community hospital is said to be 6.6 pounds. A sample of
Seven infants is randomly selected and their weights at birth are recorded as 9.0, 7.3, 6.0, 8.8, 6.8,
8)4, and 6.6 pounds. Does this sample support the original claim?
What is the decision for a statistical significant change in average weights at birth at the 5% level of
Significance?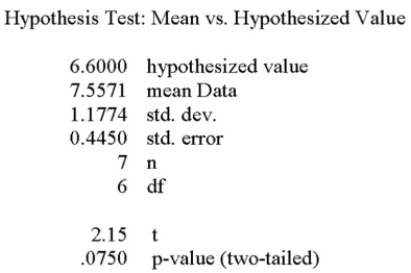
A) Fail to reject the null hypothesis and conclude the mean is 6.6 lb.
B) Reject the null hypothesis and conclude the mean is higher than 6.6 lb.
C) Reject the null hypothesis and conclude the mean is lower than 6.6 lb.
D) Cannot calculate because population standard deviation is unknown.
Question
Question
Question
Question
The printout below refers to the weekly closing stock prices for Air Canada on 20 randomly
Selected weeks in 2000.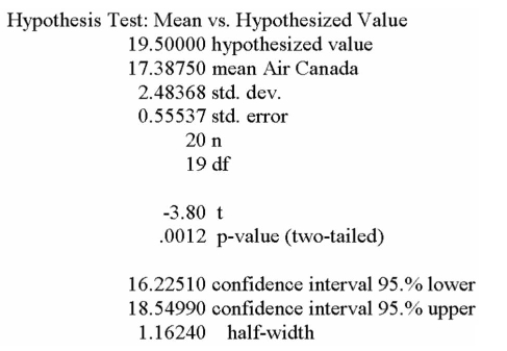
Using a 5% level of significance, can you say that the average Air Canada stock price was different
From $19.50?
A) Fail to reject the null hypothesis and conclude the mean stock price was $19.50.
B) Reject the null hypothesis and conclude the mean stock price was lower than $19.50.
C) Reject the null hypothesis and conclude the mean index was greater than $19.50.
D) Reject the null hypothesis and conclude the mean index was different from $19.50.
Question
Question
The mean weight of newborn infants at a community hospital is said to be 6.6 pounds. A sample of
Seven infants is randomly selected and their weights at birth are recorded as 9.0, 7.3, 6.0, 8.8, 6.8,
8)4, and 6.6 pounds. Does this sample support the original claim? What is the decision for a
Significant increase in the average birthrate at a 5% level of significance?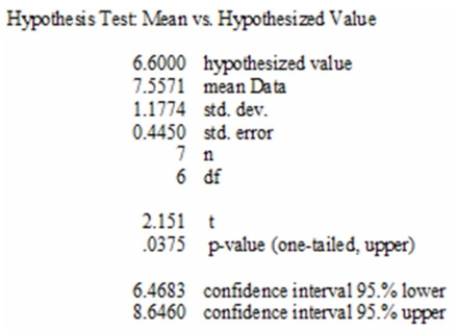
A) Fail to reject the null hypothesis and conclude the mean is 6.6 lb.
B) Reject the null hypothesis and conclude the mean is lower than 6.6 lb.
C) Reject the null hypothesis and conclude the mean is greater than 6.6 lb.
D) Cannot calculate because population standard deviation is unknown.
Question
Question
Question
Question
Question
Question
Question
Question
The following summarizes the average of the TSE 300 Index at the end of 20 randomly selected
Weeks in 2000.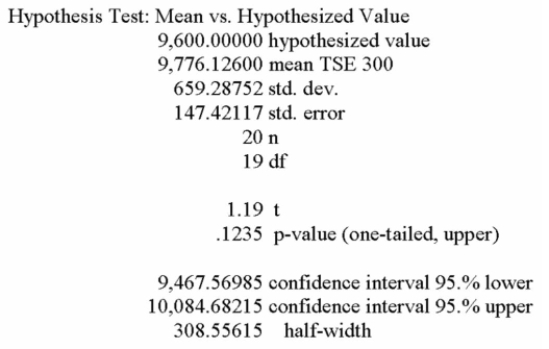
Using a 5% level of significance, can it be agreed that the Index average was more than $9,600
During the year 2000?
A) Fail to reject the null hypothesis and conclude the mean index was 9,600.
B) Reject the null hypothesis and conclude the mean index was lower than 9,600.
C) Reject the null hypothesis and conclude the mean index was greater than 9,600.
D) Reject the null hypothesis and conclude the mean index was different from 9,600.
Question
Question

Unlock Deck
Sign up to unlock the cards in this deck!
Unlock Deck
Unlock Deck
1/140
Play
Full screen (f)
Deck 9: Estimation and Confidence Intervals
1
i. Two examples of a hypothesis are:
1) mean monthly income from all sources for senior citizens is $841 and
2) twenty percent of juvenile offenders ultimately are caught and sentenced to prison.
ii. Since there is more variability in sample means computed from smaller samples, we have more
Confidence in the resulting estimates and are less apt to reject null hypothesis.
iii. We call a statement about the value of a population parameter a hypothesis.
A) (i), (ii), and (iii) are all correct statements.
B) (i) is a correct statement but not (ii) or (iii).
C) (i) and (iii) are correct statements but not (ii).
D) (i) and (ii) are correct statements but not (iii).
E) (i), (ii), and (iii) are all false statements.
(i) and (iii) are correct statements but not (ii).
2
The average cost of tuition, room and board at community colleges is reported to be $11,500 per
Year, but a financial administrator believes that the average cost is higher. A study conducted using
150 community colleges showed that the average cost per year is $12,000 with a standard
Deviation of $1,200. Let α = 0.05.
What are the null and alternative hypotheses for this study?
A) Null: μ ≤ $12,000; alternative: μ > $12,000
B) Null: μ ≤ $12,000; alternative: μ < $12,000
C) Null: μ ≤ $11,500; alternative: μ > $11,500
D) Null: μ ≤ $11,500; alternative: μ < $11,500
Null: μ ≤ $11,500; alternative: μ > $11,500
3
i. Two examples of a hypothesis are:
1) mean monthly income from all sources for senior citizens is $841 and
2) twenty percent of juvenile offenders ultimately are caught and sentenced to prison.
ii. Since there is more variability in sample means computed from smaller samples, we have more
Confidence in the resulting estimates and are less apt to reject null hypothesis.
iii. The test statistic for a problem where the population standard deviation is unknown is the
Student's t distribution.
A) (i), (ii), and (iii) are all correct statements.
B) (i) is a correct statement but not (ii) or (iii).
C) (i) and (iii) are correct statements but not (ii).
D) (i) and (ii) are correct statements but not (iii).
E) (i), (ii), and (iii) are all false statements.
(i) and (iii) are correct statements but not (ii).
4
i. An alternate hypothesis is a statement about a population parameter that is accepted when the
Null hypothesis is rejected.
ii. The level of significance is the risk we assume of rejecting the null hypothesis when it is actually
True.
iii. There is only one level of significance that is applied to all studies involving sampling.
A) (i), (ii), and (iii) are all correct statements.
B) (i) is a correct statement but not (ii) or (iii).
C) (i) and (iii) are correct statements but not (ii).
D) (i) and (ii) are correct statements but not (iii).
E) (i), (ii), and (iii) are all false statements.
Unlock Deck
Unlock for access to all 140 flashcards in this deck.
Unlock Deck
k this deck
5
i. To prevent bias, the level of significance is selected before setting up the decision rule and
Sampling the population.
ii. The fifth and final step in testing a hypothesis is taking a sample and, based on the decision rule,
Deciding if the null hypothesis should be rejected.
iii. When the null hypothesis is not rejected, the conclusion is that our sample data does not allow
Us to reject the null hypothesis.
A) (i), (ii), and (iii) are all correct statements.
B) (i) is a correct statement but not (ii) or (iii).
C) (i) and (iii) are correct statements but not (ii).
D) (i) and (ii) are correct statements but not (iii).
E) (i), (ii), and (iii) are all false statements.
Unlock Deck
Unlock for access to all 140 flashcards in this deck.
Unlock Deck
k this deck
6
i. Two examples of a hypothesis are:
1) mean monthly income from all sources for senior citizens is $841 and
2) twenty percent of juvenile offenders ultimately are caught and sentenced to prison.
ii. Hypothesis testing is a procedure based on sample evidence and probability theory to decide
Whether the hypothesis is a reasonable statement.
iii. Since there is more variability in sample means computed from smaller samples, we have more
Confidence in the resulting estimates and are less apt to reject null hypothesis.
A) (i), (ii), and (iii) are all correct statements.
B) (i) is a correct statement but not (ii) or (iii).
C) (i) and (iii) are correct statements but not (ii).
D) (i) and (ii) are correct statements but not (iii).
E) (i), (ii), and (iii) are all false statements.
Unlock Deck
Unlock for access to all 140 flashcards in this deck.
Unlock Deck
k this deck
7
i. Two types of possible errors always exist when testing hypotheses-a Type I error, in which the
Null hypothesis is rejected when it should not have been rejected, and a Type II error in which the
Null hypothesis is not rejected when it should have been rejected.
ii. A test statistic is a value determined from sample information collected to test the null hypothesis.
iii. If we do not reject the null hypothesis based on sample evidence, we have proven beyond doubt
That the null hypothesis is true.
A) (i), (ii), and (iii) are all correct statements.
B) (i) is a correct statement but not (ii) or (iii).
C) (i) and (iii) are correct statements but not (ii).
D) (i) and (ii) are correct statements but not (iii).
E) (i), (ii), and (iii) are all false statements.
Unlock Deck
Unlock for access to all 140 flashcards in this deck.
Unlock Deck
k this deck
8
i. The level of significance is the risk we assume of rejecting the null hypothesis when it is actually
True.
ii. There is only one level of significance that is applied to all studies involving sampling.
iii. The researcher must decide on the level of significance before formulating a decision rule and
Collecting sample data.
A) (i), (ii), and (iii) are all correct statements.
B) (i) is a correct statement but not (ii) or (iii).
C) (i) and (iii) are correct statements but not (ii).
D) (i) and (ii) are correct statements but not (iii).
E) (i), (ii), and (iii) are all false statements.
Unlock Deck
Unlock for access to all 140 flashcards in this deck.
Unlock Deck
k this deck
9
i. Two types of possible errors always exist when testing hypotheses-a Type I error, in which the
Null hypothesis is rejected when it should not have been rejected, and a Type II error in which the
Null hypothesis is not rejected when it should have been rejected.
ii. A test statistic is a value determined from sample information collected to test the null hypothesis.
iii. The region or area of rejection defines the location of all those values that are so large or so
Small that the probability of their occurrence under a true null hypothesis is rather remote.
A) (i), (ii), and (iii) are all correct statements.
B) (i) is a correct statement but not (ii) or (iii).
C) (i) and (iii) are correct statements but not (ii).
D) (i) and (ii) are correct statements but not (iii).
E) (i), (ii), and (iii) are all false statements.
Unlock Deck
Unlock for access to all 140 flashcards in this deck.
Unlock Deck
k this deck
10
The null hypothesis makes a claim about what value?
A) Population parameter
B) Sample statistic
C) Sample mean
D) Type II error
A) Population parameter
B) Sample statistic
C) Sample mean
D) Type II error
Unlock Deck
Unlock for access to all 140 flashcards in this deck.
Unlock Deck
k this deck
11
i. To prevent bias, the level of significance is selected before setting up the decision rule and
Sampling the population.
ii. The level of significance is the probability that a true hypothesis is rejected.
iii. If the critical values of the test statistic z are ±1.96, they are the dividing points between the areas
Of rejection and non-rejection.
A) (i), (ii), and (iii) are all correct statements.
B) (i) is a correct statement but not (ii) or (iii).
C) (i) and (iii) are correct statements but not (ii).
D) (i) and (ii) are correct statements but not (iii).
E) (ii) and (iii) are correct statements but not (i).
Unlock Deck
Unlock for access to all 140 flashcards in this deck.
Unlock Deck
k this deck
12
i. To set up a decision rule, the sampling distribution is divided into two regions-a region of non-
Rejection and a region where the null hypothesis is rejected.
ii. A test statistic is a value determined from sample information collected to test the null hypothesis.
iii. If the null hypothesis is true and the researchers do not reject it, then a correct decision has been
Made.
A) (i), (ii), and (iii) are all correct statements.
B) (i) is a correct statement but not (ii) or (iii).
C) (i) and (iii) are correct statements but not (ii).
D) (i) and (ii) are correct statements but not (iii).
E) (i), (ii), and (iii) are all false statements.
Unlock Deck
Unlock for access to all 140 flashcards in this deck.
Unlock Deck
k this deck
13
i. An alternate hypothesis is a statement about a population parameter that is accepted when the
Null hypothesis is rejected.
ii. The level of significance is the risk we assume of rejecting the null hypothesis when it is actually
True.
iii. The researcher must decide on the level of significance before formulating a decision rule and
Collecting sample data.
A) (i), (ii), and (iii) are all correct statements.
B) (i) is a correct statement but not (ii) or (iii).
C) (i) and (iii) are correct statements but not (ii).
D) (i) and (ii) are correct statements but not (iii).
E) (i), (ii), and (iii) are all false statements.
Unlock Deck
Unlock for access to all 140 flashcards in this deck.
Unlock Deck
k this deck
14
i. Two examples of a hypothesis are: 1) mean monthly income from all sources for senior citizens is
$841 and 2) twenty percent of juvenile offenders ultimately are caught and sentenced to prison.
ii. Hypothesis testing is a procedure based on sample evidence and probability theory to decide
Whether the hypothesis is a reasonable statement.
iii. We call a statement about the value of a population parameter a hypothesis.
A) (i), (ii), and (iii) are all correct statements.
B) (i) is a correct statement but not (ii) or (iii).
C) (i) and (iii) are correct statements but not (ii).
D) (i) and (ii) are correct statements but not (iii).
E) (i), (ii), and (iii) are all false statements.
Unlock Deck
Unlock for access to all 140 flashcards in this deck.
Unlock Deck
k this deck
15
i. The fifth and final step in testing a hypothesis is taking a sample and, based on the decision rule,
Deciding if the null hypothesis should be rejected.
ii. When the null hypothesis is not rejected, the conclusion is that our sample data does not allow us
To reject the null hypothesis.
iii. The level of significance is selected after setting up a decision rule and sampling the population.
A) (i), (ii), and (iii) are all correct statements.
B) (i) is a correct statement but not (ii) or (iii).
C) (i) and (iii) are correct statements but not (ii).
D) (i) and (ii) are correct statements but not (iii).
E) (i), (ii), and (iii) are all false statements.
Unlock Deck
Unlock for access to all 140 flashcards in this deck.
Unlock Deck
k this deck
16
i. Two examples of a hypothesis are: 1) mean monthly income from all sources for senior citizens is
$841 and 2) twenty percent of juvenile offenders ultimately are caught and sentenced to prison.
ii. Hypothesis testing is a procedure based on sample evidence and probability theory to decide
Whether the hypothesis is a reasonable statement.
iii. The test statistic for a problem involving an unknown population standard deviation is the
Student's t distribution.
A) (i), (ii), and (iii) are all correct statements.
B) (i) is a correct statement but not (ii) or (iii).
C) (i) and (iii) are correct statements but not (ii).
D) (i) and (ii) are correct statements but not (iii).
E) (i), (ii), and (iii) are all false statements.
Unlock Deck
Unlock for access to all 140 flashcards in this deck.
Unlock Deck
k this deck
17
It is claimed that in a bushel of peaches less than ten percent are defective. A sample of 400
Peaches is examined and 50 are found to be defective.
If α = 0.025, what will be the decision?
A) Fail to reject the null and conclude the defects are not greater than 10%
B) Reject the null and conclude the defects are not greater than 10%
C) Reject the null and conclude the defects are greater than 10%
D) Fail to reject the null and conclude the defects are not less than 10%
Unlock Deck
Unlock for access to all 140 flashcards in this deck.
Unlock Deck
k this deck
18
Which of the following does NOT hold true for the t distribution?
A) Confidence intervals will be wider than for large samples.
B) The region of acceptance will be larger than for large samples.
C) A larger computed t value will be needed to reject the null hypothesis than for large samples using z.
D) There is only one t distribution.
A) Confidence intervals will be wider than for large samples.
B) The region of acceptance will be larger than for large samples.
C) A larger computed t value will be needed to reject the null hypothesis than for large samples using z.
D) There is only one t distribution.
Unlock Deck
Unlock for access to all 140 flashcards in this deck.
Unlock Deck
k this deck
19
i. The first step in testing a hypothesis is to state the decision rule.
ii. To prevent bias, the level of significance is selected before setting up the decision rule and
Sampling the population.
iii. The fifth and final step in testing a hypothesis is taking a sample and, based on the decision rule,
Deciding if the null hypothesis should be rejected.
A) (i), (ii), and (iii) are all correct statements.
B) (i) is a correct statement but not (ii) or (iii).
C) (i) and (iii) are correct statements but not (ii).
D) (i) and (ii) are correct statements but not (iii).
E) (ii) and (iii) are correct statements but not (i).
Unlock Deck
Unlock for access to all 140 flashcards in this deck.
Unlock Deck
k this deck
20
i. If we do not reject the null hypothesis based on sample evidence, we have proven beyond doubt
That the null hypothesis is true.
ii. A test statistic is a value determined from sample information collected to test the null hypothesis.
iii. The region or area of rejection defines the location of all those values that are so large or so
Small that the probability of their occurrence under a true null hypothesis is rather remote.
A) (ii) and (iii) are correct statements but not (i).
B) (i) is a correct statement but not (ii) or (iii).
C) (i) and (iii) are correct statements but not (ii).
D) (i) and (ii) are correct statements but not (iii).
E) (i), (ii), and (iii) are all false statements.
Unlock Deck
Unlock for access to all 140 flashcards in this deck.
Unlock Deck
k this deck
21
It is claimed that in a bushel of peaches less than ten percent are defective. A sample of 400
Peaches is examined and 50 are found to be defective. What is the alternate hypothesis for a one-
Sided test?
A) p ≠ 0.10
B) p > 0.10
C) p ≤ 0.10
D) p = 0.10
E) p < 0.10
Peaches is examined and 50 are found to be defective. What is the alternate hypothesis for a one-
Sided test?
A) p ≠ 0.10
B) p > 0.10
C) p ≤ 0.10
D) p = 0.10
E) p < 0.10
Unlock Deck
Unlock for access to all 140 flashcards in this deck.
Unlock Deck
k this deck
22
A nationwide survey of college students was conducted and found that students spend two hours
Per class hour studying. A professor at your school wants to determine whether the time students
Spend at your school is significantly different from the two hours. A random sample of fifteen
Statistics students is carried out and the findings indicate an average of 1.75 hours with a standard
Deviation of 0.24 hours.
A) H0 is μ ≠ 2. H1 is μ = 2.
B) H0 is μ = 2. H1 is μ ≠ 2.
C) H0 is μ = 2. H1 is μ > 2.
D) H0 is μ = 2. H1 is μ < 2.
E) H0 is μ ≠ 2. H1 is μ > 2.
Unlock Deck
Unlock for access to all 140 flashcards in this deck.
Unlock Deck
k this deck
23
The mean gross annual incomes of certified tack welders are normally distributed with the mean of
$50,000 and a standard deviation of $4,000. The ship building association wishes to find out
Whether their tack welders earn more or less than $50,000 annually. The alternate hypothesis is
That the mean is not $50,000.
Which of the following is the alternate hypothesis?
A) p ≠ $50,000
B) μ ≠ $50,000
C) μ < $50,000
D) μ = $50,000
E) p = $50,000
Unlock Deck
Unlock for access to all 140 flashcards in this deck.
Unlock Deck
k this deck
24
From past records it is known that the average life of a battery used in a digital clock is 305 days.
The battery life is normally distributed. The battery was recently modified to last longer. A sample of
20 of the modified batteries was tested. It was discovered that the mean life was 311 days and the
Sample standard deviation was 12 days. We want to test at the 0.05 level of significance whether
The modification increases the life of the battery. What is our decision rule?
A) Do not reject the null hypothesis if computed t is 1.96 or greater
B) Reject the null hypothesis if computed t is less than 1.96
C) Do not reject the null hypothesis if computed t is 1.729 or greater
D) Reject the null hypothesis if computed t is 2.086 or greater
E) Reject the null hypothesis if the computed t is 1.729 or greater
Unlock Deck
Unlock for access to all 140 flashcards in this deck.
Unlock Deck
k this deck
25
If the alternate hypothesis states that μ does not equal 4,000, what is the rejection region for the
Hypothesis test?
A) Both tails
B) Lower or left tail
C) Upper or right tail
D) Center
Hypothesis test?
A) Both tails
B) Lower or left tail
C) Upper or right tail
D) Center
Unlock Deck
Unlock for access to all 140 flashcards in this deck.
Unlock Deck
k this deck
26
If the alternative hypothesis states that μ > 6,700, what is the rejection region for the hypothesis
Test?
A) Both tails
B) Lower tail
C) Upper tail
D) Center
Test?
A) Both tails
B) Lower tail
C) Upper tail
D) Center
Unlock Deck
Unlock for access to all 140 flashcards in this deck.
Unlock Deck
k this deck
27
A nationwide survey of college students was conducted and found that students spend two hours
Per class hour studying. A professor at your school wants to determine whether the time students
Spend at your school is significantly different from the two hours. A random sample of fifteen
Statistics students is carried out and the findings indicate an average of 1.75 hours with a standard
Deviation of 0.24 hours.
Test at the 5% level of significance.
A) The critical value of t is -4.03. The calculated value of t is ±2.145.
B) The critical value of t is ±2.145. The calculated value of t is -4.03.
C) The critical value of t is 1.761. The calculated value of t is -4.03.
D) The critical value of t is ±1.761. The calculated value of t is -1.041.
E) The t-test should not be used. Rather, use the z-test.
Unlock Deck
Unlock for access to all 140 flashcards in this deck.
Unlock Deck
k this deck
28
A restaurant that bills its house account monthly is concerned that the average monthly bill exceeds
$200 per account. A random sample of twelve accounts is selected, resulting in a sample mean of
$220 and a standard deviation of $12. The t-test is to be conducted at the 5% level of significance.
A) The critical value of t is +1.796. The calculated value of t is +5.77.
B) The critical value of t is -1.796. The calculated value of t is -5.77.
C) The critical value of t is +2.201. The calculated value of t is +5.77.
D) The critical value of t is +2.201. The calculated value of t is +1.40.
E) The critical value of t is +2.201. The calculated value of t is -5.77.
Unlock Deck
Unlock for access to all 140 flashcards in this deck.
Unlock Deck
k this deck
29
i. If the null hypothesis is μ ≥ 200 and the alternate hypothesis states that μ is less than 200, then, a
Two-tail test is being conducted.
ii. For a one-tailed test of hypothesis, the area of rejection is only in one tail of the curve.
iii. As the sample size increases, the curve of the t-distribution approaches the standard normal
Distribution
A) (i), (ii), and (iii) are all correct statements.
B) (i) is a correct statement but not (ii) or (iii).
C) (i) and (iii) are correct statements but not (ii).
D) (ii) and (iii) are correct statements but not (i).
E) (i), (ii), and (iii) are all false statements.
Unlock Deck
Unlock for access to all 140 flashcards in this deck.
Unlock Deck
k this deck
30
What are the two rejection areas in using a two-tailed test and the 0.01 level of significance when
The population standard deviation is known?
A) Above 1.96 and below -1.96
B) Above 1.65 and below -1.65
C) Above 2.58 and below -2.58
D) Above 1.00 and below -1.00
The population standard deviation is known?
A) Above 1.96 and below -1.96
B) Above 1.65 and below -1.65
C) Above 2.58 and below -2.58
D) Above 1.00 and below -1.00
Unlock Deck
Unlock for access to all 140 flashcards in this deck.
Unlock Deck
k this deck
31
What are the critical z-values for a two-tailed hypothesis test if α = 0.01?
A) ±1.96
B) ±2.33
C) ±2.58
D) ±1.65
A) ±1.96
B) ±2.33
C) ±2.58
D) ±1.65
Unlock Deck
Unlock for access to all 140 flashcards in this deck.
Unlock Deck
k this deck
32
A restaurant that bills its house account monthly is concerned that the average monthly bill exceeds
$200 per account. A random sample of twelve accounts is selected, resulting in a sample mean of
$220 and a standard deviation of $12. The t-test is to be conducted at the 5% level of significance.
The t-value is calculated to be 5.77. At the 0.01 level of significance, what is your decision?
A) You reject the null hypothesis, and agree that the average monthly bill exceeds $200.
B) You have insufficient evidence to reject the null hypothesis.
C) You reject the alternate hypothesis and agree that the average monthly bill is less than $200.
D) You should have used the z-test.
Unlock Deck
Unlock for access to all 140 flashcards in this deck.
Unlock Deck
k this deck
33
What do we call the statement that determines if the null hypothesis is rejected?
A) Decision rule
B) Test statistic
C) Alternate hypothesis
D) Critical value
A) Decision rule
B) Test statistic
C) Alternate hypothesis
D) Critical value
Unlock Deck
Unlock for access to all 140 flashcards in this deck.
Unlock Deck
k this deck
34
What is the critical value for a one-tailed hypothesis test in which a null hypothesis is tested at the
5% level of significance based on a sample size of 25 and an unknown population standard
Deviation?
A) 1.708
B) 1.711
C) 2.060
D) 2.064
5% level of significance based on a sample size of 25 and an unknown population standard
Deviation?
A) 1.708
B) 1.711
C) 2.060
D) 2.064
Unlock Deck
Unlock for access to all 140 flashcards in this deck.
Unlock Deck
k this deck
35
Which of the following is NOT one of the five steps in the hypothesis testing procedure?
A) Formulate a decision rule
B) State the null and alternate hypotheses
C) Select a level for β
D) Identify the test statistic
A) Formulate a decision rule
B) State the null and alternate hypotheses
C) Select a level for β
D) Identify the test statistic
Unlock Deck
Unlock for access to all 140 flashcards in this deck.
Unlock Deck
k this deck
36
i. For a one-tailed test using the 0.05 level of significance, the critical value for the z test is 1.645, but
For t it is 1.96.
ii. For a one-tailed test using the 0.01 level of significance, the critical value for the z-test is 1.645, but
For t it is 1.96.
iii. For a two-tailed test using the 0.05 level of significance the critical value for the z-test is 1.96 and
It is the same for the t-test.
A) (i), (ii), and (iii) are all correct statements.
B) (i) is a correct statement but not (ii) or (iii).
C) (i) and (iii) are correct statements but not (ii).
D) (ii) and (iii) are correct statements but not (i).
E) (i), (ii), and (iii) are all false statements.
For t it is 1.96.
ii. For a one-tailed test using the 0.01 level of significance, the critical value for the z-test is 1.645, but
For t it is 1.96.
iii. For a two-tailed test using the 0.05 level of significance the critical value for the z-test is 1.96 and
It is the same for the t-test.
A) (i), (ii), and (iii) are all correct statements.
B) (i) is a correct statement but not (ii) or (iii).
C) (i) and (iii) are correct statements but not (ii).
D) (ii) and (iii) are correct statements but not (i).
E) (i), (ii), and (iii) are all false statements.
Unlock Deck
Unlock for access to all 140 flashcards in this deck.
Unlock Deck
k this deck
37
Records on a fleet of trucks reveal that the average life of a set of spark plugs is normally
Distributed with a mean of 35,600 kilometres. A manufacturer of spark plugs claims that its plugs
Have an average life in excess of 35,600 kilometres. The fleet owner purchased 18 sets and found
That the sample average life was 37,700 kilometres, the sample standard deviation was 2415
Kilometres and the computed t = 3.677.
A) Based on these findings, there is enough evidence to accept the manufacturer's claim at the 0.05 level.
B) Based on these findings, there is NOT enough evidence to accept the manufacturer's claim at the 0.05 level.
C) Based on these findings, there is enough evidence to accept the manufacturer's claim at the 0.05 level, but NOT at the 0.01 level.
D) Based on these findings, there is NOT enough evidence to accept the manufacturer's claim at the 0.01 level.
E) Based on these findings, there in NOT enough evidence to accept the manufacturer's claim at either the 0.05 or the 0.01 level.
Unlock Deck
Unlock for access to all 140 flashcards in this deck.
Unlock Deck
k this deck
38
The mean length of a small counter balance bar is 43 millimeters. There is concern that the
Adjustments of the machine producing the bars have changed. Test the claim at the 0.02 level that
There has been no change in the mean length. The alternate hypothesis is that there has been a
Change. Twelve bars (n = 12) were selected at random and their lengths recorded. The lengths are
(in millimeters) 42, 39, 42, 45, 43, 40, 39, 41, 40, 42, 43 and 42. The mean of the sample is 41.5 and
The standard deviation 1.784. Computed t = -2.913. Has there been a statistically significant change
In the mean length of the bars?
A) Yes, because the computed t lies in the area beyond the critical.
B) No, because the information given is not complete.
C) No, because the computed t lies in the area to the right of -2.718.
Unlock Deck
Unlock for access to all 140 flashcards in this deck.
Unlock Deck
k this deck
39
A random sample of size 15 is selected from a normal population. The population standard deviation
Is unknown. Assume that a two-tailed test at the 0.10 significance level is to be used. For what value
Of t will the null hypothesis be rejected?
A) To the left of -1.282 or to the right of 1.282
B) To the left of -1.345 or to the right of 1.345
C) To the left of -1.761 or to the right of 1.761
D) To the left of -1.645 or to the right of 1.645
Unlock Deck
Unlock for access to all 140 flashcards in this deck.
Unlock Deck
k this deck
40
A restaurant that bills its house account monthly is concerned that the average monthly bill exceeds
$200 per account. A random sample of twelve accounts is selected, resulting in a sample mean of
$220 and a standard deviation of $12. The t-test is to be conducted at the 5% level of significance.
A) The null hypothesis is μ ≤ 200. The alternate hypothesis is μ ≤ 200.
B) The null hypothesis is μ ≤ 200. The alternate hypothesis is μ > 200.
C) The null hypothesis is μ = 200. The alternate hypothesis is μ ≠ 200.
D) The null hypothesis is μ > 200. The alternate hypothesis is μ ≤ 200
E) The null hypothesis is μ ≤ 220. The alternate hypothesis is μ > 220.
Unlock Deck
Unlock for access to all 140 flashcards in this deck.
Unlock Deck
k this deck
41
The mean gross annual incomes of certified tack welders are normally distributed with the mean of
$50,000 and a standard deviation of $4,000. The ship building association wishes to find out
Whether their tack welders earn more or less than $50,000 annually. The alternate hypothesis is
That the mean is not $50,000.
If the level of significance is 0.10, what is the critical value?
A) 1.65
B) 2.58
C) 1.28
D) ±1.28
E) ±1.645
Unlock Deck
Unlock for access to all 140 flashcards in this deck.
Unlock Deck
k this deck
42
A manufacturer wants to increase the absorption capacity of a sponge. Based on past data, the
Average sponge could absorb 103.5ml. After the redesign, the absorption amounts of a sample of
Sponges were (in millilitres): 121.3, 109.2, 97.6, 103.5, 112.4, 115.3, 106.5, 112.4, 118.3, and 115.3. What is
The decision rule at the 0.01 level of significance to test if the new design increased the absorption
Amount of the sponge?
A) Do not reject null hypothesis if computed t is less than 2.580
B) Do not reject null hypothesis if computed t is less than 2.821
C) Reject null hypothesis if computed z is 1.96 or larger
D) Reject null hypothesis if computed t is less than 2.764
Unlock Deck
Unlock for access to all 140 flashcards in this deck.
Unlock Deck
k this deck
43
Which of the following is a test statistic used to test a hypothesis about a population?
A) α
B) β
C) μ
D) z
A) α
B) β
C) μ
D) z
Unlock Deck
Unlock for access to all 140 flashcards in this deck.
Unlock Deck
k this deck
44
A machine is set to fill the small size packages of Smarties candies with 56 candies per bag. A
Sample revealed: 3 bags of 56, 2 bags of 57, 1 bag of 55, and 2 bags of 58. How many degrees of
Freedom are there?
A) 9
B) 1
C) 8
D) 7
Sample revealed: 3 bags of 56, 2 bags of 57, 1 bag of 55, and 2 bags of 58. How many degrees of
Freedom are there?
A) 9
B) 1
C) 8
D) 7
Unlock Deck
Unlock for access to all 140 flashcards in this deck.
Unlock Deck
k this deck
45
A manufacturer claims that less than 1% of all his products do not meet the minimum government
Standards. A survey of 500 products revealed ten did not meet the standard. If the z-statistic is
-2)58 and the level of significance is 0.02, what is your decision?
A) You reject the null hypothesis, and agree that less than 1% fail to meet government standards.
B) You have insufficient evidence to reject the null hypothesis.
C) You reject the alternate hypothesis and agree that less than 1% meet government standards.
D) You should have used the t-test.
Unlock Deck
Unlock for access to all 140 flashcards in this deck.
Unlock Deck
k this deck
46
What is the critical z-value for a one-tailed lower test at the 1% level of risk?
A) +2.58
B) -2.58
C) +2.33
D) -2.33
A) +2.58
B) -2.58
C) +2.33
D) -2.33
Unlock Deck
Unlock for access to all 140 flashcards in this deck.
Unlock Deck
k this deck
47
For a two-tailed test at the 0.05 significance level, what is the rejection region when the population
Standard deviation is known?
A) Between ±1.96
B) Between ±1.65
C) Greater than +1.96 and less than -1.96
D) Greater than +1.65 and less than -1.65
Standard deviation is known?
A) Between ±1.96
B) Between ±1.65
C) Greater than +1.96 and less than -1.96
D) Greater than +1.65 and less than -1.65
Unlock Deck
Unlock for access to all 140 flashcards in this deck.
Unlock Deck
k this deck
48
To conduct a test of hypothesis with a small sample, we need to be able to make the following
Assumption that:
A) a larger computed value of t will be needed to reject the null hypothesis.
B) the region of acceptance will be wider than for large samples.
C) the confidence interval will be wider than for large samples.
D) the population is normally distributed.
Assumption that:
A) a larger computed value of t will be needed to reject the null hypothesis.
B) the region of acceptance will be wider than for large samples.
C) the confidence interval will be wider than for large samples.
D) the population is normally distributed.
Unlock Deck
Unlock for access to all 140 flashcards in this deck.
Unlock Deck
k this deck
49
If the 1% level of significance is used and the computed value of z is +6.00, what is our decision?
A) Do not reject H0
B) Reject H0
C) Reject H1
A) Do not reject H0
B) Reject H0
C) Reject H1
Unlock Deck
Unlock for access to all 140 flashcards in this deck.
Unlock Deck
k this deck
50
A manufacturer claims that less than 1% of all his products do not meet the minimum government
Standards. A survey of 500 products revealed ten did not meet the standard.
If the z-statistic is -2.054 and the level of significance is 0.03, what is your decision?
A) You reject the null hypothesis, and agree that less than 1% fail to meet government standards.
B) You have insufficient evidence to reject the null hypothesis.
C) You reject the alternate hypothesis and agree that less than 1% meet government standards.
D) You should have used the t-test.
Unlock Deck
Unlock for access to all 140 flashcards in this deck.
Unlock Deck
k this deck
51
A manufacturer wants to increase the shelf life of a line of cake mixes. Past records indicate that the
Average shelf life of the mix is 216 days. After a revised mix has been developed, a sample of nine
Boxes of cake mix gave these shelf lives (in days): 215, 217, 218, 219, 216, 217, 217, 218 and 218. At the
0)025 level, has the shelf life of the cake mix increased?
A) Yes, because computed t is greater than the critical value.
B) Yes, because computed t is less than the critical value.
C) No, because computed t lies in the region of acceptance.
D) No, because 217.24 is quite close to 216.
Unlock Deck
Unlock for access to all 140 flashcards in this deck.
Unlock Deck
k this deck
52
What is the critical value for t in a one-tailed hypothesis test in which a null hypothesis is tested at
The 5% level of significance based on a sample size of 15?
A) 1.708
B) 1.711
C) 1.761
D) 2.145
The 5% level of significance based on a sample size of 15?
A) 1.708
B) 1.711
C) 1.761
D) 2.145
Unlock Deck
Unlock for access to all 140 flashcards in this deck.
Unlock Deck
k this deck
53
A manufacturer claims that less than 1% of all his products do not meet the minimum government
Standards. A survey of 500 products revealed ten did not meet the standard.
If the computed value of z = -2.25 and the level of significance is 0.03, what is your decision?
A) You reject the null hypothesis, and agree that less than 1% fail to meet government standards.
B) You have insufficient evidence to reject the null hypothesis.
C) You reject the alternate hypothesis and agree that less than 1% meet government standards.
D) You should have used the t-test.
Unlock Deck
Unlock for access to all 140 flashcards in this deck.
Unlock Deck
k this deck
54
What does z equal for an α = 0.01 and a lower level test?
A) +2.33
B) -2.33
C) +2.58
D) -2.58
A) +2.33
B) -2.33
C) +2.58
D) -2.58
Unlock Deck
Unlock for access to all 140 flashcards in this deck.
Unlock Deck
k this deck
55
A manufacturer of stereo equipment introduces new models in the fall. Retail dealers are surveyed
Immediately after the Christmas selling season regarding their stock on hand of each piece of
Equipment. It has been discovered that unless 40% of the new equipment ordered by the retailers
In the fall had been sold by Christmas, immediate production cutbacks are needed. The
Manufacturer has found that contacting all of the dealers after Christmas by mail is frustrating as
Many of them never respond. This year 80 dealers were selected at random and telephoned
Regarding a new receiver. It was discovered that 38% of those receivers had been sold. Since 38%
Is less than 40%, does this mean that immediate production cutbacks are needed or can this
Difference of 2 percentage points be attributed to sampling? Test at the 0.05 level.
Computed z = -0.37.
A) Cut back production
B) Do not cut back production
C) Cannot determine based on information given
Unlock Deck
Unlock for access to all 140 flashcards in this deck.
Unlock Deck
k this deck
56
The mean gross annual incomes of certified tack welders are normally distributed with the mean of
$50,000 and a standard deviation of $4,000. The ship building association wishes to find out
Whether their tack welders earn more or less than $50,000 annually. The alternate hypothesis is
That the mean is not $50,000.
If the level of significance is 0.10, what is the decision rule?
A) Do not reject the null hypothesis if computed z lies between -1.65 and +1.65; otherwise, reject it.
B) Do not reject the null hypothesis if computed z is greater than 1.65; otherwise, reject it.
C) Do not reject the null hypothesis if computed z lies between -1.96 and +1.96; otherwise, reject it.
D) Reject the null hypothesis if computed z is below -1.96; otherwise, reject it.
Unlock Deck
Unlock for access to all 140 flashcards in this deck.
Unlock Deck
k this deck
57
If α = 0.05 for a two-tailed test, how large is the acceptance area?
A) 0.050
B) 0.025
C) 0.950
D) 0.975
A) 0.050
B) 0.025
C) 0.950
D) 0.975
Unlock Deck
Unlock for access to all 140 flashcards in this deck.
Unlock Deck
k this deck
58
A random sample of size 15 is selected from a normal population. The population standard deviation
Is unknown. Assume that a two-tailed test at the 0.10 significance level is to be used. For what value
Of t will the null hypothesis be rejected?
A) To the left of -1.282 or to the right of 1.282
B) To the left of -1.345 or to the right of 1.345
C) To the left of -1.761 or to the right of 1.761
D) To the left of -1.645 or to the right of 1.645
Is unknown. Assume that a two-tailed test at the 0.10 significance level is to be used. For what value
Of t will the null hypothesis be rejected?
A) To the left of -1.282 or to the right of 1.282
B) To the left of -1.345 or to the right of 1.345
C) To the left of -1.761 or to the right of 1.761
D) To the left of -1.645 or to the right of 1.645
Unlock Deck
Unlock for access to all 140 flashcards in this deck.
Unlock Deck
k this deck
59
For a one-tailed hypothesis test, the critical z-value of the test statistic is -2.33. Which of the
Following is true about the hypothesis test?
A) α = 0.05 for a lower-tailed test
B) α = 0.01 for a lower-tailed test
C) α = 0.05 for an upper-tailed test
D) α = 0.01 for an upper-tailed test
Following is true about the hypothesis test?
A) α = 0.05 for a lower-tailed test
B) α = 0.01 for a lower-tailed test
C) α = 0.05 for an upper-tailed test
D) α = 0.01 for an upper-tailed test
Unlock Deck
Unlock for access to all 140 flashcards in this deck.
Unlock Deck
k this deck
60
A nationwide survey of college students was conducted and found that students spend two hours
Per class hour studying. A professor at your school wants to determine whether the time students
Spend at your school is significantly different from the two hours. A random sample of fifteen
Statistics students is carried out and the findings indicate an average of 1.75 hours with a standard
Deviation of 0.24 hours.
Given the following printout, what can you determine?
A) The alternate hypothesis is μ ≤ 2
B) You should accept the null hypothesis at the 0.05 level of significance.
C) There is less than a 1% chance of getting these results if the null hypothesis is true, so you have very strong evidence to suggest that the average number of study hours is different
From 2.
D) You should reject the null hypothesis at the 0.05 level of significance, but accept it when testing at the 0.01 level of significance.
E) You should accept the null hypothesis at the 0.05 level of significance, but reject it when testing at the 0.01 level of significance.
Unlock Deck
Unlock for access to all 140 flashcards in this deck.
Unlock Deck
k this deck
61
One of the major U.S. tire makers wishes to review its warranty for their rainmaker tire. The warranty
Is for 40,000 miles. The tire company believes that the tire actually lasts more than 40,000 miles. A
Sample 49 tires revealed that the mean number of miles is 45,000 miles with a standard deviation
Of 15,000 miles. Test the hypothesis with a 0.05 significance level.
A) H0 is μ ≥ 40,000 H1 is μ > 40,000
B) H0 is μ = 40,000 H1 is μ > 40,000
C) H0 is μ ≤ 40,000 H1 is μ = 40,000
D) H0 is μ = 40,000 H1 is μ ≠ 40,000
Unlock Deck
Unlock for access to all 140 flashcards in this deck.
Unlock Deck
k this deck
62
The dean of a business school claims that the average starting salary of its graduates is more than
$50,000. It is known that the population standard deviation is $10,000. Sample data on the starting
Salaries of 20 randomly selected recent graduates yielded a mean of $55,000. What is the value of
The sample test statistic?
A) z = 2.24
B) t = 7.2
C) t = 5.04
D) t = 2.24
$50,000. It is known that the population standard deviation is $10,000. Sample data on the starting
Salaries of 20 randomly selected recent graduates yielded a mean of $55,000. What is the value of
The sample test statistic?
A) z = 2.24
B) t = 7.2
C) t = 5.04
D) t = 2.24
Unlock Deck
Unlock for access to all 140 flashcards in this deck.
Unlock Deck
k this deck
63
The mean weight of newborn infants at a community hospital is said to be 6.6 pounds. A sample of
Seven infants is randomly selected and their weights at birth are recorded as 9.0, 7.3, 6.0, 8.8, 6.8,
8)4, and 6.6 pounds. What is the sample variance?
A) 1.177
B) 6.6
C) 1.385
D) 7.6
Seven infants is randomly selected and their weights at birth are recorded as 9.0, 7.3, 6.0, 8.8, 6.8,
8)4, and 6.6 pounds. What is the sample variance?
A) 1.177
B) 6.6
C) 1.385
D) 7.6
Unlock Deck
Unlock for access to all 140 flashcards in this deck.
Unlock Deck
k this deck
64
The mean weight of newborn infants at a community hospital is said to be 6.6 pounds. A sample of
Seven infants is randomly selected and their weights at birth are recorded as 9.0, 7.3, 6.0, 8.8, 6.8,
8)4, and 6.6 pounds. Does this sample support the original claim?
What is the decision for a statistical significant change in average weights at birth at the 5% level of
Significance?
A) Fail to reject the null hypothesis and conclude the mean is 6.6 lb.
B) Reject the null hypothesis and conclude the mean is higher than 6.6 lb.
C) Reject the null hypothesis and conclude the mean is lower than 6.6 lb.
D) Cannot calculate because population standard deviation is unknown.
Unlock Deck
Unlock for access to all 140 flashcards in this deck.
Unlock Deck
k this deck
65
The mean weight of newborn infants at a community hospital is said to be 6.6 pounds. A sample of
Seven infants is randomly selected and their weights at birth are recorded as 9.0, 7.3, 6.0, 8.8, 6.8,
8)4, and 6.6 pounds. Does this sample support the original claim? What is the alternate hypothesis?
A) μ = 6.6
B) μ≠ 6.6
C) μ≥ 6.6
D) μ> 7.6
E) μ≠ 7.6
Seven infants is randomly selected and their weights at birth are recorded as 9.0, 7.3, 6.0, 8.8, 6.8,
8)4, and 6.6 pounds. Does this sample support the original claim? What is the alternate hypothesis?
A) μ = 6.6
B) μ≠ 6.6
C) μ≥ 6.6
D) μ> 7.6
E) μ≠ 7.6
Unlock Deck
Unlock for access to all 140 flashcards in this deck.
Unlock Deck
k this deck
66
The dean of a business school claims that the average starting salary of its graduates is more than
$50,000. It is known that the population standard deviation is $10,000. Sample data on the starting
Salaries of 36 randomly selected recent graduates yielded a mean of $52,000. What is the value of
The sample test statistic?
A) z = 1.2
B) t = 7.2
C) t = 0.12
D) t = 1.22
$50,000. It is known that the population standard deviation is $10,000. Sample data on the starting
Salaries of 36 randomly selected recent graduates yielded a mean of $52,000. What is the value of
The sample test statistic?
A) z = 1.2
B) t = 7.2
C) t = 0.12
D) t = 1.22
Unlock Deck
Unlock for access to all 140 flashcards in this deck.
Unlock Deck
k this deck
67
The average cost of tuition, room and board at community colleges is reported to be $8,500 per
Year with a standard deviation of $1,200, but a financial administrator believes that the average cost
Is higher. A study conducted using 150 community colleges showed that the average cost per year
Is $9,000. Let α = 0.05.
What is the critical z-value for this test?
A) +1.96
B) -1.96
C) +1.65
D) -1.65
Unlock Deck
Unlock for access to all 140 flashcards in this deck.
Unlock Deck
k this deck
68
The printout below refers to the weekly closing stock prices for Air Canada on 20 randomly
Selected weeks in 2000.
Using a 5% level of significance, can you say that the average Air Canada stock price was different
From $19.50?
A) Fail to reject the null hypothesis and conclude the mean stock price was $19.50.
B) Reject the null hypothesis and conclude the mean stock price was lower than $19.50.
C) Reject the null hypothesis and conclude the mean index was greater than $19.50.
D) Reject the null hypothesis and conclude the mean index was different from $19.50.
Selected weeks in 2000.
Using a 5% level of significance, can you say that the average Air Canada stock price was different
From $19.50?
A) Fail to reject the null hypothesis and conclude the mean stock price was $19.50.
B) Reject the null hypothesis and conclude the mean stock price was lower than $19.50.
C) Reject the null hypothesis and conclude the mean index was greater than $19.50.
D) Reject the null hypothesis and conclude the mean index was different from $19.50.
Unlock Deck
Unlock for access to all 140 flashcards in this deck.
Unlock Deck
k this deck
69
One of the major U.S. tire makers wishes to review its warranty for their rainmaker tire. The warranty
Is for 40,000 miles. The tire company believes that the tire actually lasts more than 40,000 miles
With a standard deviation of 15,000 miles. A sample 49 tires revealed that the mean number of
Miles is 45,000 miles. Test the hypothesis with a 0.05 significance level.
A) The decision rule is to reject if Z > 1.645. The calculated value of z is +2.33.
B) The decision rule is to reject if Z < 1.645. The calculated value of z is -2.33.
C) The decision rule is to reject if Z > 1.96. The calculated value of z is +2.33.
D) The decision rule is to reject if Z < 1.96. The calculated value of z is +2.33.
Unlock Deck
Unlock for access to all 140 flashcards in this deck.
Unlock Deck
k this deck
70
The mean weight of newborn infants at a community hospital is said to be 6.6 pounds. A sample of
Seven infants is randomly selected and their weights at birth are recorded as 9.0, 7.3, 6.0, 8.8, 6.8,
8)4, and 6.6 pounds. Does this sample support the original claim? What is the decision for a
Significant increase in the average birthrate at a 5% level of significance?
A) Fail to reject the null hypothesis and conclude the mean is 6.6 lb.
B) Reject the null hypothesis and conclude the mean is lower than 6.6 lb.
C) Reject the null hypothesis and conclude the mean is greater than 6.6 lb.
D) Cannot calculate because population standard deviation is unknown.
Unlock Deck
Unlock for access to all 140 flashcards in this deck.
Unlock Deck
k this deck
71
The dean of a business school claims that the average starting salary of its graduates is more than
$50,000. It is known that the population standard deviation is $10,000. Sample data on the starting
Salaries of 25 randomly selected recent graduates yielded a mean of $52,000. What is the value of
The sample test statistic?
A) z = 1.0
B) t = 7.2
C) t = 5.04
D) t = 1.22
$50,000. It is known that the population standard deviation is $10,000. Sample data on the starting
Salaries of 25 randomly selected recent graduates yielded a mean of $52,000. What is the value of
The sample test statistic?
A) z = 1.0
B) t = 7.2
C) t = 5.04
D) t = 1.22
Unlock Deck
Unlock for access to all 140 flashcards in this deck.
Unlock Deck
k this deck
72
The mean weight of newborn infants at a community hospital is said to be 6.6 pounds. A sample of
Seven infants is randomly selected and their weights at birth are recorded as 9.0, 7.3, 6.0, 8.8, 6.8,
8)4, and 6.6 pounds. What is the sample mean?
A) 6.6
B) 7.6
C) 1.177
D) 2.447
Seven infants is randomly selected and their weights at birth are recorded as 9.0, 7.3, 6.0, 8.8, 6.8,
8)4, and 6.6 pounds. What is the sample mean?
A) 6.6
B) 7.6
C) 1.177
D) 2.447
Unlock Deck
Unlock for access to all 140 flashcards in this deck.
Unlock Deck
k this deck
73
The mean weight of newborn infants at a community hospital is said to be 6.6 pounds. A sample of
Seven infants is randomly selected and their weights at birth are recorded as 9.0, 7.3, 6.0, 8.8, 6.8,
8)4, and 6.6 pounds. What are the degrees of freedom associated with this claim?
A) 7
B) 8
C) 6
D) 6.6
E) 7.6
Seven infants is randomly selected and their weights at birth are recorded as 9.0, 7.3, 6.0, 8.8, 6.8,
8)4, and 6.6 pounds. What are the degrees of freedom associated with this claim?
A) 7
B) 8
C) 6
D) 6.6
E) 7.6
Unlock Deck
Unlock for access to all 140 flashcards in this deck.
Unlock Deck
k this deck
74
The mean weight of newborn infants at a community hospital is said to be 6.6 pounds. A sample of
Seven infants is randomly selected and their weights at birth are recorded as 9.0, 7.3, 6.0, 8.8, 6.8,
8)4, and 6.6 pounds. If α = 0.05, what is the critical t value?
A) -2.365
B) ±1.96
C) ±2.365
D) ±2.447
E) -2.447
Seven infants is randomly selected and their weights at birth are recorded as 9.0, 7.3, 6.0, 8.8, 6.8,
8)4, and 6.6 pounds. If α = 0.05, what is the critical t value?
A) -2.365
B) ±1.96
C) ±2.365
D) ±2.447
E) -2.447
Unlock Deck
Unlock for access to all 140 flashcards in this deck.
Unlock Deck
k this deck
75
One of the major U.S. tire makers wishes to review its warranty for their rainmaker tire. The warranty
Is for 40,000 miles. The tire company believes that the tire actually lasts more than 40,000 miles
With a standard deviation of 15,000 miles. A sample 49 tires revealed that the mean number of
Miles is 45,000 miles. Test the hypothesis with a 0.05 significance level.
A) At a 5% level of significance, our decision is to reject the null hypothesis. The tires last more than 40 000 miles.
B) At a 5% level of significance, our decision is to accept the null hypothesis. The tires last 40,000 miles.
C) At a 5% level of significance, we should have used the t-test, rather than the z-test.
Unlock Deck
Unlock for access to all 140 flashcards in this deck.
Unlock Deck
k this deck
76
The mean weight of newborn infants at a community hospital is said to be 6.6 pounds. A sample of
Seven infants is randomly selected and their weights at birth are recorded as 9.0, 7.3, 6.0, 8.8, 6.8,
8)4, and 6.6 pounds. What is the sample standard deviation?
A) 1.177
B) 6.6
C) 1.385
D) 7.6
Seven infants is randomly selected and their weights at birth are recorded as 9.0, 7.3, 6.0, 8.8, 6.8,
8)4, and 6.6 pounds. What is the sample standard deviation?
A) 1.177
B) 6.6
C) 1.385
D) 7.6
Unlock Deck
Unlock for access to all 140 flashcards in this deck.
Unlock Deck
k this deck
77
The average cost of tuition, room and board at community colleges is reported to be $8,500 per
Year with a standard deviation of $1,200, but a financial administrator believes that the average cost
Is higher. A study conducted using 150 community colleges showed that the average cost per year
Is $9,000. Let α = 0.05.
Given the z-statistic is 5.1, what is our decision about the average cost?
A) Equal to $8,500
B) Greater than $8,500
C) Less than $8,500
D) Not equal to $8,500
Unlock Deck
Unlock for access to all 140 flashcards in this deck.
Unlock Deck
k this deck
78
The following summarizes the average of the TSE 300 Index at the end of 20 randomly selected
Weeks in 2000.
Using a 5% level of significance, can it be agreed that the Index average was more than $9,600
During the year 2000?
A) Fail to reject the null hypothesis and conclude the mean index was 9,600.
B) Reject the null hypothesis and conclude the mean index was lower than 9,600.
C) Reject the null hypothesis and conclude the mean index was greater than 9,600.
D) Reject the null hypothesis and conclude the mean index was different from 9,600.
Weeks in 2000.
Using a 5% level of significance, can it be agreed that the Index average was more than $9,600
During the year 2000?
A) Fail to reject the null hypothesis and conclude the mean index was 9,600.
B) Reject the null hypothesis and conclude the mean index was lower than 9,600.
C) Reject the null hypothesis and conclude the mean index was greater than 9,600.
D) Reject the null hypothesis and conclude the mean index was different from 9,600.
Unlock Deck
Unlock for access to all 140 flashcards in this deck.
Unlock Deck
k this deck
79
The dean of a business school claims that the average starting salary of its graduates is more than
$50,000. It is known that the population standard deviation is $10,000. Sample data on the starting
Salaries of 36 randomly selected recent graduates yielded a mean of $62,000. What is the value of
The sample test statistic?
A) z = 7.2
B) t = 5.04
C) z = 2.7
D) z = 5.6
$50,000. It is known that the population standard deviation is $10,000. Sample data on the starting
Salaries of 36 randomly selected recent graduates yielded a mean of $62,000. What is the value of
The sample test statistic?
A) z = 7.2
B) t = 5.04
C) z = 2.7
D) z = 5.6
Unlock Deck
Unlock for access to all 140 flashcards in this deck.
Unlock Deck
k this deck
80
The mean weight of newborn infants at a community hospital is said to be 6.6 pounds. A sample of
Seven infants is randomly selected and their weights at birth are recorded as 9.0, 7.3, 6.0, 8.8, 6.8,
8)4, and 6.6 pounds. Does this sample support the original claim? The null hypothesis is:
A) μ = 6.6
B) μ≠ 6.6
C) μ≥ 6.6
D) μ> 7.6
E) μ≠ 7.6
Seven infants is randomly selected and their weights at birth are recorded as 9.0, 7.3, 6.0, 8.8, 6.8,
8)4, and 6.6 pounds. Does this sample support the original claim? The null hypothesis is:
A) μ = 6.6
B) μ≠ 6.6
C) μ≥ 6.6
D) μ> 7.6
E) μ≠ 7.6
Unlock Deck
Unlock for access to all 140 flashcards in this deck.
Unlock Deck
k this deck
Unlock Deck
Unlock for access to all 140 flashcards in this deck.


