Deck 20: Succession and Stability
Full screen (f)
Question
Ecological succession has been compared to the development of an organism and the climax community to a kind of super-organism. F. E. Clements (1916, 1936) was the best-known proponent of this idea, and H. A. Gleason (1926, 1939) the best-known early opponent of the idea of a community as a kind of superorganism. Gleason proposed that species are distributed independently of each other and that most overlaps in distributions are the result of coincidence, not mutual interdependence. Most modern ecologists hold a view more similar to that of Gleason. Which of the following graphs showing hypothetical distributions of species along an environmental gradient supports the superorganismic view of communities? How does the other graph support the individualistic view of species held by Gleason? ( A , B, C, and D represent the distributions of species along an environmental gradient.) 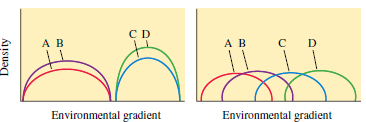
Question
Question
Question
Why do primary forest succession at Glacier Bay and secondary forest succession in the southeastern United States occur at such different rates (compare figs. 20.2 and 20.4)?
Figure 20.2 Change in plant species richness during primary succession at Glacier Bay, Alaska (data from Reiners, Worley, and Lawrence 1971).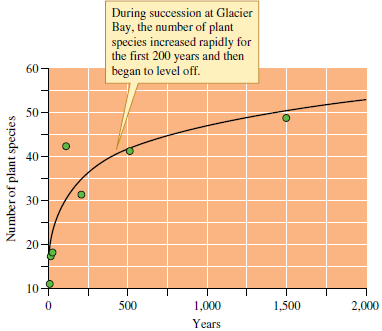
Figure 20.4 Change in woody plant species richness during secondary forest succession in eastern North America (data from Oosting 1942)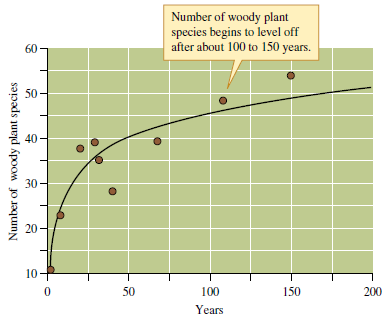
Figure 20.2 Change in plant species richness during primary succession at Glacier Bay, Alaska (data from Reiners, Worley, and Lawrence 1971).
Figure 20.4 Change in woody plant species richness during secondary forest succession in eastern North America (data from Oosting 1942)
Question
Question
Question
Question
Question
How are the biomass accumulation model of Bormann and Likens (see fig. 20.16) and Grimm's observations of changes in nitrogen retention during succession in Sycamore Creek similar?
Figure 20.16 The biomass accumulation model of forest succession (data from Bormann and Likens 1981).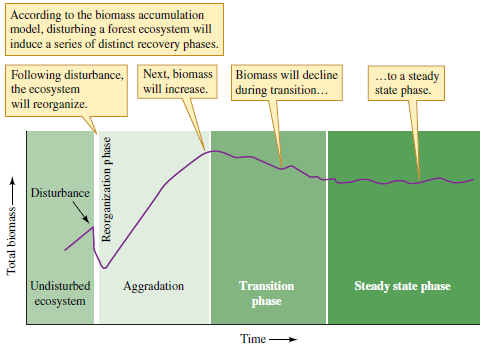
Figure 20.16 The biomass accumulation model of forest succession (data from Bormann and Likens 1981).
Question
As we saw in figure 20.5, Johnston and Odum (1956) documented substantial change in the richness of bird species in a successional sequence going from the earliest stages in which the plant community was dominated by grasses and forbs to mature oak-hickory forests. Use MacArthur's (see chapter 16) studies (1958, 1961) of foliage height diversity and bird diversity to explain the patterns of diversity increase observed by Johnston and Odum.
Figure 20.5 Change in number of breeding bird species during secondary forest succession (data from Johnston and Odum 1956).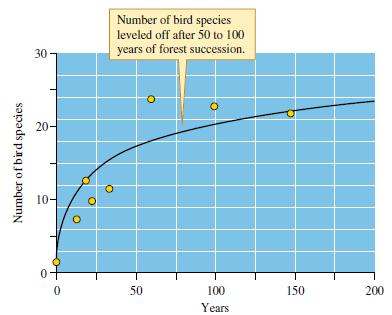
Figure 20.5 Change in number of breeding bird species during secondary forest succession (data from Johnston and Odum 1956).
Question
What is the role of disturbance in the Connell and Slatyer succession model (see fig. 20.20)?
Figure 20.20 Alternative successional mechanisms (data from Connell and Slatyer 1977).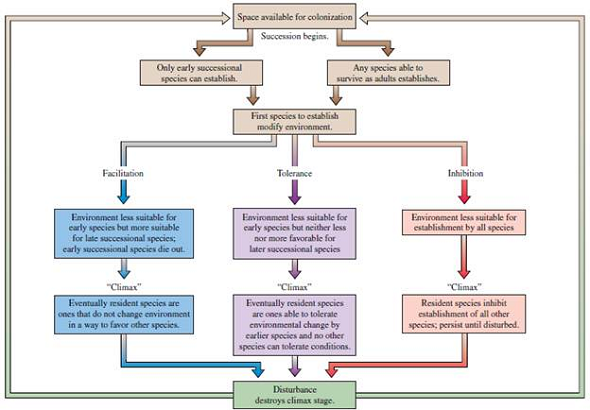
Figure 20.20 Alternative successional mechanisms (data from Connell and Slatyer 1977).
Question
Question
Suppose Gigartina had colonized the plots where Sousa had removed Ulva and where he had left Ulva in place at the same rates (see fig. 20.21). This result would be consistent with which successional model?
Figure 20.21 Evidence for inhibition of later successional species (data from Sousa 1979a).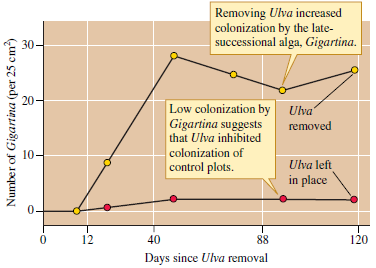
Figure 20.21 Evidence for inhibition of later successional species (data from Sousa 1979a).
Question
Would you expect the number of species to remain indefinitely at the level shown in figure 20.7? Space on large stable boulders in Sousa's study site is dominated by the algal G.canaliculata and support 2.3 to 3.5 species, not the 5 shown in figure 20.7. Explain. (Hint: How long did Sousa follow his study boulders?)
Figure 20.7 Succession in number of macroinvertebrate and macroalgae species on intertidal boulders (data from Sousa 1979a).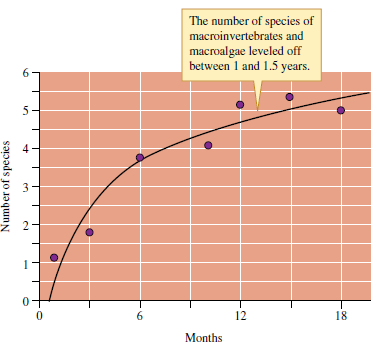
Figure 20.7 Succession in number of macroinvertebrate and macroalgae species on intertidal boulders (data from Sousa 1979a).
Question
Question
The successional studies in Sycamore Creek produced patterns of variation in diversity that differed significantly from those observed during primary succession at Glacier Bay (see fig. 20.2), old field succession on the Piedmont Plateau (see fig. 20.4), or algal and barnacle succession in the intertidal zone (see fig. 20.7). The main difference was that Fisher and colleagues (1982) observed initial increases in species diversity followed by declines. In contrast, studies of forest and intertidal succession showed increases in diversity but no obvious declines. What may have been responsible for these different results? How might have differences in the longevity of species contributed to the different patterns observed by researchers? (Hint: Think about what we might observe in the other communities if they were studied for a longer period of time.)
Figure 20.2 Change in plant species richness during primary succession at Glacier Bay, Alaska (data from Reiners, Worley, and Lawrence 1971).
Figure 20.4 Change in woody plant species richness during secondary forest succession in eastern North America (data from Oosting 1942)
Figure 20.7 Succession in number of macroinvertebrate and macroalgae species on intertidal boulders (data from Sousa 1979a).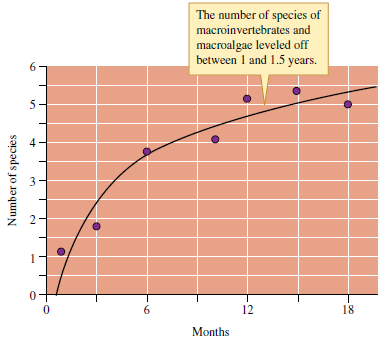
Question
Question
Question
Question
Question
Question
Question

Unlock Deck
Sign up to unlock the cards in this deck!
Unlock Deck
Unlock Deck
1/23
Play
Full screen (f)
Deck 20: Succession and Stability
1
Ecological succession has been compared to the development of an organism and the climax community to a kind of super-organism. F. E. Clements (1916, 1936) was the best-known proponent of this idea, and H. A. Gleason (1926, 1939) the best-known early opponent of the idea of a community as a kind of superorganism. Gleason proposed that species are distributed independently of each other and that most overlaps in distributions are the result of coincidence, not mutual interdependence. Most modern ecologists hold a view more similar to that of Gleason. Which of the following graphs showing hypothetical distributions of species along an environmental gradient supports the superorganismic view of communities? How does the other graph support the individualistic view of species held by Gleason? ( A , B, C, and D represent the distributions of species along an environmental gradient.)
The phenomenon of ecological succession has been compared to the developmental stages of an organism. Both succession and an organism show a beginning and growth over time. The climax community has been referred to as a super organism by F.E. Clements. All the species in the climax community were assumed to be strongly associated and interacting with each other. The groups of species showed narrow overlap with the other groups of species.
H.A. Gleason opposed to this concept of super organism for a community. He proposed that each species responds differently to the environment. The species are distributed independently of each other. The overlapping in their distribution is a chance event and not due to their interdependence.
The graph 1 and graph2 are illustrated below: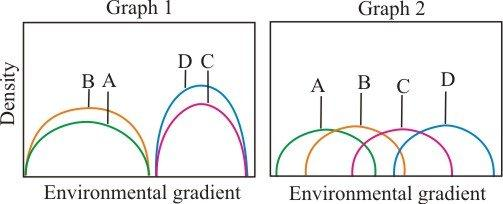 The hypothetical species distribution along an environmental gradient depicted in graph 1 supports the super organismic view of communities. The graph 2 supports the individualistic view of the species.
Graph 2 supports the individualistic view of species proposed by Gleason in following ways:
• The distribution of species differs along the environmental gradient with few regions of overlap.
• The species prefer different environmental gradients. Therefore, appears to be no interdependence or close interactions between the organisms.
• The species vary with respect to their tolerance for the environmental gradient.
H.A. Gleason opposed to this concept of super organism for a community. He proposed that each species responds differently to the environment. The species are distributed independently of each other. The overlapping in their distribution is a chance event and not due to their interdependence.
The graph 1 and graph2 are illustrated below:
The hypothetical species distribution along an environmental gradient depicted in graph 1 supports the super organismic view of communities. The graph 2 supports the individualistic view of the species.Graph 2 supports the individualistic view of species proposed by Gleason in following ways:
• The distribution of species differs along the environmental gradient with few regions of overlap.
• The species prefer different environmental gradients. Therefore, appears to be no interdependence or close interactions between the organisms.
• The species vary with respect to their tolerance for the environmental gradient.
2
Species have come and gone in response to changing global climates during the history of the earth. Some of the mass extinctions of the past have resulted in the deaths of over 90% of existing species. What do these biological changes suggest about the long-term stability of the species composition of climax communities?
Succession is the change in composition and diversity of the community on an area after a disturbance or on the newly created substrates. This change continues till the stable, climax community is reached.
The climax community remains stable till it encounters a disturbance. The disturbance may be due to the climatic variations, natural phenomena such as floods, drought, fires, and human influences.
Ecologists have suggested that the frequency and intensity of disturbance can influence the species composition and diversity.
Intermediate disturbance has been shown to have a favourable influence on the species composition. However, high frequency and severity of disturbances can cause devastating effects on the community.
Mass extinctions in the past have been caused due to the rapid and major environmental disturbances. The reasons for mass extinctions have been attributed to the impacts of asteroids, large-scale eruptions of volcanoes, and global climatic changes.
Hence, the stability of the species composition of climax communities may be short-term or long-term depending on the nature and severity of influences on the community.
3
Succession seems to lead to predictable changes in community and ecosystem structure. Predict the characteristics of a frequently disturbed community/ecosystem versus a largely undisturbed community/ecosystem. What do your predictions suggest about a future biosphere increasingly disturbed by a growing human population? How does the intermediate disturbance hypothesis (see chapter 16) figure into your answer?
The succession involves changes in the community structure with time following a disturbance or exposure of new habitats.
During succession the community has been proposed to undergo changes in species composition and species diversity. Changes in the ecosystem have been shown with respect to the primary productivity, biomass, and nutrient retention. Many of these changes are found to be predictable.
The characteristics of a frequently disturbed community or ecosystem versus a rarely disturbed community or ecosystem are as follows:
• Succession can proceed till the climax community in a usually undisturbed community. In a frequently disturbed community many episodes of secondary succession can be seen.
• A largely undisturbed community may show more species diversity compared to the disturbed community. The species diversity will be governed by external disturbances such as floods in case of a frequently disturbed community. The species diversity will be governed more by the species interactions in a rarely disturbed community.
• Frequently disturbed ecosystems can support communities of species showing rapid growth. Successions can be rapid in frequently disturbed ecosystems. The ecosystems rarely disturbed can harbour organisms showing slow growth. Hence, slow successions can be seen in undisturbed ecosystems.
• Successions in rarely disturbed community can lead to more substantial changes in the ecosystems than the frequently disturbed ecosystems. The soil depth, content of organic matter, moisture content, and nutrient content in the form of nitrogen is found to increase during prolonged succession. Other features such as pH and concentration of certain nutrients may decrease available forms of phosphorous. Frequently disturbed ecosystems may show rapid changes in primary productivity and nitrogen retention.
• Nutrient retention is more in undisturbed communities than in disturbed communities.
In addition, overgrowth of human population has led to a major disturbance to the ecosystems worldwide. Human activities have led to degradation of the environment, loss of habitat of animals, and pollution of ecosystems worldwide.
As the disturbance to the natural ecosystems increases, the species composition will change over time. Increased disturbance will lead to decrease in species diversity. These disturbances may cause the extinction of many species.
The disturbance to the terrestrial and aquatic ecosystems will affect the nutrient cycles in nature. There will be effects on the global climate leading to unpredictable consequences.
Persistence of this trend of disturbance by humans may lead to the realization of human extinction.
Therefore, the intermediate disturbance hypothesis predicts a disturbance of intermediate level; promotes the maximum species diversity. Intermediate levels of disturbances have been suggested to promote coexistence of species without causing competitive exclusion. A higher disturbance may lead to decrease in species diversity.
Thus, intermediate disturbance hypothesis correlates the level of disturbance with the amount of species diversity.
4
Why do primary forest succession at Glacier Bay and secondary forest succession in the southeastern United States occur at such different rates (compare figs. 20.2 and 20.4)?
Figure 20.2 Change in plant species richness during primary succession at Glacier Bay, Alaska (data from Reiners, Worley, and Lawrence 1971).
Figure 20.4 Change in woody plant species richness during secondary forest succession in eastern North America (data from Oosting 1942)
Figure 20.2 Change in plant species richness during primary succession at Glacier Bay, Alaska (data from Reiners, Worley, and Lawrence 1971).
Figure 20.4 Change in woody plant species richness during secondary forest succession in eastern North America (data from Oosting 1942)
Unlock Deck
Unlock for access to all 23 flashcards in this deck.
Unlock Deck
k this deck
5
What are the primary mechanisms producing the great differences in succession rates in forests, rocky inter-tidal, and stream communities?
Unlock Deck
Unlock for access to all 23 flashcards in this deck.
Unlock Deck
k this deck
6
Why are the changes in soil properties during the course of succession documented by Stuart Chapin and his colleagues ecologically significant?
Unlock Deck
Unlock for access to all 23 flashcards in this deck.
Unlock Deck
k this deck
7
What would equal levels of nitrogen input and output in the stream reaches (sections) studied by Nancy Grimm indicate?
Unlock Deck
Unlock for access to all 23 flashcards in this deck.
Unlock Deck
k this deck
8
Why can an interquartile range around a median, even when sample sizes are large, be asymmetrical?
Unlock Deck
Unlock for access to all 23 flashcards in this deck.
Unlock Deck
k this deck
9
How are the biomass accumulation model of Bormann and Likens (see fig. 20.16) and Grimm's observations of changes in nitrogen retention during succession in Sycamore Creek similar?
Figure 20.16 The biomass accumulation model of forest succession (data from Bormann and Likens 1981).
Figure 20.16 The biomass accumulation model of forest succession (data from Bormann and Likens 1981).
Unlock Deck
Unlock for access to all 23 flashcards in this deck.
Unlock Deck
k this deck
10
As we saw in figure 20.5, Johnston and Odum (1956) documented substantial change in the richness of bird species in a successional sequence going from the earliest stages in which the plant community was dominated by grasses and forbs to mature oak-hickory forests. Use MacArthur's (see chapter 16) studies (1958, 1961) of foliage height diversity and bird diversity to explain the patterns of diversity increase observed by Johnston and Odum.
Figure 20.5 Change in number of breeding bird species during secondary forest succession (data from Johnston and Odum 1956).
Figure 20.5 Change in number of breeding bird species during secondary forest succession (data from Johnston and Odum 1956).
Unlock Deck
Unlock for access to all 23 flashcards in this deck.
Unlock Deck
k this deck
11
What is the role of disturbance in the Connell and Slatyer succession model (see fig. 20.20)?
Figure 20.20 Alternative successional mechanisms (data from Connell and Slatyer 1977).
Figure 20.20 Alternative successional mechanisms (data from Connell and Slatyer 1977).
Unlock Deck
Unlock for access to all 23 flashcards in this deck.
Unlock Deck
k this deck
12
Why are the standard error bars around the mean (see p. 320) always symmetrical?
Unlock Deck
Unlock for access to all 23 flashcards in this deck.
Unlock Deck
k this deck
13
Suppose Gigartina had colonized the plots where Sousa had removed Ulva and where he had left Ulva in place at the same rates (see fig. 20.21). This result would be consistent with which successional model?
Figure 20.21 Evidence for inhibition of later successional species (data from Sousa 1979a).
Figure 20.21 Evidence for inhibition of later successional species (data from Sousa 1979a).
Unlock Deck
Unlock for access to all 23 flashcards in this deck.
Unlock Deck
k this deck
14
Would you expect the number of species to remain indefinitely at the level shown in figure 20.7? Space on large stable boulders in Sousa's study site is dominated by the algal G.canaliculata and support 2.3 to 3.5 species, not the 5 shown in figure 20.7. Explain. (Hint: How long did Sousa follow his study boulders?)
Figure 20.7 Succession in number of macroinvertebrate and macroalgae species on intertidal boulders (data from Sousa 1979a).
Figure 20.7 Succession in number of macroinvertebrate and macroalgae species on intertidal boulders (data from Sousa 1979a).
Unlock Deck
Unlock for access to all 23 flashcards in this deck.
Unlock Deck
k this deck
15
What pattern of colonization by Gigartina in Sousa's Ulva removal experiment would have been consistent with the facilitation model?
Unlock Deck
Unlock for access to all 23 flashcards in this deck.
Unlock Deck
k this deck
16
The successional studies in Sycamore Creek produced patterns of variation in diversity that differed significantly from those observed during primary succession at Glacier Bay (see fig. 20.2), old field succession on the Piedmont Plateau (see fig. 20.4), or algal and barnacle succession in the intertidal zone (see fig. 20.7). The main difference was that Fisher and colleagues (1982) observed initial increases in species diversity followed by declines. In contrast, studies of forest and intertidal succession showed increases in diversity but no obvious declines. What may have been responsible for these different results? How might have differences in the longevity of species contributed to the different patterns observed by researchers? (Hint: Think about what we might observe in the other communities if they were studied for a longer period of time.)
Figure 20.2 Change in plant species richness during primary succession at Glacier Bay, Alaska (data from Reiners, Worley, and Lawrence 1971).
Figure 20.4 Change in woody plant species richness during secondary forest succession in eastern North America (data from Oosting 1942)
Figure 20.7 Succession in number of macroinvertebrate and macroalgae species on intertidal boulders (data from Sousa 1979a).
Figure 20.2 Change in plant species richness during primary succession at Glacier Bay, Alaska (data from Reiners, Worley, and Lawrence 1971).
Figure 20.4 Change in woody plant species richness during secondary forest succession in eastern North America (data from Oosting 1942)
Figure 20.7 Succession in number of macroinvertebrate and macroalgae species on intertidal boulders (data from Sousa 1979a).
Unlock Deck
Unlock for access to all 23 flashcards in this deck.
Unlock Deck
k this deck
17
What causes community resilience?
Unlock Deck
Unlock for access to all 23 flashcards in this deck.
Unlock Deck
k this deck
18
In most studies of forest succession such as that of Reiners and colleagues (1971) and Oosting (1942), researchers study succession by comparing sites of various ages. This approach is called a "space for time substitution." What are some major assumptions of a space for time substitution? What contribution might the Glacier Bay system make to testing some of those assumptions? Why is this approach often necessary? What advantages for studying succession are offered by systems like Sycamore Creek?
Unlock Deck
Unlock for access to all 23 flashcards in this deck.
Unlock Deck
k this deck
19
How might taxonomic resolution-that is, how precisely we identify organisms-influence an assessment of community stability?
Unlock Deck
Unlock for access to all 23 flashcards in this deck.
Unlock Deck
k this deck
20
The rapid succession shown by the Sycamore Creek ecosystem is impressive. How might natural selection influence the life cycles of the organisms living in Sycamore Creek? Imagine a creek that floods about twice per century. How quickly would you expect the community and ecosystem to recover following one of these rare floods? Explain your answer in terms of natural selection by flooding on the life cycles of organisms.
Unlock Deck
Unlock for access to all 23 flashcards in this deck.
Unlock Deck
k this deck
21
Is the index of resilience used by Valett and his colleagues consistent with the biomass accumulation model of Bormann and Likens?
Unlock Deck
Unlock for access to all 23 flashcards in this deck.
Unlock Deck
k this deck
22
In the studies of mechanisms underlying succession, ecologists have found a great deal of evidence for both facilitation and inhibition. However, they have found little evidence for the tolerance model. Explain this lack of support for the tolerance model.
Unlock Deck
Unlock for access to all 23 flashcards in this deck.
Unlock Deck
k this deck
23
When Mount St. Helens in Washington erupted in 1980, it created a gradient in disturbance. In the pumice plains near the eruption, the devastation was almost total. The extent of disturbance was much less in the farthest reaches of the blast zone. How might the rate of forest succession be related to intensity of disturbance around Mount St. Helens? Design a study to test your ideas, including a hypothetical map of the blast zone, the location of study sites, a list of the variables you would measure, a timetable for your study (assume you or your successors study the system for as long as you like), and a list of results that would support or contradict your hypothesis.
Unlock Deck
Unlock for access to all 23 flashcards in this deck.
Unlock Deck
k this deck
Unlock Deck
Unlock for access to all 23 flashcards in this deck.


