Deck 3: Descriptive Statistics
Full screen (f)
Question
Question
Question
Question
Question
Question
Question
Question
Question
Question
Question
Question
Question
Question
Question
Question
Question
Question
Question
Question
Question
Question
Question
Question
Question
Question
Question
Question
Question
Question
Question
Question
Question
Question
Question
Question
Question
Question
Question
Question
Question
The following twelve data values are provided:  The value of Q1 is _____
A)184.5
B)187
C)215.5
D)440
E)578
The value of Q1 is _____A)184.5
B)187
C)215.5
D)440
E)578
Question
The following twelve sample data values, with a mean value of 337, are provided:  The mean absolute deviation (MAD)is _____
A)0.00
B)144.17
C)157.27
D)308.92
E)Cannot be answered with the information provided
The mean absolute deviation (MAD)is _____A)0.00
B)144.17
C)157.27
D)308.92
E)Cannot be answered with the information provided
Question
Question
Question
Question
Question
The following twelve data values are provided:  The 80th percentile is _____
A)187
B)244
C)302
D)440
E)578
The 80th percentile is _____A)187
B)244
C)302
D)440
E)578
Question
Question
Question
The following ten data values are provided:  The 80th percentile is _____
A)984
B)995
C)1609
D)2346
E)3083
The 80th percentile is _____A)984
B)995
C)1609
D)2346
E)3083
Question
The following twelve data values are provided:  The value of Q3 is _____
A)7739
B)7596
C)6188
D)6032
E)5352
The value of Q3 is _____A)7739
B)7596
C)6188
D)6032
E)5352
Question
Question
Question
Question
The following ten data values are provided:  The value of Q1 is _____
A)973
B)984
C)995
D)1609
E)3083
The value of Q1 is _____A)973
B)984
C)995
D)1609
E)3083
Question
The following twelve data values are provided:  The 30th percentile is _____
A)187
B)244
C)250
D)302
E)578
The 30th percentile is _____A)187
B)244
C)250
D)302
E)578
Question
Question
Question
The following twelve sample data values, with a mean value of 337, are provided:  The sample variance is _____
A)308.92
B)30511.33
C)33285.00
D)1145154.08
E)1249259.00
The sample variance is _____A)308.92
B)30511.33
C)33285.00
D)1145154.08
E)1249259.00
Question
The following twelve sample data values, with a mean value of 337, are provided:  The sample standard deviation is _____
A)17.58
B)174.67
C)182.44
D)1070.12
E)1117.70
The sample standard deviation is _____A)17.58
B)174.67
C)182.44
D)1070.12
E)1117.70
Question
Question
Question
Question
Question
Question
Question
Question
Question
The following box-and-whisker plot was constructed for the age of accounts receivable: 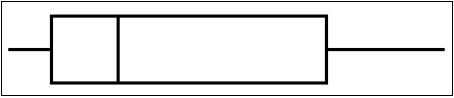 The box-and-whisker plot reveals that the accounts receivable ages are ___.
A)skewed to the left
B)skewed to the right
C)not skewed
D)normally distributed
E)symmetrical
The box-and-whisker plot reveals that the accounts receivable ages are ___.A)skewed to the left
B)skewed to the right
C)not skewed
D)normally distributed
E)symmetrical
Question
Question
Question
Liz Chapa manages a portfolio of 250 common stocks.Her staff compiled the following performance statistics for two new stocks:  The coefficient of variation for Salas Products, Inc.is ___.
A)300%
B)100%
C)33%
D)5%
E)23%
The coefficient of variation for Salas Products, Inc.is ___.A)300%
B)100%
C)33%
D)5%
E)23%
Question
Question
Question
Question
Question
Question
Question
Liz Chapa manages a portfolio of 250 common stocks.Her staff compiled the following performance statistics for two new stocks.  The coefficient of variation for Hot Boards, Inc.is __________.
A)400%
B)100%
C)33%
D)40%
E)25%
The coefficient of variation for Hot Boards, Inc.is __________.A)400%
B)100%
C)33%
D)40%
E)25%
Question

Unlock Deck
Sign up to unlock the cards in this deck!
Unlock Deck
Unlock Deck
1/105
Play
Full screen (f)
Deck 3: Descriptive Statistics
1
Average deviation is a common measure of the variability of data containing a set of numbers.
False
2
An appropriate measure of central tendency for ordinal data is the mode.
False
3
Data sets with more than one mode are referred to as bimodal
False
4
The sum of the average of the squared deviations about the arithmetic mean, divided by the sample size minus one is called the sample variance.
Unlock Deck
Unlock for access to all 105 flashcards in this deck.
Unlock Deck
k this deck
5
It is inappropriate to use the mean to analyze data that are not at least interval level in measurement.
Unlock Deck
Unlock for access to all 105 flashcards in this deck.
Unlock Deck
k this deck
6
The most appropriate measure of central tendency for nominal-level data is the median.
Unlock Deck
Unlock for access to all 105 flashcards in this deck.
Unlock Deck
k this deck
7
Measures of variability include percentiles and quartiles.
Unlock Deck
Unlock for access to all 105 flashcards in this deck.
Unlock Deck
k this deck
8
The mean of Q3 and Q2 is the same as the median.
Unlock Deck
Unlock for access to all 105 flashcards in this deck.
Unlock Deck
k this deck
9
The greater the coefficient of variation value the lower the variability and thereby lower risk.
Unlock Deck
Unlock for access to all 105 flashcards in this deck.
Unlock Deck
k this deck
10
The lowest appropriate level of measurement for the median is ordinal.
Unlock Deck
Unlock for access to all 105 flashcards in this deck.
Unlock Deck
k this deck
11
The most frequently occurring value in a set of data is called the mode.
Unlock Deck
Unlock for access to all 105 flashcards in this deck.
Unlock Deck
k this deck
12
The lower the coefficient of variation value the lower the variability and thereby lower risk.
Unlock Deck
Unlock for access to all 105 flashcards in this deck.
Unlock Deck
k this deck
13
The coefficient of variation is unitless.
Unlock Deck
Unlock for access to all 105 flashcards in this deck.
Unlock Deck
k this deck
14
The sum of deviations about the arithmetic mean for a given set of data is always equal to zero.
Unlock Deck
Unlock for access to all 105 flashcards in this deck.
Unlock Deck
k this deck
15
A student reviewed their final grade and in addition to seeing their final grade, their professor gave them their percentile score.If a student scores in the 92nd percentile that means that 92% of the students' scores are above this student score.
Unlock Deck
Unlock for access to all 105 flashcards in this deck.
Unlock Deck
k this deck
16
The sample standard deviation is calculated by taking the square root of the population standard deviation.
Unlock Deck
Unlock for access to all 105 flashcards in this deck.
Unlock Deck
k this deck
17
Percentiles divide a group of data into 99 parts
Unlock Deck
Unlock for access to all 105 flashcards in this deck.
Unlock Deck
k this deck
18
The approximate percentage number of values that lie with a given number of standard deviations about the mean is known as Chebyshev's theorem.
Unlock Deck
Unlock for access to all 105 flashcards in this deck.
Unlock Deck
k this deck
19
The middle value in an ordered array of numbers is called the mode.
Unlock Deck
Unlock for access to all 105 flashcards in this deck.
Unlock Deck
k this deck
20
Statistical measures used to yield information about the centre or the middle parts of a group of numbers are called the measures of central tendency.
Unlock Deck
Unlock for access to all 105 flashcards in this deck.
Unlock Deck
k this deck
21
A statistics student made the following grades on 5 tests: 84, 78, 88, 78, and 72.What is the mean grade?
A)78
B)80
C)72
D)84
E)88
A)78
B)80
C)72
D)84
E)88
Unlock Deck
Unlock for access to all 105 flashcards in this deck.
Unlock Deck
k this deck
22
The empirical rule may only be applied when data are known to be normally distributed.
Unlock Deck
Unlock for access to all 105 flashcards in this deck.
Unlock Deck
k this deck
23
In a large data set, an analyst finds that the interquartile range is 102 to 331, indicating that about 75% of the data points fall within that range.
Unlock Deck
Unlock for access to all 105 flashcards in this deck.
Unlock Deck
k this deck
24
A measure of how peaked the data is, is called kurtosis.
Unlock Deck
Unlock for access to all 105 flashcards in this deck.
Unlock Deck
k this deck
25
A statistics student made the following grades on 5 tests: 84, 78, 88, 78, and 82.What is the mode?
A)78
B)80
C)88
D)84
E)82
A)78
B)80
C)88
D)84
E)82
Unlock Deck
Unlock for access to all 105 flashcards in this deck.
Unlock Deck
k this deck
26
A business analyst could use descriptive statistics of skewness to determine if the empirical rule could appropriately be applied to a variable.
Unlock Deck
Unlock for access to all 105 flashcards in this deck.
Unlock Deck
k this deck
27
From a large data set, a variable would be considered positively skewed if the descriptive statistics showed the median to be less than the mean.
Unlock Deck
Unlock for access to all 105 flashcards in this deck.
Unlock Deck
k this deck
28
A statistics student made the following grades on 5 tests: 84, 78, 88, 72, and 72.What is the median grade?
A)88
B)72
C)78
D)80
E)82
A)88
B)72
C)78
D)80
E)82
Unlock Deck
Unlock for access to all 105 flashcards in this deck.
Unlock Deck
k this deck
29
Skewness and kurtosis of a data set are measures of the shape of the distribution.
Unlock Deck
Unlock for access to all 105 flashcards in this deck.
Unlock Deck
k this deck
30
An outlier of a data set is determined from the lower and upper quartile
Unlock Deck
Unlock for access to all 105 flashcards in this deck.
Unlock Deck
k this deck
31
A z score value between -1.00 and +1.00 represent approximately 68% of the values in a given data set.
Unlock Deck
Unlock for access to all 105 flashcards in this deck.
Unlock Deck
k this deck
32
If the mean, median, and mode are equal, then the distribution is positively skewed.
Unlock Deck
Unlock for access to all 105 flashcards in this deck.
Unlock Deck
k this deck
33
By comparing the mean and median of a variable in a large data set, a business analyst can assess the variability within the values of that variable.
Unlock Deck
Unlock for access to all 105 flashcards in this deck.
Unlock Deck
k this deck
34
Chebyshev's theorem may be successfully applied regardless of the shape of the data distribution.
Unlock Deck
Unlock for access to all 105 flashcards in this deck.
Unlock Deck
k this deck
35
If the median of a distribution is greater than mean, then the distribution is skewed to the left.
Unlock Deck
Unlock for access to all 105 flashcards in this deck.
Unlock Deck
k this deck
36
A box and whisker plot is determined from the mean, the smallest and the largest values, and the lower and upper quartile.
Unlock Deck
Unlock for access to all 105 flashcards in this deck.
Unlock Deck
k this deck
37
If a large data set can be assumed to be normally distributed, then a business analyst could apply the normality rule to determine a range with approximately 60% of the data.
Unlock Deck
Unlock for access to all 105 flashcards in this deck.
Unlock Deck
k this deck
38
A histogram can be used in business analytics to determine if a variable is approximately normally distributed.
Unlock Deck
Unlock for access to all 105 flashcards in this deck.
Unlock Deck
k this deck
39
Skewness indicates that a data distribution is symmetrical or asymmetrical.
Unlock Deck
Unlock for access to all 105 flashcards in this deck.
Unlock Deck
k this deck
40
If the mean of a distribution is greater than the median, then the distribution is positively skewed.
Unlock Deck
Unlock for access to all 105 flashcards in this deck.
Unlock Deck
k this deck
41
The following twelve data values are provided: The value of Q1 is _____
A)184.5
B)187
C)215.5
D)440
E)578
The value of Q1 is _____A)184.5
B)187
C)215.5
D)440
E)578
Unlock Deck
Unlock for access to all 105 flashcards in this deck.
Unlock Deck
k this deck
42
The following twelve sample data values, with a mean value of 337, are provided: The mean absolute deviation (MAD)is _____
A)0.00
B)144.17
C)157.27
D)308.92
E)Cannot be answered with the information provided
The mean absolute deviation (MAD)is _____A)0.00
B)144.17
C)157.27
D)308.92
E)Cannot be answered with the information provided
Unlock Deck
Unlock for access to all 105 flashcards in this deck.
Unlock Deck
k this deck
43
The following measurements represent the gain or loss in the daily closing price of a security for ten consecutive days: -1, 3, 4, 1, 0, -4, -3, 2, -1, 1
The mean gain or (loss)was _____
A)0.20
B)0.22
C)2.00
D)3.22
E)5.80
The mean gain or (loss)was _____
A)0.20
B)0.22
C)2.00
D)3.22
E)5.80
Unlock Deck
Unlock for access to all 105 flashcards in this deck.
Unlock Deck
k this deck
44
A commuter travels many kilometres to work each morning.She has timed this trip 5 times during the last month.The time (in minutes)required to make this trip was 34, 39, 41, 35, and 41.The modal time required for this trip was ___.
A)39
B)41
C)37.5
D)38
E)35
A)39
B)41
C)37.5
D)38
E)35
Unlock Deck
Unlock for access to all 105 flashcards in this deck.
Unlock Deck
k this deck
45
A statistics student made the following grades on the first 6 tests: 76, 82, 92, 95, 92, 86.The total number of tests for the semester is 7.If the median score for the whole semester was 92, what could not have been the score of the last test?
A)77
B)92
C)93
D)94
E)96
A)77
B)92
C)93
D)94
E)96
Unlock Deck
Unlock for access to all 105 flashcards in this deck.
Unlock Deck
k this deck
46
The empirical rule says that approximately what percentage of the values would be within two standard deviations of the mean in a bell shaped set of data?
A)95%
B)68%
C)50%
D)97.7%
E)100%
A)95%
B)68%
C)50%
D)97.7%
E)100%
Unlock Deck
Unlock for access to all 105 flashcards in this deck.
Unlock Deck
k this deck
47
The following twelve data values are provided: The 80th percentile is _____
A)187
B)244
C)302
D)440
E)578
The 80th percentile is _____A)187
B)244
C)302
D)440
E)578
Unlock Deck
Unlock for access to all 105 flashcards in this deck.
Unlock Deck
k this deck
48
A commuter travels many kilometres to work each morning.She has timed this trip 5 times during the last month.The time (in minutes)required to make this trip was 34, 39, 41, 35, and 41.The median time (in minutes)required for this trip was ___.
A)39
B)41
C)37.5
D)38
E)35.5
A)39
B)41
C)37.5
D)38
E)35.5
Unlock Deck
Unlock for access to all 105 flashcards in this deck.
Unlock Deck
k this deck
49
A commuter travels many kilometres to work each morning.She has timed this trip 5 times during the last month.The time (in minutes)required to make this trip was 34, 39, 41, 35, and 41.The mean time (in minutes)required for this trip was ___.
A)35
B)41
C)37.5
D)38
E)35.5
A)35
B)41
C)37.5
D)38
E)35.5
Unlock Deck
Unlock for access to all 105 flashcards in this deck.
Unlock Deck
k this deck
50
The following ten data values are provided: The 80th percentile is _____
A)984
B)995
C)1609
D)2346
E)3083
The 80th percentile is _____A)984
B)995
C)1609
D)2346
E)3083
Unlock Deck
Unlock for access to all 105 flashcards in this deck.
Unlock Deck
k this deck
51
The following twelve data values are provided: The value of Q3 is _____
A)7739
B)7596
C)6188
D)6032
E)5352
The value of Q3 is _____A)7739
B)7596
C)6188
D)6032
E)5352
Unlock Deck
Unlock for access to all 105 flashcards in this deck.
Unlock Deck
k this deck
52
The following measurements represent the gain or loss in the daily closing price of a security for ten consecutive days: -1, 3, 4, 1, 0, -4, -3, 2, -1, 1
The modal gain or (loss)was _____
A)-1
B)-1 and 1
C)-1, 1 and 3
D)1 and 3
E)-1, 1 and 4
The modal gain or (loss)was _____
A)-1
B)-1 and 1
C)-1, 1 and 3
D)1 and 3
E)-1, 1 and 4
Unlock Deck
Unlock for access to all 105 flashcards in this deck.
Unlock Deck
k this deck
53
The following measurements represent the gain or loss in the daily closing price of a security for ten consecutive days: -1, 3, 4, 1, 0, -4, -3, 2, -1, 1
The median gain or (loss)was _____
A)-0.50
B)0
C)0.20
D)0.50
E)2.00
The median gain or (loss)was _____
A)-0.50
B)0
C)0.20
D)0.50
E)2.00
Unlock Deck
Unlock for access to all 105 flashcards in this deck.
Unlock Deck
k this deck
54
According to Chebyshev's Theorem, how many values in a data set will be within two standard deviations of the mean?
A)at least 75%
B)at least 68%
C)at least 95%
D)at least 89%
E)at least 99%
A)at least 75%
B)at least 68%
C)at least 95%
D)at least 89%
E)at least 99%
Unlock Deck
Unlock for access to all 105 flashcards in this deck.
Unlock Deck
k this deck
55
The following ten data values are provided: The value of Q1 is _____
A)973
B)984
C)995
D)1609
E)3083
The value of Q1 is _____A)973
B)984
C)995
D)1609
E)3083
Unlock Deck
Unlock for access to all 105 flashcards in this deck.
Unlock Deck
k this deck
56
The following twelve data values are provided: The 30th percentile is _____
A)187
B)244
C)250
D)302
E)578
The 30th percentile is _____A)187
B)244
C)250
D)302
E)578
Unlock Deck
Unlock for access to all 105 flashcards in this deck.
Unlock Deck
k this deck
57
The number of standard deviations that a value (x)is above or below the mean is the ___.
A)absolute deviation
B)coefficient of variation
C)interquartile range
D)z score
E)correlation coefficient
A)absolute deviation
B)coefficient of variation
C)interquartile range
D)z score
E)correlation coefficient
Unlock Deck
Unlock for access to all 105 flashcards in this deck.
Unlock Deck
k this deck
58
The empirical rule says that approximately what percentage of the values would be within one standard deviation of the mean in a bell shaped set of data?
A)95%
B)68%
C)50%
D)97.7%
E)100%
A)95%
B)68%
C)50%
D)97.7%
E)100%
Unlock Deck
Unlock for access to all 105 flashcards in this deck.
Unlock Deck
k this deck
59
The following twelve sample data values, with a mean value of 337, are provided: The sample variance is _____
A)308.92
B)30511.33
C)33285.00
D)1145154.08
E)1249259.00
The sample variance is _____A)308.92
B)30511.33
C)33285.00
D)1145154.08
E)1249259.00
Unlock Deck
Unlock for access to all 105 flashcards in this deck.
Unlock Deck
k this deck
60
The following twelve sample data values, with a mean value of 337, are provided: The sample standard deviation is _____
A)17.58
B)174.67
C)182.44
D)1070.12
E)1117.70
The sample standard deviation is _____A)17.58
B)174.67
C)182.44
D)1070.12
E)1117.70
Unlock Deck
Unlock for access to all 105 flashcards in this deck.
Unlock Deck
k this deck
61
Jessica Salas, President of Salas Products, is reviewing the warranty policy for her company's new model of automobile batteries.Life tests performed on a sample of 100 batteries indicated: (1)an average life of 75 months, (2)a standard deviation of 5 months, and (3)a bell shaped battery life distribution.Approximately 95% of the batteries will last between ___.
A)70 and 80 months
B)60 and 90 months
C)65 and 85 months
D)55 and 95 months
E)60 and 100 months
A)70 and 80 months
B)60 and 90 months
C)65 and 85 months
D)55 and 95 months
E)60 and 100 months
Unlock Deck
Unlock for access to all 105 flashcards in this deck.
Unlock Deck
k this deck
62
A commuter travels many kilometres to work each morning.She has timed this trip 5 times during the last month.The time (in minutes)required to make this trip was 44, 39, 41, 35, and 41.The mean time required for this trip was 40 minutes.What is the standard deviation for this sample data?
A)3.32
B)2.97
C)1.73
D)11
E)-1.4
A)3.32
B)2.97
C)1.73
D)11
E)-1.4
Unlock Deck
Unlock for access to all 105 flashcards in this deck.
Unlock Deck
k this deck
63
Jessica Salas, President of Salas Products, is reviewing the warranty policy for her company's new model of automobile batteries.Life tests performed on a sample of 100 batteries indicated: (1)an average life of 75 months, (2)a standard deviation of 5 months, and (3)a bell shaped battery life distribution.Approximately 68% of the batteries will last between ___.
A)70 and 80 months
B)60 and 90 months
C)65 and 85 months
D)55 and 95 months
E)60 and 100 months
A)70 and 80 months
B)60 and 90 months
C)65 and 85 months
D)55 and 95 months
E)60 and 100 months
Unlock Deck
Unlock for access to all 105 flashcards in this deck.
Unlock Deck
k this deck
64
The mean life of a particular brand of light bulb is 1000 hours and the standard deviation is 50 hours.We can conclude that at least 75% of this brand of bulbs will last between ___.
A)900 and 1100 hours
B)950 and 1050 hours
C)850 and 1150 hours
D)800 and 1200 hours
E)1050 and 1250 hours
A)900 and 1100 hours
B)950 and 1050 hours
C)850 and 1150 hours
D)800 and 1200 hours
E)1050 and 1250 hours
Unlock Deck
Unlock for access to all 105 flashcards in this deck.
Unlock Deck
k this deck
65
The mean life of a particular brand of light bulb is 1000 hours and the standard deviation is 50 hours.It can be concluded that at least 89% of this brand of bulbs will last between ___.
A)900 and 1100 hours
B)950 and 1050 hours
C)850 and 1150 hours
D)800 and 1200 hours
E)1050 and 1250 hours
A)900 and 1100 hours
B)950 and 1050 hours
C)850 and 1150 hours
D)800 and 1200 hours
E)1050 and 1250 hours
Unlock Deck
Unlock for access to all 105 flashcards in this deck.
Unlock Deck
k this deck
66
Stock A has a coefficient of variation of 30% and stock B has a coefficient of variation of 35%.Based on this measure of risk, which stock would be considered riskier?
A)Stock A
B)The values are so close, they would be considered to have the same level of risk
C)Stock B
D)Risk cannot be measured by the coefficient of variation
E)There is not enough information to answer
A)Stock A
B)The values are so close, they would be considered to have the same level of risk
C)Stock B
D)Risk cannot be measured by the coefficient of variation
E)There is not enough information to answer
Unlock Deck
Unlock for access to all 105 flashcards in this deck.
Unlock Deck
k this deck
67
A commuter travels many kilometres to work each morning.She has timed this trip 5 times during the last month.The time (in minutes)required to make this trip was 44, 39, 41, 35, and 41.The mean time required for this trip was 40 minutes.What is the variance for this sample data?
A)8.8
B)11
C)0
D)3
E)-2
A)8.8
B)11
C)0
D)3
E)-2
Unlock Deck
Unlock for access to all 105 flashcards in this deck.
Unlock Deck
k this deck
68
The mean life of a particular brand of light bulb is 1000 hours and the standard deviation is 50 hours.Tests show that the life of the bulb is approximately normally distributed.It can be concluded that approximately 68% of the bulbs will last between ___.
A)900 and 1100 hours
B)950 and 1050 hours
C)850 and 1150 hours
D)800 and 1200 hours
E)1050 and 1250 hours
A)900 and 1100 hours
B)950 and 1050 hours
C)850 and 1150 hours
D)800 and 1200 hours
E)1050 and 1250 hours
Unlock Deck
Unlock for access to all 105 flashcards in this deck.
Unlock Deck
k this deck
69
The following box-and-whisker plot was constructed for the age of accounts receivable: The box-and-whisker plot reveals that the accounts receivable ages are ___.
A)skewed to the left
B)skewed to the right
C)not skewed
D)normally distributed
E)symmetrical
The box-and-whisker plot reveals that the accounts receivable ages are ___.A)skewed to the left
B)skewed to the right
C)not skewed
D)normally distributed
E)symmetrical
Unlock Deck
Unlock for access to all 105 flashcards in this deck.
Unlock Deck
k this deck
70
The average starting salary for graduates at a university is $25,000 with a standard deviation of $2,000.If a histogram of the data shows that it takes on a mound shape, the empirical rule says that approximately 68% of the graduates would have a starting salary between ___.
A)$23,000 and $27,000
B)$21,000 and $29,000
C)$19,000 and $31,000
D)$24,000 and $26,000
E)$26,000 and $28,000
A)$23,000 and $27,000
B)$21,000 and $29,000
C)$19,000 and $31,000
D)$24,000 and $26,000
E)$26,000 and $28,000
Unlock Deck
Unlock for access to all 105 flashcards in this deck.
Unlock Deck
k this deck
71
The average starting salary for graduates at a university is $25,000 with a standard deviation of $2,000.If a histogram of the data shows that it takes on a mound shape, the empirical rule says that approximately 95% of the graduates would have a starting salary between ___.
A)$23,000 and $27,000
B)$21,000 and $29,000
C)$19,000 and $31,000
D)$24,000 and $26,000
E)$26,000 and $28,000
A)$23,000 and $27,000
B)$21,000 and $29,000
C)$19,000 and $31,000
D)$24,000 and $26,000
E)$26,000 and $28,000
Unlock Deck
Unlock for access to all 105 flashcards in this deck.
Unlock Deck
k this deck
72
Liz Chapa manages a portfolio of 250 common stocks.Her staff compiled the following performance statistics for two new stocks: The coefficient of variation for Salas Products, Inc.is ___.
A)300%
B)100%
C)33%
D)5%
E)23%
The coefficient of variation for Salas Products, Inc.is ___.A)300%
B)100%
C)33%
D)5%
E)23%
Unlock Deck
Unlock for access to all 105 flashcards in this deck.
Unlock Deck
k this deck
73
Jessica Salas, President of Salas Products, is reviewing the warranty policy for her company's new model of automobile batteries.Life tests performed on a sample of 100 batteries indicated: (1)an average life of 75 months, (2)a standard deviation of 5 months, and (3)a bell shaped battery life distribution.Approximately 99.7% of the batteries will last between ___.
A)70 and 80 months
B)60 and 90 months
C)65 and 85 months
D)55 and 95 months
E)50 and 100 months
A)70 and 80 months
B)60 and 90 months
C)65 and 85 months
D)55 and 95 months
E)50 and 100 months
Unlock Deck
Unlock for access to all 105 flashcards in this deck.
Unlock Deck
k this deck
74
Jessica Salas, President of Salas Products, is reviewing the warranty policy for her company's new model of automobile batteries.Life tests performed on a sample of 100 batteries indicated: (1)an average life of 75 months, (2)a standard deviation of 5 months, and (3)a bell shaped battery life distribution.What percentage of the batteries will fail within the first 65 months of use?
A)0.5%
B)1%
C)2.5%
D)5%
E)7.5%
A)0.5%
B)1%
C)2.5%
D)5%
E)7.5%
Unlock Deck
Unlock for access to all 105 flashcards in this deck.
Unlock Deck
k this deck
75
According to Chebyshev's Theorem, how many values in a data set will be within three standard deviations of the mean?
A)at least 75%
B)at least 68%
C)at least 95%
D)at least 89%
E)at least 99%
A)at least 75%
B)at least 68%
C)at least 95%
D)at least 89%
E)at least 99%
Unlock Deck
Unlock for access to all 105 flashcards in this deck.
Unlock Deck
k this deck
76
A commuter travels many kilometres to work each morning.She has timed this trip 5 times during the last month.The time (in minutes)required to make this trip was 44, 39, 41, 35, and 41.The mean time required for this trip was 40 minutes.What is the mean absolute deviation for this sample data?
A)0
B)12
C)3
D)2.4
E)1.2
A)0
B)12
C)3
D)2.4
E)1.2
Unlock Deck
Unlock for access to all 105 flashcards in this deck.
Unlock Deck
k this deck
77
A given set of normally distributed data values has a mean of 75, a standard deviation of 8.50 and a z-score of 2.45.What is the approximate value of x1?
A)20.82
B)51.00
C)54.18
D)95.85
E)83.82
A)20.82
B)51.00
C)54.18
D)95.85
E)83.82
Unlock Deck
Unlock for access to all 105 flashcards in this deck.
Unlock Deck
k this deck
78
A given set of normally distributed data values has a mean of 335.40 and a standard deviation of 17.95.What is the z score for a value of 295.75?
A)2.21
B)-2.21
C)1.49
D)-1.49
E)There is not enough information to answer
A)2.21
B)-2.21
C)1.49
D)-1.49
E)There is not enough information to answer
Unlock Deck
Unlock for access to all 105 flashcards in this deck.
Unlock Deck
k this deck
79
Liz Chapa manages a portfolio of 250 common stocks.Her staff compiled the following performance statistics for two new stocks. The coefficient of variation for Hot Boards, Inc.is __________.
A)400%
B)100%
C)33%
D)40%
E)25%
The coefficient of variation for Hot Boards, Inc.is __________.A)400%
B)100%
C)33%
D)40%
E)25%
Unlock Deck
Unlock for access to all 105 flashcards in this deck.
Unlock Deck
k this deck
80
A given set of normally distributed data values has a mean of 75, a standard deviation of 8.50 and a z-score of -2.45.What is the approximate value of x1?
A)20.82
B)51.00
C)54.18
D)95.85
E)83.82
A)20.82
B)51.00
C)54.18
D)95.85
E)83.82
Unlock Deck
Unlock for access to all 105 flashcards in this deck.
Unlock Deck
k this deck
Unlock Deck
Unlock for access to all 105 flashcards in this deck.


