Deck 17: Financial Statement Analysis
Full screen (f)
Question
Question
A Current position analysis
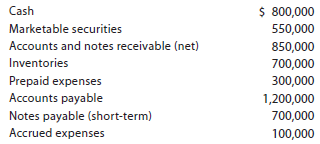
The following items are reported on a company's balance sheet:
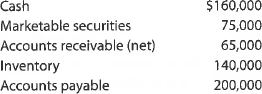
Determine (a) the current ratio and (b) the quick ratio. Round to one decimal place.
B Current position analysis
The following items are reported on a company's balance sheet:
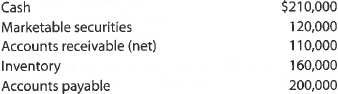
Determine (a) the current ratio and (b) the quick ratio. Round to one decimal place.
The following items are reported on a company's balance sheet:
Determine (a) the current ratio and (b) the quick ratio. Round to one decimal place.
B Current position analysis
The following items are reported on a company's balance sheet:
Determine (a) the current ratio and (b) the quick ratio. Round to one decimal place.
Question
Current position analysis
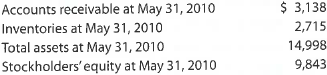
The following data were taken from the balance sheet of Gostkowski Company at the end of two recent fiscal years:
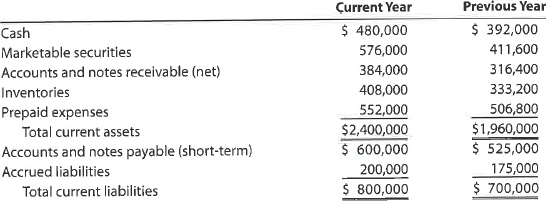
a. Determine for each year (1) the working capital, (2) the current ratio, and (3) the quick ratio. Round ratios to one decimal place.
b. What conclusions can be drawn from these data as to the company's ability to meet its currently maturing debts
The following data were taken from the balance sheet of Gostkowski Company at the end of two recent fiscal years:
a. Determine for each year (1) the working capital, (2) the current ratio, and (3) the quick ratio. Round ratios to one decimal place.
b. What conclusions can be drawn from these data as to the company's ability to meet its currently maturing debts
Question
Inventory analysis
Dell Inc. and Hewlett-Packard Company (HP) compete with each other in the personal computer market. Dell's primary strategy is to assemble computers to customer orders, rather than for inventory. Thus, for example, Dell will build and deliver a computer within four days of a customer entering an order on a Web page. Hewlett-Packard, on the other hand, builds some computers prior to receiving an order, then sells from this inventory once an order is received. Selected financial information for both companies from a recent year's financial statements follows (in millions):
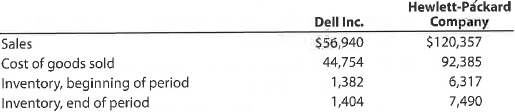
a. Determine for both companies (1) the inventory turnover and (2) the number of days' sales in inventory. Round to one decimal place.
b. Interpret the inventory ratios by considering Dell's and Hewlett-Packard's operating strategies.
Dell Inc. and Hewlett-Packard Company (HP) compete with each other in the personal computer market. Dell's primary strategy is to assemble computers to customer orders, rather than for inventory. Thus, for example, Dell will build and deliver a computer within four days of a customer entering an order on a Web page. Hewlett-Packard, on the other hand, builds some computers prior to receiving an order, then sells from this inventory once an order is received. Selected financial information for both companies from a recent year's financial statements follows (in millions):
a. Determine for both companies (1) the inventory turnover and (2) the number of days' sales in inventory. Round to one decimal place.
b. Interpret the inventory ratios by considering Dell's and Hewlett-Packard's operating strategies.
Question
Question
Effect of transactions on current position analysis
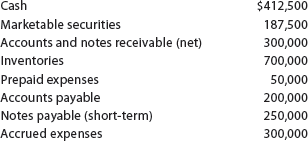
Data pertaining to the current position of Forte Company follow:
Instructions
1. Compute (a) the working capital, (b) the current ratio, and (c) the quick ratio. Round ratios in parts b through j to one decimal place.
2. List the following captions on a sheet of paper:

Compute the working capital, the current ratio, and the quick ratio after each of the following transactions and record the results in the appropriate columns. Consider each transaction separately and assume that only that transaction affects the data given. Round to one decimal place.
a. Sold marketable securities at no gain or loss, $70,000.
b. Paid accounts payable, $125,000.
c. Purchased goods on account, $110,000.
d. Paid notes payable, $100,000.
e. Declared a cash dividend, $150,000.
f. Declared a common stock dividend on common stock, $50,000.
g. Borrowed cash from bank on a long-term note, $225,000.
h. Received cash on account, $125,000.
i. Issued additional shares of stock for cash, $600,000.
j. Paid cash for prepaid expenses, $10,000.
Data pertaining to the current position of Forte Company follow:
Instructions
1. Compute (a) the working capital, (b) the current ratio, and (c) the quick ratio. Round ratios in parts b through j to one decimal place.
2. List the following captions on a sheet of paper:
Compute the working capital, the current ratio, and the quick ratio after each of the following transactions and record the results in the appropriate columns. Consider each transaction separately and assume that only that transaction affects the data given. Round to one decimal place.
a. Sold marketable securities at no gain or loss, $70,000.
b. Paid accounts payable, $125,000.
c. Purchased goods on account, $110,000.
d. Paid notes payable, $100,000.
e. Declared a cash dividend, $150,000.
f. Declared a common stock dividend on common stock, $50,000.
g. Borrowed cash from bank on a long-term note, $225,000.
h. Received cash on account, $125,000.
i. Issued additional shares of stock for cash, $600,000.
j. Paid cash for prepaid expenses, $10,000.
Question
Long-term solvency analysis
The following information was taken from Kellman Company's balance sheet:
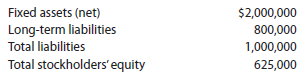
Determine the company's (a) ratio of fixed assets to long-term liabilities and (b) ratio of liabilities to stockholders' equity.
The following information was taken from Charu Company's balance sheet:
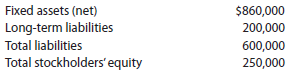
Determine the company's (a) ratio of fixed assets to long-term liabilities and (b) ratio of liabilities to stockholders' equity.
The following information was taken from Kellman Company's balance sheet:
Determine the company's (a) ratio of fixed assets to long-term liabilities and (b) ratio of liabilities to stockholders' equity.
The following information was taken from Charu Company's balance sheet:
Determine the company's (a) ratio of fixed assets to long-term liabilities and (b) ratio of liabilities to stockholders' equity.
Question
Ratio of liabilities to stockholders' equity and number of times interest charges are earned
The following data were taken from the financial statements of Hunter Inc. for December 31 of two recent years:
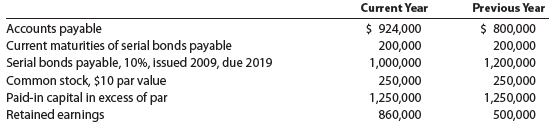
The income before income tax was $480,000 and $420,000 for the current and previous years, respectively.
a. Determine the ratio of liabilities to stockholders' equity at the end of each year. Round to one decimal place.
b. Determine the number of times the bond interest charges are earned during the year for both years. Round to one decimal place.
c. What conclusions can be drawn from these data as to the company's ability to meet its currently maturing debts
The following data were taken from the financial statements of Hunter Inc. for December 31 of two recent years:
The income before income tax was $480,000 and $420,000 for the current and previous years, respectively.
a. Determine the ratio of liabilities to stockholders' equity at the end of each year. Round to one decimal place.
b. Determine the number of times the bond interest charges are earned during the year for both years. Round to one decimal place.
c. What conclusions can be drawn from these data as to the company's ability to meet its currently maturing debts
Question
Vertical analysis of income statement
Revenue and expense data for Gresham Inc. for two recent years are as follows:
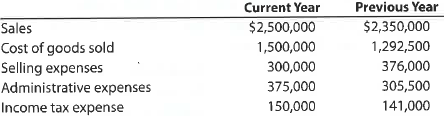
a. Prepare an income statement in comparative form, stating each item for both years as a percent of sales. Round to one decimal place.
b. Comment on the significant changes disclosed by the comparative income statement.
Revenue and expense data for Gresham Inc. for two recent years are as follows:
a. Prepare an income statement in comparative form, stating each item for both years as a percent of sales. Round to one decimal place.
b. Comment on the significant changes disclosed by the comparative income statement.
Question
Effect of transactions on current position analysis
Data pertaining to the current position of Lucroy Industries Inc. are as follows:
Instructions
1. Compute (a) the working capital, (b) the current ratio, and (c) the quick ratio. Round to one decimal place.
2. List the following captions on a sheet of paper:

compute the working capital, the current ratio, and the quick ratio after each of the following transactions, andrecord the results in the appropriate columns. Consider each transaction separately and assume that only that transactiom affects the data given. Round to one decimal place.
a. Sold marketable securities at no gain or loss, $500,000.
b. Paid accounts payable, $287,500.
c. Purchased goods on account, $400,000.
d. Paid notes payable, $125,000.
e. Declared a cash dividend, $325,000.
f. Declared a common stock dividend on common stock, $150,000.
g. Borrowed cash from bank on a long-term note, $1,000,000.
h. Received cash on account, $75,000.
i. Issued additional shares of stock for cash, $2,000,000.
j. Paid cash for prepaid expenses, $200,000
Data pertaining to the current position of Lucroy Industries Inc. are as follows:
Instructions
1. Compute (a) the working capital, (b) the current ratio, and (c) the quick ratio. Round to one decimal place.
2. List the following captions on a sheet of paper:
compute the working capital, the current ratio, and the quick ratio after each of the following transactions, andrecord the results in the appropriate columns. Consider each transaction separately and assume that only that transactiom affects the data given. Round to one decimal place.
a. Sold marketable securities at no gain or loss, $500,000.
b. Paid accounts payable, $287,500.
c. Purchased goods on account, $400,000.
d. Paid notes payable, $125,000.
e. Declared a cash dividend, $325,000.
f. Declared a common stock dividend on common stock, $150,000.
g. Borrowed cash from bank on a long-term note, $1,000,000.
h. Received cash on account, $75,000.
i. Issued additional shares of stock for cash, $2,000,000.
j. Paid cash for prepaid expenses, $200,000
Question
Question
Ratio of liabilities to stockholders' equity and number of times interest charges are earned
Hasbro and Mattel, Inc., are the two largest toy companies in North America. Condensed liabilities and stockholders' equity from a recent balance sheet are shown for each company as follows (in thousands):
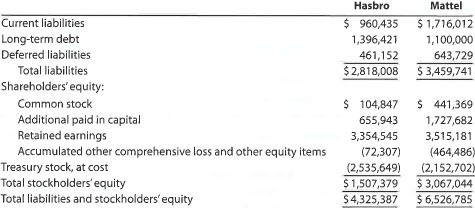
The income from operations and interest expense from the income statement for each company were as follows (in thousands):
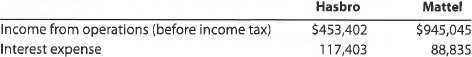
a. Determine the ratio of liabilities to stockholders' equity for both companies. Round to one decimal place.
b. Determine the number of times interest charges are earned for both companies. Round to one decimal place.
c. Interpret the ratio differences between the two companies.
Hasbro and Mattel, Inc., are the two largest toy companies in North America. Condensed liabilities and stockholders' equity from a recent balance sheet are shown for each company as follows (in thousands):
The income from operations and interest expense from the income statement for each company were as follows (in thousands):
a. Determine the ratio of liabilities to stockholders' equity for both companies. Round to one decimal place.
b. Determine the number of times interest charges are earned for both companies. Round to one decimal place.
c. Interpret the ratio differences between the two companies.
Question
Financial Statement Analysis
The financial statements for Nike, Inc., are presented in Appendix C at the end of the text. The following additional information (in thousands) is available:
Instructions
1. Determine the following measures for the fiscal years ended May 31, 2013 (fiscal 2012), and May 31, 2012 (fiscal 2011), rounding to one decimal place.
a. Working capital
b. Current ratio
c. Quick ratio
d. Accounts receivable turnover
e. Number of days' sales in receivables
f. Inventory turnover
g. Number of days' sales in inventory
h. Ratio of liabilities to stockholders' equity
i. Ratio of sales to assets
j. Rate earned on total assets, assuming interest expense is $23 million for the year ending May 31, 2013, and $31 million for the year ending May 31, 2012
k. Rate earned on common stockholders' equity
l. Price-earnings ratio, assuming that the market price was $61.66 per share on May 31, 2013, and $53.10 per share on May 31, 2012
m. Percentage relationship of net income to sales
2. What conclusions can be drawn from these analyses
Question
Profitability and stockholder ratios
Deere Co. manufactures and distributes farm and construction machinery that it sells around the world. In addition to its manufacturing operations, Deere Co.'s credit division loans money to customers to finance the purchase of their farm and construction equipment.
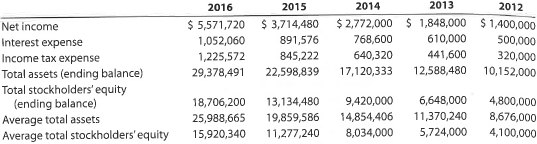
The following information is available for three recent years (in millions except per-share amounts):
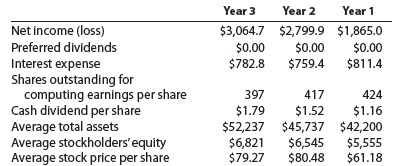
1. Calculate the following ratios for each year (Round percentages to one decimal place):
a. Rate earned on total assets
b. Rate earned on stockholders' equity
c. Earnings per share
d. Dividend yield
e. Price-earnings ratio
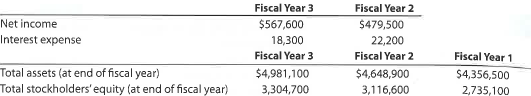
2. What is the ratio of average liabilities to average stockholders' equity for Year 3
3. Based on these data, evaluate Deere Co.'s performance
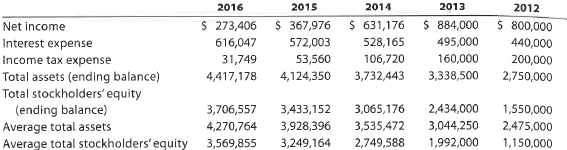
Deere Co. manufactures and distributes farm and construction machinery that it sells around the world. In addition to its manufacturing operations, Deere Co.'s credit division loans money to customers to finance the purchase of their farm and construction equipment.
The following information is available for three recent years (in millions except per-share amounts):
1. Calculate the following ratios for each year (Round percentages to one decimal place):
a. Rate earned on total assets
b. Rate earned on stockholders' equity
c. Earnings per share
d. Dividend yield
e. Price-earnings ratio
2. What is the ratio of average liabilities to average stockholders' equity for Year 3
3. Based on these data, evaluate Deere Co.'s performance
Question
Current position analysis
PepsiCo, Inc. , the parent company of Frito-Lay snack foods and Pepsi beverages, had the following current assets and current liabilities at the end of two recent years:
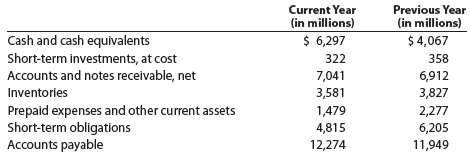
a. Determine the (1) current ratio and (2) quick ratio for both years. Round to one decimal place.
b. What conclusions can you draw from these data
PepsiCo, Inc. , the parent company of Frito-Lay snack foods and Pepsi beverages, had the following current assets and current liabilities at the end of two recent years:
a. Determine the (1) current ratio and (2) quick ratio for both years. Round to one decimal place.
b. What conclusions can you draw from these data
Question
Ratio of liabilities to stockholders' equity and ratio of fixed assets to long-term liabilities
Recent balance sheet information for two companies in the food industry, Mondelez International, Inc., and The Hershey Company, is as follows (in thousands of dollars):
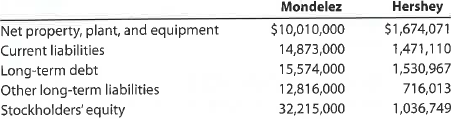
a. Determine the ratio of liabilities to stockholders' equity for both companies. Round to one decimal place.
b. Determine the ratio of fixed assets to long-term liabilities for both companies. Round to one decimal place.
c. Interpret the ratio differences between the two companies.
Recent balance sheet information for two companies in the food industry, Mondelez International, Inc., and The Hershey Company, is as follows (in thousands of dollars):
a. Determine the ratio of liabilities to stockholders' equity for both companies. Round to one decimal place.
b. Determine the ratio of fixed assets to long-term liabilities for both companies. Round to one decimal place.
c. Interpret the ratio differences between the two companies.
Question
A Horizontal analysis
The comparative temporary investments and inventory balances of a company follow.
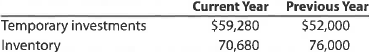
Based on this information, what is the amount and percentage of increase or decrease that would be shown in a balance sheet with horizontal analysis
B Horizontal analysis
The comparative accounts payable and long-term debt balances for a company follow.
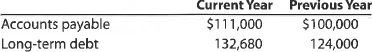
Based on this information, what is the amount and percentage of increase or decrease that would be shown in a balance sheet with horizontal analysis
The comparative temporary investments and inventory balances of a company follow.
Based on this information, what is the amount and percentage of increase or decrease that would be shown in a balance sheet with horizontal analysis
B Horizontal analysis
The comparative accounts payable and long-term debt balances for a company follow.
Based on this information, what is the amount and percentage of increase or decrease that would be shown in a balance sheet with horizontal analysis
Question
Question
Times interest charges are earned
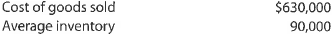
A company reports the following:
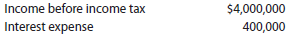
Determine the number of times interest charges are earned.
A company reports the following:
Determine the number of times interest charges are earned.
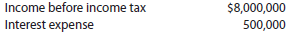
A company reports the following:
Determine the number of times interest charges are earned.
A company reports the following:
Determine the number of times interest charges are earned.
Question
Ratio of sales to assets
Three major segments of the transportation industry are motor carriers, such as YRC Worldwide; railroads, such as Union Pacific; and transportation arrangement services, such as C.H. Robinson Worldwide Inc. Recent financial statement information for these three companies is shown as follows (in thousands of dollars):
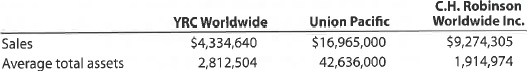
a. Determine the ratio of sales to assets for all three companies. Round to one decimal place.
b. Assume that the ratio of sales to assets for each company represents their respective industry segment. Interpret the differences in the ratio of sales to assets in terms of the operating characteristics of each of the respective segments.
Three major segments of the transportation industry are motor carriers, such as YRC Worldwide; railroads, such as Union Pacific; and transportation arrangement services, such as C.H. Robinson Worldwide Inc. Recent financial statement information for these three companies is shown as follows (in thousands of dollars):
a. Determine the ratio of sales to assets for all three companies. Round to one decimal place.
b. Assume that the ratio of sales to assets for each company represents their respective industry segment. Interpret the differences in the ratio of sales to assets in terms of the operating characteristics of each of the respective segments.
Question
Horizontal analysis of income statement
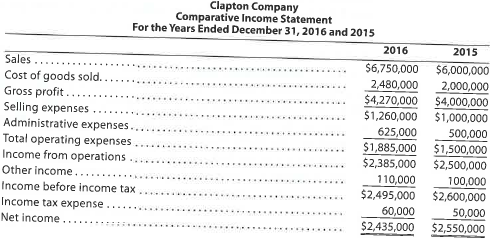
For 2016, Clapton Company reported a decline in net income. At the end of the year, S. Hand, the president, is presented with the following condensed comparative income statement:
Instructions
1. Prepare a comparative income statement with horizontal analysis for the two-year period, using 2015 as the base year. Round to one decimal place.
2. To the extent the data permit, comment on the significant relationships revealed by the horizontal analysis prepared in (1).
Question
Vertical analysis of balance sheet
Balance sheet data for Novak Company on December 31, the end of two recent fiscal years, follows:
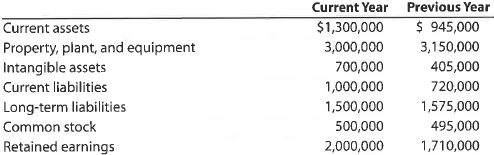
Prepare a comparative balance sheet for both years, stating each asset as a percent of total assets and each liability and stockholders' equity item as a percent of the total liabilities and stockholders' equity. Round to one decimal place.
Balance sheet data for Novak Company on December 31, the end of two recent fiscal years, follows:
Prepare a comparative balance sheet for both years, stating each asset as a percent of total assets and each liability and stockholders' equity item as a percent of the total liabilities and stockholders' equity. Round to one decimal place.
Question
Question
Profitability ratios
The following selected data were taken from the financial statements of Robinson Inc. for December 31, 2016, 2015 and 2014:
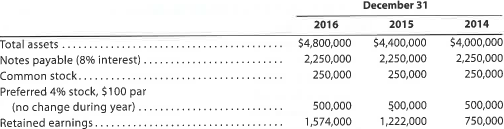
The 2016 net income was $372,000, and the 2015 net income was $492,000. No dividends on common stock were declared between 2014 and 2016.
a. Determine the rate earned on total assets, the rate earned on stockholders' equity, and the rate earned on common stockholders' equity for the years 2015 and 2016. Round to one decimal place.
b. What conclusions can be drawn from these data as to the company's profitability
The following selected data were taken from the financial statements of Robinson Inc. for December 31, 2016, 2015 and 2014:
The 2016 net income was $372,000, and the 2015 net income was $492,000. No dividends on common stock were declared between 2014 and 2016.
a. Determine the rate earned on total assets, the rate earned on stockholders' equity, and the rate earned on common stockholders' equity for the years 2015 and 2016. Round to one decimal place.
b. What conclusions can be drawn from these data as to the company's profitability
Question
Horizontal analysis of income statement
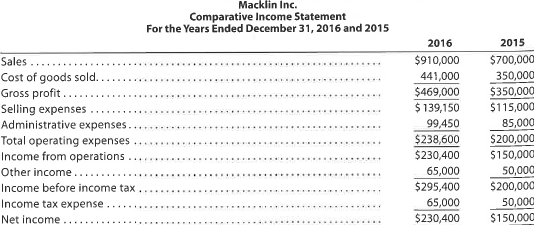
For 2016, Macklin Inc. reported a significant increase in net income. At the end of the year, John Mayer, the president, is presented with the following condensed comparative income statement:
Instructions
1. Prepare a comparative income statement with horizontal analysis for the two-year period, using 2015 as the base year. Round to one decimal place.
2. To the extent the data permit, comment on the significant relationships revealed by the horizontal analysis prepared in (1).
Question
A Accounts receivable analysis
A company reports the following:
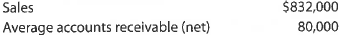
Determine (a) the accounts receivable turnover and (b) the number of days' sales in receivables. Round to one decimal place.
B Accounts receivable analysis
A company reports the following:
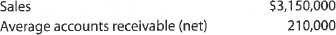
Determine (a) the accounts receivable turnover and (b) the number of days' sales in receivables. Round to one decimal place.
A company reports the following:
Determine (a) the accounts receivable turnover and (b) the number of days' sales in receivables. Round to one decimal place.
B Accounts receivable analysis
A company reports the following:
Determine (a) the accounts receivable turnover and (b) the number of days' sales in receivables. Round to one decimal place.
Question
Current position analysis
The bond indenture for the 10-year, 9% debenture bonds issued January 2, 2015, required working capital of $100,000, a current ratio of 1.5, and a quick ratio of 1.0 at the end of each calendar year until the bonds mature. At December 31, 2016, the three measures were computed as follows:
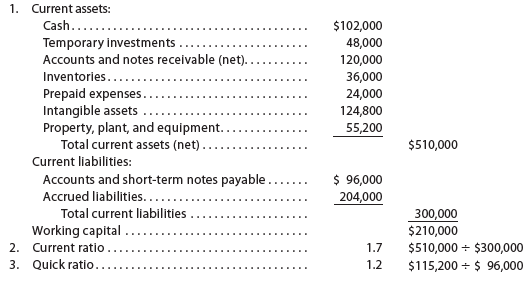
a. List the errors in the determination of the three measures of current position analysis.
b. Is the company satisfying the terms of the bond indenture
The bond indenture for the 10-year, 9% debenture bonds issued January 2, 2015, required working capital of $100,000, a current ratio of 1.5, and a quick ratio of 1.0 at the end of each calendar year until the bonds mature. At December 31, 2016, the three measures were computed as follows:
a. List the errors in the determination of the three measures of current position analysis.
b. Is the company satisfying the terms of the bond indenture
Question
Profitability ratios
Ralph Lauren Corp. sells men's apparel through company-owned retail stores. Recent financial information for Ralph Lauren follows (all numbers in thousands):
Assume the apparel industry average rate earned on total assets is 8.0%, and the average rate earned on stockholders' equity is 10.0% for the year ended April 2, Year 3.
a. Determine the rate earned on total assets for Ralph Lauren for fiscal Years 2 and 3. Round to one digit after the decimal place.
b. Determine the rate earned on stockholders' equity for Ralph Lauren for fiscal Years 2 and 3. Round to one decimal place.
c. Evaluate the two-year trend for the profitability ratios determined in (a) and (b).
d. Evaluate Ralph Lauren's profit performance relative to the industry.
Question
Question
Nineteen measures of solvency and profitability
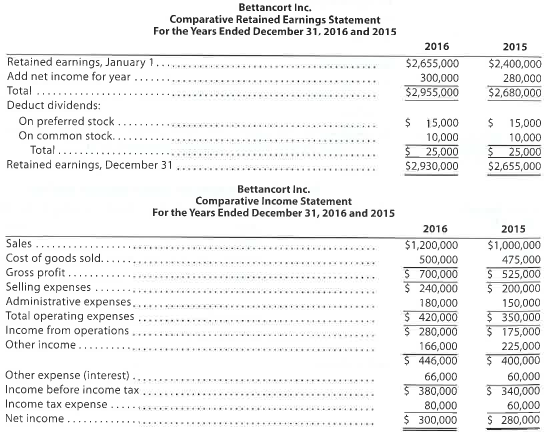
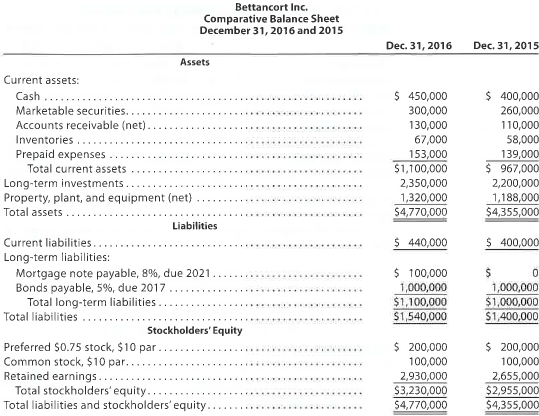
The comparative financial statements of Bettancort Inc. are as follows. The market price of Bettancort Inc. common stock was $71.25 on December 31, 2016.
Instructions
Determine the following measures for 2016, rounding to one decimal place:
1. Working capital
2. Current ratio
3. Quick ratio
4. Accounts receivable turnover
5. Number of days' sales in receivables
6. Inventory turnover
7. Number of days' sales in inventory
8. Ratio of fixed assets to long-term liabilities
9. Ratio of liabilities to stockholders' equity
10. Number of times interest charges are earned
11. Number of times preferred dividends are earned
12. Ratio of sales to assets
13. Rate earned on total assets
14. Rate earned on stockholders' equity
15. Rate earned on common stockholders' equity
16. Earnings per share on common stock
17. Price-earnings ratio
18. Dividends per share of common stock
19. Dividend yield
Question
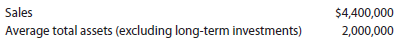
Sales to assets
A company reports the following:

Determine the ratio of sales to assets.
A company reports the following:
Determine the ratio of sales to assets.
A company reports the following:
Determine the ratio of sales to assets.
A company reports the following:
Determine the ratio of sales to assets.
Question
Six measures of solvency or profitability
The following data were taken from the financial statements of Gates Inc. for the current fiscal year. Assuming that long-term investments totaled $3,000,000 throughout the year and that total assets were $7,000,000 at the beginning of the current fiscal year, determine the following: (a) ratio of fixed assets to long-term liabilities, (b) ratio of liabilities to stockholders' equity, (c) ratio of sales to assets, (d) rate earned on total assets, (e) rate earned on stockholders' equity, and (f) rate earned on common stockholders' equity. Round to one decimal place.
The following data were taken from the financial statements of Gates Inc. for the current fiscal year. Assuming that long-term investments totaled $3,000,000 throughout the year and that total assets were $7,000,000 at the beginning of the current fiscal year, determine the following: (a) ratio of fixed assets to long-term liabilities, (b) ratio of liabilities to stockholders' equity, (c) ratio of sales to assets, (d) rate earned on total assets, (e) rate earned on stockholders' equity, and (f) rate earned on common stockholders' equity. Round to one decimal place.
Question
Question
Nineteen measures of solvency and profitability
The comparative financial statements of Stargel Inc. are as follows. The market price of Stargel Inc. common stock was $119.70 on December 31, 2016.
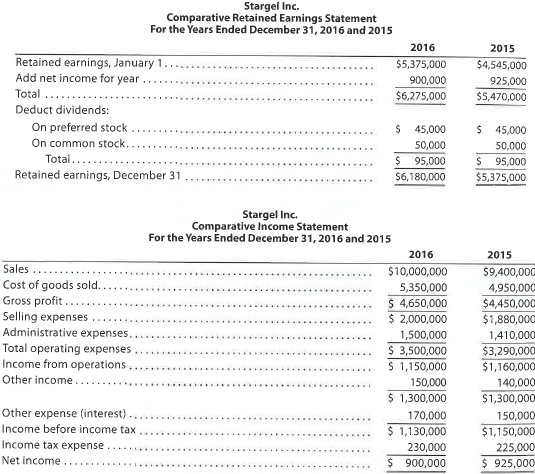
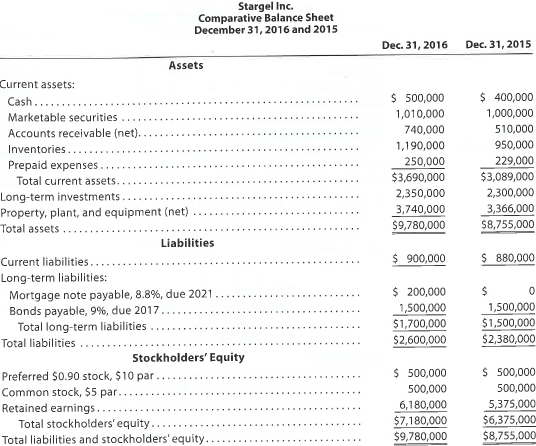
Instructions
Determine the following measures for 2016, rounding to one decimal place, except per-share amounts, which should be rounded to the nearest penny:
1. Working capital
2. Current ratio
3. Quick ratio
4. Accounts receivable turnover
5. Number of days' sales in receivables
6. Inventory turnover
7. Number of days' sales in inventory
8. Ratio of fixed assets to long-term liabilities
9. Ratio of liabilities to stockholders' equity
10. Number of times interest charges are earned
11. Number of times preferred dividends are earned
12. Ratio of sales to assets
13. Rate earned on total assets
14. Rate earned on stockholders' equity
15. Rate earned on common stockholders' equity
16. Earnings per share on common stock
17. Price-earnings ratio
18. Dividends per share of common stock
19. Dividend yield
The comparative financial statements of Stargel Inc. are as follows. The market price of Stargel Inc. common stock was $119.70 on December 31, 2016.
Instructions
Determine the following measures for 2016, rounding to one decimal place, except per-share amounts, which should be rounded to the nearest penny:
1. Working capital
2. Current ratio
3. Quick ratio
4. Accounts receivable turnover
5. Number of days' sales in receivables
6. Inventory turnover
7. Number of days' sales in inventory
8. Ratio of fixed assets to long-term liabilities
9. Ratio of liabilities to stockholders' equity
10. Number of times interest charges are earned
11. Number of times preferred dividends are earned
12. Ratio of sales to assets
13. Rate earned on total assets
14. Rate earned on stockholders' equity
15. Rate earned on common stockholders' equity
16. Earnings per share on common stock
17. Price-earnings ratio
18. Dividends per share of common stock
19. Dividend yield
Question
Question
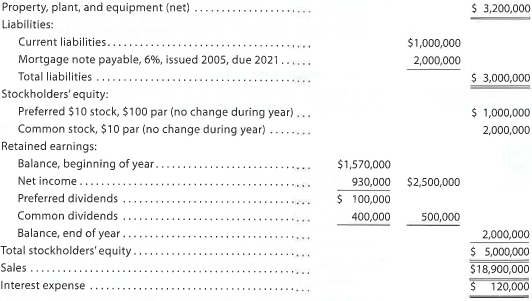
Six measures of solvency or profitability
The balance sheet for Garcon Inc. at the end of the current fiscal year indicated the following:
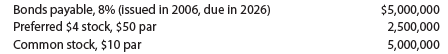
Income before income tax was $3,000,000, and income taxes were $1,200,000 for the current year. Cash dividends paid on common stock during the current year totaled $1,200,000. The common stock was selling for $32 per share at the end of the year. Determine each of the following: (a) number of times bond interest charges are earned, (b) number of times preferred dividends are earned, (c) earnings per share on common stock, (d) price-earnings ratio, (e) dividends per share of common stock, and (f) dividend yield. Round to one decimal place, except earnings per share, which should be rounded to two decimal places.
The balance sheet for Garcon Inc. at the end of the current fiscal year indicated the following:
Income before income tax was $3,000,000, and income taxes were $1,200,000 for the current year. Cash dividends paid on common stock during the current year totaled $1,200,000. The common stock was selling for $32 per share at the end of the year. Determine each of the following: (a) number of times bond interest charges are earned, (b) number of times preferred dividends are earned, (c) earnings per share on common stock, (d) price-earnings ratio, (e) dividends per share of common stock, and (f) dividend yield. Round to one decimal place, except earnings per share, which should be rounded to two decimal places.
Question
Vertical analysis of income statement
The following comparative income statement (in thousands of dollars) for the two recent fiscal years was adapted from the annual report of Speedway Motorsports, Inc., owner and operator of several major motor speedways, such as the Atlanta, Texas, and Las Vegas Motor Speedways.
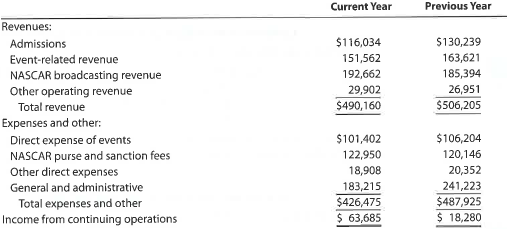
a. Prepare a comparative income statement for these two years in vertical form, stating each item as a percent of revenues. Round to one decimal place.
b. Comment on the significant changes.
The following comparative income statement (in thousands of dollars) for the two recent fiscal years was adapted from the annual report of Speedway Motorsports, Inc., owner and operator of several major motor speedways, such as the Atlanta, Texas, and Las Vegas Motor Speedways.
a. Prepare a comparative income statement for these two years in vertical form, stating each item as a percent of revenues. Round to one decimal place.
b. Comment on the significant changes.
Question
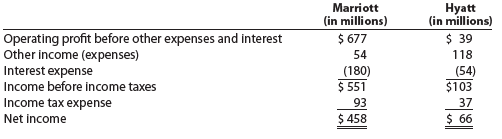
Comprehensive profitability and solvency analysis
Marriott International, Inc. , and Hyatt Hotels Corporation are two major owners and managers of lodging and resort properties in the United States. Abstracted income statement information for the two companies is as follows for a recent year:
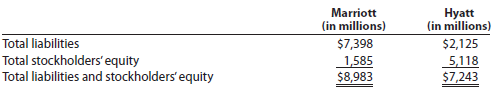
Balance sheet information is as follows:
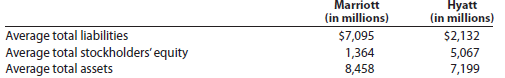
The average liabilities, average stockholders' equity, and average total assets were as follows:
1. Determine the following ratios for both companies (round to one decimal place after the whole percent):
a. Rate earned on total assets
b. Rate earned on stockholders' equity
c. Number of times interest charges are earned
d. Ratio of liabilities to stockholders' equity
2. Analyze and compare the two companies, using the information in (1)
Marriott International, Inc. , and Hyatt Hotels Corporation are two major owners and managers of lodging and resort properties in the United States. Abstracted income statement information for the two companies is as follows for a recent year:
Balance sheet information is as follows:
The average liabilities, average stockholders' equity, and average total assets were as follows:
1. Determine the following ratios for both companies (round to one decimal place after the whole percent):
a. Rate earned on total assets
b. Rate earned on stockholders' equity
c. Number of times interest charges are earned
d. Ratio of liabilities to stockholders' equity
2. Analyze and compare the two companies, using the information in (1)
Question
Accounts receivable analysis
The following data are taken from the financial statements of Krawcheck Inc. Terms of all sales are 2/10, n/55.

a. For 2015 and 2016, determine (1) the accounts receivable turnover and (2) the number of days' sales in receivables. Round to the nearest dollar and one decimal place.
b. What conclusions can be drawn from these data concerning accounts receivable and credit policies
The following data are taken from the financial statements of Krawcheck Inc. Terms of all sales are 2/10, n/55.
a. For 2015 and 2016, determine (1) the accounts receivable turnover and (2) the number of days' sales in receivables. Round to the nearest dollar and one decimal place.
b. What conclusions can be drawn from these data concerning accounts receivable and credit policies
Question
Earnings per share, price-earnings ratio, dividend yield
The following information was taken from the financial statements of Tolbert Inc. for December 31 of the current fiscal year:

The net income was $1,750,000, and the declared dividends on the common stock were $1,125,000 for the current year. The market price of the common stock is $45 per share.
For the common stock, determine (a) the earnings per share, (b) the price-earnings ratio, (c) the dividends per share, and (d) the dividend yield. Round ratios and percentages to one decimal place, except for per-share amounts.
The following information was taken from the financial statements of Tolbert Inc. for December 31 of the current fiscal year:
The net income was $1,750,000, and the declared dividends on the common stock were $1,125,000 for the current year. The market price of the common stock is $45 per share.
For the common stock, determine (a) the earnings per share, (b) the price-earnings ratio, (c) the dividends per share, and (d) the dividend yield. Round ratios and percentages to one decimal place, except for per-share amounts.
Question
A Vertical analysis
Income statement information for Axiom Corporation follows:
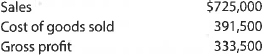
Prepare a vertical analysis of the income statement for Axiom Corporation.
B Vertical analysis
Income statement information for Einsworth Corporation follows:
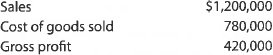
Prepare a vertical analysis of the income statement for Einsworth Corporation.
Income statement information for Axiom Corporation follows:
Prepare a vertical analysis of the income statement for Axiom Corporation.
B Vertical analysis
Income statement information for Einsworth Corporation follows:
Prepare a vertical analysis of the income statement for Einsworth Corporation.
Question
Question
Rate earned on total assets
A company reports the following income statement and balance sheet information for the current year:
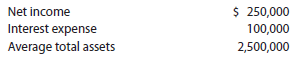
Determine the rate earned on total assets.
A company reports the following income statement and balance sheet information for the current year:
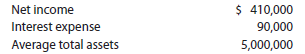
Determine the rate earned on total assets.
A company reports the following income statement and balance sheet information for the current year:
Determine the rate earned on total assets.
A company reports the following income statement and balance sheet information for the current year:
Determine the rate earned on total assets.
Question
Price-earnings ratio; dividend yield
The table that follows shows the stock price, earnings per share, and dividends per share for three companies for a recent year:
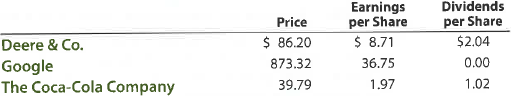
a. Determine the price-earnings ratio and dividend yield for the three companies. Round to one decimal place.
b. Explain the differences in these ratios across the three companies.
The table that follows shows the stock price, earnings per share, and dividends per share for three companies for a recent year:
a. Determine the price-earnings ratio and dividend yield for the three companies. Round to one decimal place.
b. Explain the differences in these ratios across the three companies.
Question
Vertical analysis of income statement
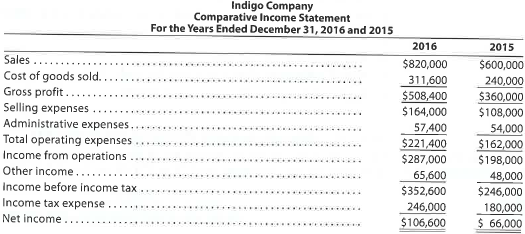
For 2016, Indigo Company initiated a sales promotion campaign that included the expenditure of an additional $39,000 for advertising. At the end of the year, Lumi Neer, the president, is presented with the following condensed comparative income statement:
Instructions
1. Prepare a comparative income statement for the two-year period, presenting an analysis of each item in relationship to sales for each of the years. Round to one decimal place.
2. To the extent the data permit, comment on the significant relationships revealed by the vertical analysis prepared in (1).
Question
Horizontal analysis of the income statement
Income statement data for Moreno Company for two recent years ended December 31, are as follows:
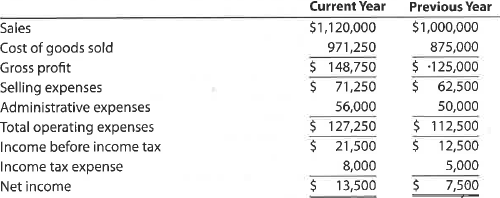
a. Prepare a comparative income statement with horizontal analysis, indicating the increase (decrease) for the current year when compared with the previous year. Round to one decimal place.
b. What conclusions can be drawn from the horizontal analysis
Income statement data for Moreno Company for two recent years ended December 31, are as follows:
a. Prepare a comparative income statement with horizontal analysis, indicating the increase (decrease) for the current year when compared with the previous year. Round to one decimal place.
b. What conclusions can be drawn from the horizontal analysis
Question
Question
Question
Vertical analysis of income statement
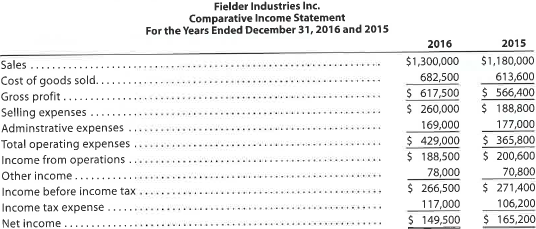
For 2016, Fielder Industries Inc. initiated a sales promotion campaign that included the expenditure of an additional $40,000 for advertising. At the end of the year, Leif Grando, the president, is presented with the following condensed comparative income statement:
Instructions
1. Prepare a comparative income statement for the two-year period, presenting an analysis of each item in relationship to sales for each of the years. Round to one decimal place.
2. To the extent the data permit, comment on the significant relationships revealed by the vertical analysis prepared in (1).
Question
A Inventory analysis
A company reports the following:
Determine (a) the inventory turnover and (b) the number of days' sales in inventoiy Round to one decimal place.
B Inventory analysis
A company reports the following:
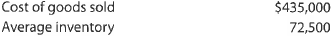
Determine (a) the inventory turnover and (b) the number of days' sales in inventoiy. Round to one decimal place.
A company reports the following:
Determine (a) the inventory turnover and (b) the number of days' sales in inventoiy Round to one decimal place.
B Inventory analysis
A company reports the following:
Determine (a) the inventory turnover and (b) the number of days' sales in inventoiy. Round to one decimal place.
Question
Accounts receivable analysis
Xavier Stores Company and Lestrade Stores Inc. are large retail department stores. Both companies offer credit to their customers through their own credit card operations. Information from the financial statements for both companies for two recent years is as follows (all numbers are in millions):
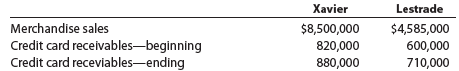
a. Determine the (1) accounts receivable turnover and (2) the number of days' sales in receivables for both companies. Round to one decimal place.
b. Compare the two companies with regard to their credit card policies.
Xavier Stores Company and Lestrade Stores Inc. are large retail department stores. Both companies offer credit to their customers through their own credit card operations. Information from the financial statements for both companies for two recent years is as follows (all numbers are in millions):
a. Determine the (1) accounts receivable turnover and (2) the number of days' sales in receivables for both companies. Round to one decimal place.
b. Compare the two companies with regard to their credit card policies.
Question
Question
Vertical analysis
The condensed income statements through income from operations for Dell Inc. and Apple Inc. for recent fiscal years follow (numbers in millions of dollars):
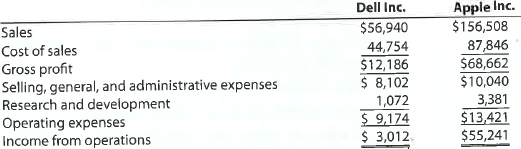
Prepare comparative common-sized statements, rounding percents to one decimal place. Interpret the analyses.
The condensed income statements through income from operations for Dell Inc. and Apple Inc. for recent fiscal years follow (numbers in millions of dollars):
Prepare comparative common-sized statements, rounding percents to one decimal place. Interpret the analyses.
Question
Solvency and profitability trend analysis
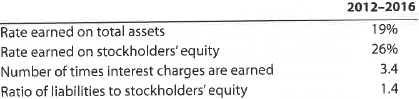
Addai Company has provided the following comparative information:
You have been asked to evaluate the historical performance of the company over the last five years.
Selected industry ratios have remained relatively steady at the following levels for the last five years:
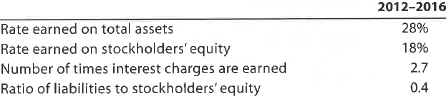
Instructions
1. Prepare four line graphs with the ratio on the vertical axis and the years on the horizontal axis for the following four ratios (rounded to one decimal place):
a. Rate earned on total assets
b. Rate earned on stockholders' equity
c. Number of times interest charges are earned
d. Ratio of liabilities to stockholders' equity
Display both the company ratio and the industry benchmark on each graph. That is, each graph should have two lines.
2. Prepare an analysis of the graphs in (1).
Addai Company has provided the following comparative information:
You have been asked to evaluate the historical performance of the company over the last five years.
Selected industry ratios have remained relatively steady at the following levels for the last five years:
Instructions
1. Prepare four line graphs with the ratio on the vertical axis and the years on the horizontal axis for the following four ratios (rounded to one decimal place):
a. Rate earned on total assets
b. Rate earned on stockholders' equity
c. Number of times interest charges are earned
d. Ratio of liabilities to stockholders' equity
Display both the company ratio and the industry benchmark on each graph. That is, each graph should have two lines.
2. Prepare an analysis of the graphs in (1).
Question
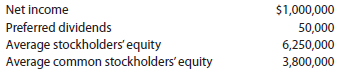
Common stockholders' profitability analysis
A company reports the following:
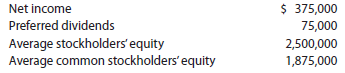
Determine (a) the rate earned on stockholders' equity and (b) the rate earned on common stockholders' equity. Round to one decimal place.
A company reports the following:
Determine (a) the rate earned on stockholders' equity and (b) the rate earned on common stockholders' equity. Round to one decimal place.
A company reports the following:
Determine (a) the rate earned on stockholders' equity and (b) the rate earned on common stockholders' equity. Round to one decimal place.
A company reports the following:
Determine (a) the rate earned on stockholders' equity and (b) the rate earned on common stockholders' equity. Round to one decimal place.
Question
Income statement and earnings per share for extraordinary items and discontinued operations
Apex Inc. reports the following for a recent year:
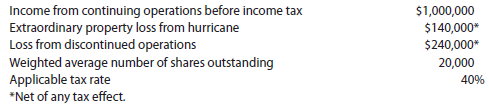
Income from continuing operations before income tax Extraordinary property loss from hurricane Loss from discontinued operations Weighted average number of shares outstanding Applicable tax rate *Net of any tax effect.
a. Prepare a partial income statement for Apex Inc., beginning with income from continuing operations before income tax.
b. Calculate the earnings per common share for Apex Inc., including per-share amounts for unusual items.
Apex Inc. reports the following for a recent year:
Income from continuing operations before income tax Extraordinary property loss from hurricane Loss from discontinued operations Weighted average number of shares outstanding Applicable tax rate *Net of any tax effect.
a. Prepare a partial income statement for Apex Inc., beginning with income from continuing operations before income tax.
b. Calculate the earnings per common share for Apex Inc., including per-share amounts for unusual items.
Question
Question
Solvency and profitability trend analysis
Crosby Company has provided the following comparative information:
You have been asked to evaluate the historical performance of the company over the last five years.
Selected industry ratios have remained relatively steady at the following levels for the last five years:
Instructions
1. Prepare four line graphs with the ratio on the vertical axis and the years on the horizontal axis for the following four ratios (rounded to one decimal place):
a. Rate earned on total assets
b. Rate earned on stockholders' equity
c. Number of times interest charges are earned
d. Ratio of liabilities to stockholders' equity
Display both the company ratio and the industry benchmark on each graph. That is, each graph should have two lines.
2. Prepare an analysis of the graphs in (1).
Question
Inventory analysis
The following data were extracted from the income statement of Saleh Inc.:
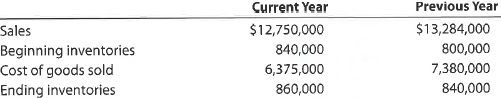
a. Determine for each year (1) the inventory turnover and (2) the number of days' sales in inventory. Round to the nearest dollar and one decimal place.
b. What conclusions can be drawn from these data concerning the inventories
The following data were extracted from the income statement of Saleh Inc.:
a. Determine for each year (1) the inventory turnover and (2) the number of days' sales in inventory. Round to the nearest dollar and one decimal place.
b. What conclusions can be drawn from these data concerning the inventories
Question
Question
Common-sized income statement
Revenue and expense data for the current calendar year for Tannenhill Company and for the electronics industry are as follows. The Tannenhill Company data are expressed in dollars. The electronics industry averages are expressed in percentages.
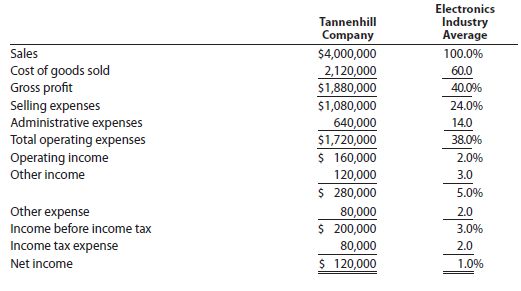
a. Prepare a common-sized income statement comparing the results of operations for Tannenhill Company with the industry average. Round to one decimal place.
b. As far as the data permit, comment on significant relationships revealed by the comparisons.
Revenue and expense data for the current calendar year for Tannenhill Company and for the electronics industry are as follows. The Tannenhill Company data are expressed in dollars. The electronics industry averages are expressed in percentages.
a. Prepare a common-sized income statement comparing the results of operations for Tannenhill Company with the industry average. Round to one decimal place.
b. As far as the data permit, comment on significant relationships revealed by the comparisons.
Question
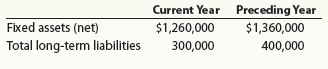
What do the following data taken from a comparative balance sheet indicate about the company's ability to borrow additional funds on a long-term basis in the current year as compared to the preceding year
Question
Earnings per share and price-earnings ratio
A company reports the following:
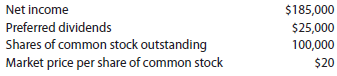
a. Determine the company's earnings per share on common stock.
b. Determine the company's price-earnings ratio.
A company reports the following:
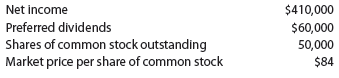
a. Determine the company's earnings per share on common stock.
b. Determine the company's price-earnings ratio.
A company reports the following:
a. Determine the company's earnings per share on common stock.
b. Determine the company's price-earnings ratio.
A company reports the following:
a. Determine the company's earnings per share on common stock.
b. Determine the company's price-earnings ratio.

Unlock Deck
Sign up to unlock the cards in this deck!
Unlock Deck
Unlock Deck
1/63
Play
Full screen (f)
Deck 17: Financial Statement Analysis
1
Analysis of financing corporate growth
Assume that the president of Freeman Industries Inc. made the following statement in the Annual Report to Shareholders:
"The founding family and majority shareholders of the company do not believe in using debt to finance future growth. The founding family learned from hard experience during Prohibition and the Great Depression that debt can cause loss of flexibility and eventual loss of corporate control. The company will not place itself at such risk. As such, all future growth will be financed either by stock sales to the public or by internally generated resources."
As a public shareholder of this company, how would you respond to this policy
The ratio of liabilities to stockholders equity is a measure to determine the amount of debt to equity.
Ratio of liabilities to stockholders equity
=
 The ideal level of debt to equity ratio is 1:2. This is optimum not only for daily operations but this is considered to be the optimum capital structure because debt financing is always cheaper than equity financing. However this capital structure of 1:2, debt to equity does not hold true for all the industries and might vary. Hence optimum capital structures differ from one industry to other.
• There should not be a capital structure with all debt which would result in loss of control by the management of the company.
• There should not be a capital structure with all equity because dilution of control is vested over large number of shareholders resulting in loss of corporate control.
• Hence capitalizing a company with both debt and equity as such the advantages of both equity and debt are availed at the maximum level would give the best results.
• Analyzing different possibilities of debt and equity financing for a given amount of capital at a given time by selecting the best possible alternative would lead to the reduction of the overall cost of capital alone helps in achieving profit and wealth maximization by the firm
As a public share holder of this company with limited amount of shareholding power I will not support the company's decision to finance the entire capital with equity. I would sell out my stock if my stock is even just above the cost of my purchase price plus commission to the trading agency or platform or broker.
As a public share holder of this company with great amount of shareholding power of say 40% or more I will not support the company's decision to finance the entire capital with equity. I will demand the company's management to go for voting system on deciding upon the ways to finance the needed capital either all equity or debt and equity capital structure.
Ratio of liabilities to stockholders equity
=
The ideal level of debt to equity ratio is 1:2. This is optimum not only for daily operations but this is considered to be the optimum capital structure because debt financing is always cheaper than equity financing. However this capital structure of 1:2, debt to equity does not hold true for all the industries and might vary. Hence optimum capital structures differ from one industry to other.• There should not be a capital structure with all debt which would result in loss of control by the management of the company.
• There should not be a capital structure with all equity because dilution of control is vested over large number of shareholders resulting in loss of corporate control.
• Hence capitalizing a company with both debt and equity as such the advantages of both equity and debt are availed at the maximum level would give the best results.
• Analyzing different possibilities of debt and equity financing for a given amount of capital at a given time by selecting the best possible alternative would lead to the reduction of the overall cost of capital alone helps in achieving profit and wealth maximization by the firm
As a public share holder of this company with limited amount of shareholding power I will not support the company's decision to finance the entire capital with equity. I would sell out my stock if my stock is even just above the cost of my purchase price plus commission to the trading agency or platform or broker.
As a public share holder of this company with great amount of shareholding power of say 40% or more I will not support the company's decision to finance the entire capital with equity. I will demand the company's management to go for voting system on deciding upon the ways to finance the needed capital either all equity or debt and equity capital structure.
2
A Current position analysis
The following items are reported on a company's balance sheet:
Determine (a) the current ratio and (b) the quick ratio. Round to one decimal place.
B Current position analysis
The following items are reported on a company's balance sheet:
Determine (a) the current ratio and (b) the quick ratio. Round to one decimal place.
The following items are reported on a company's balance sheet:
Determine (a) the current ratio and (b) the quick ratio. Round to one decimal place.
B Current position analysis
The following items are reported on a company's balance sheet:
Determine (a) the current ratio and (b) the quick ratio. Round to one decimal place.
A. Current position analysis
(a) Current ratio : Current ratio is calculated using the following equation.
Current ratio =
Current assets = Cash + Marketable securities + Accounts receivable + Inventory
= $160,000 + $75,000 + $65,000 + $140,000
= $440,000
Current liabilities = Accounts payable
= $200,000
Current ratio = = 2.2
(b) Quick ratio : Quick ratio is calculated using the following equation.
Quick ratio =
Quick assets = Cash + Marketable securities + Accounts receivable
= $160,000 + $75,000 + $65,000
= $300,000
Current liabilities = Accounts payable
= $200,000
Quick ratio = = 1.5
B. Current position analysis
(a) Current ratio : Current ratio is calculated using the following equation.
Current ratio =
Current assets = Cash + Marketable securities + Accounts receivable + Inventory
= $210,000 + $120,000 + $110,000 + $160,000
= $600,000
Current liabilities = Accounts payable
= $200,000
Current ratio = = 3
(b) Quick ratio : Quick ratio is calculated using the following equation
Quick ratio =
Quick assets = Cash + marketable securities + accounts receivable
= $210,000 + 120,000 + $110,000
= $440,000
Current liabilities = Accounts payable
= $200,000
Quick ratio = = 2.2
(a) Current ratio : Current ratio is calculated using the following equation.
Current ratio =
Current assets = Cash + Marketable securities + Accounts receivable + Inventory
= $160,000 + $75,000 + $65,000 + $140,000
= $440,000
Current liabilities = Accounts payable
= $200,000
Current ratio = = 2.2
(b) Quick ratio : Quick ratio is calculated using the following equation.
Quick ratio =
Quick assets = Cash + Marketable securities + Accounts receivable
= $160,000 + $75,000 + $65,000
= $300,000
Current liabilities = Accounts payable
= $200,000
Quick ratio = = 1.5
B. Current position analysis
(a) Current ratio : Current ratio is calculated using the following equation.
Current ratio =
Current assets = Cash + Marketable securities + Accounts receivable + Inventory
= $210,000 + $120,000 + $110,000 + $160,000
= $600,000
Current liabilities = Accounts payable
= $200,000
Current ratio = = 3
(b) Quick ratio : Quick ratio is calculated using the following equation
Quick ratio =
Quick assets = Cash + marketable securities + accounts receivable
= $210,000 + 120,000 + $110,000
= $440,000
Current liabilities = Accounts payable
= $200,000
Quick ratio = = 2.2
3
Current position analysis
The following data were taken from the balance sheet of Gostkowski Company at the end of two recent fiscal years:
a. Determine for each year (1) the working capital, (2) the current ratio, and (3) the quick ratio. Round ratios to one decimal place.
b. What conclusions can be drawn from these data as to the company's ability to meet its currently maturing debts
a. Current position analysis
(1) Working capital : Working capital is calculated by using the following equation.
Working capital = Current assets - current liabilities
Current assets consist of cash, marketable securities, accounts and notes receivable, inventories and prepaid expenses.
Current liabilities consist of accounts and notes payable and accrued liabilities.
The amount of current assets and current liabilities, as given in the data, are as follows
 Working capital is calculated as follows
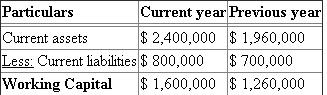 (2) Current ratio : Current ratio is calculated using the following equation.
Current ratio =
The amount of current assets and current liabilities, as given in the data, are as follows
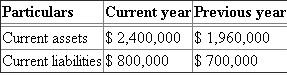 Current year's Current ratio = = 3
Previous year's Current ratio = = 2.8
(3) Quick ratio : Quick ratio is calculated using the following equation.
Quick ratio =
Quick assets consist of cash, marketable securities, and accounts and notes receivable.
Current liabilities consist of accounts and notes payable and accrued liabilities.
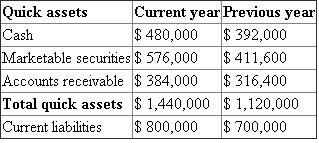 Current year's Quick ratio = = 1.8
Previous year's Quick ratio = = 1.6
b. The company's current ratio and quick ratio will show the ability of meeting its current maturing debts. The current ratio of the company has been increased from 2.8 to 3 during this year, which is a favorable trend. The quick ratio also increases from 1.6 to 1.8 during this year. It means the company is having a good liquidity position and its ability in meeting maturing debts is good.
(1) Working capital : Working capital is calculated by using the following equation.
Working capital = Current assets - current liabilities
Current assets consist of cash, marketable securities, accounts and notes receivable, inventories and prepaid expenses.
Current liabilities consist of accounts and notes payable and accrued liabilities.
The amount of current assets and current liabilities, as given in the data, are as follows
Working capital is calculated as follows (2) Current ratio : Current ratio is calculated using the following equation. Current ratio =
The amount of current assets and current liabilities, as given in the data, are as follows
Current year's Current ratio = = 3 Previous year's Current ratio = = 2.8
(3) Quick ratio : Quick ratio is calculated using the following equation.
Quick ratio =
Quick assets consist of cash, marketable securities, and accounts and notes receivable.
Current liabilities consist of accounts and notes payable and accrued liabilities.
Current year's Quick ratio = = 1.8 Previous year's Quick ratio = = 1.6
b. The company's current ratio and quick ratio will show the ability of meeting its current maturing debts. The current ratio of the company has been increased from 2.8 to 3 during this year, which is a favorable trend. The quick ratio also increases from 1.6 to 1.8 during this year. It means the company is having a good liquidity position and its ability in meeting maturing debts is good.
4
Inventory analysis
Dell Inc. and Hewlett-Packard Company (HP) compete with each other in the personal computer market. Dell's primary strategy is to assemble computers to customer orders, rather than for inventory. Thus, for example, Dell will build and deliver a computer within four days of a customer entering an order on a Web page. Hewlett-Packard, on the other hand, builds some computers prior to receiving an order, then sells from this inventory once an order is received. Selected financial information for both companies from a recent year's financial statements follows (in millions):
a. Determine for both companies (1) the inventory turnover and (2) the number of days' sales in inventory. Round to one decimal place.
b. Interpret the inventory ratios by considering Dell's and Hewlett-Packard's operating strategies.
Unlock Deck
Unlock for access to all 63 flashcards in this deck.
Unlock Deck
k this deck
5
What is the difference between horizontal and vertical analysis of financial statements
Unlock Deck
Unlock for access to all 63 flashcards in this deck.
Unlock Deck
k this deck
6
Effect of transactions on current position analysis
Data pertaining to the current position of Forte Company follow:
Instructions
1. Compute (a) the working capital, (b) the current ratio, and (c) the quick ratio. Round ratios in parts b through j to one decimal place.
2. List the following captions on a sheet of paper:
Compute the working capital, the current ratio, and the quick ratio after each of the following transactions and record the results in the appropriate columns. Consider each transaction separately and assume that only that transaction affects the data given. Round to one decimal place.
a. Sold marketable securities at no gain or loss, $70,000.
b. Paid accounts payable, $125,000.
c. Purchased goods on account, $110,000.
d. Paid notes payable, $100,000.
e. Declared a cash dividend, $150,000.
f. Declared a common stock dividend on common stock, $50,000.
g. Borrowed cash from bank on a long-term note, $225,000.
h. Received cash on account, $125,000.
i. Issued additional shares of stock for cash, $600,000.
j. Paid cash for prepaid expenses, $10,000.
Unlock Deck
Unlock for access to all 63 flashcards in this deck.
Unlock Deck
k this deck
7
Long-term solvency analysis
The following information was taken from Kellman Company's balance sheet:
Determine the company's (a) ratio of fixed assets to long-term liabilities and (b) ratio of liabilities to stockholders' equity.
The following information was taken from Charu Company's balance sheet:
Determine the company's (a) ratio of fixed assets to long-term liabilities and (b) ratio of liabilities to stockholders' equity.
Unlock Deck
Unlock for access to all 63 flashcards in this deck.
Unlock Deck
k this deck
8
Ratio of liabilities to stockholders' equity and number of times interest charges are earned
The following data were taken from the financial statements of Hunter Inc. for December 31 of two recent years:
The income before income tax was $480,000 and $420,000 for the current and previous years, respectively.
a. Determine the ratio of liabilities to stockholders' equity at the end of each year. Round to one decimal place.
b. Determine the number of times the bond interest charges are earned during the year for both years. Round to one decimal place.
c. What conclusions can be drawn from these data as to the company's ability to meet its currently maturing debts
Unlock Deck
Unlock for access to all 63 flashcards in this deck.
Unlock Deck
k this deck
9
Vertical analysis of income statement
Revenue and expense data for Gresham Inc. for two recent years are as follows:
a. Prepare an income statement in comparative form, stating each item for both years as a percent of sales. Round to one decimal place.
b. Comment on the significant changes disclosed by the comparative income statement.
Revenue and expense data for Gresham Inc. for two recent years are as follows:
a. Prepare an income statement in comparative form, stating each item for both years as a percent of sales. Round to one decimal place.
b. Comment on the significant changes disclosed by the comparative income statement.
Unlock Deck
Unlock for access to all 63 flashcards in this deck.
Unlock Deck
k this deck
10
Effect of transactions on current position analysis
Data pertaining to the current position of Lucroy Industries Inc. are as follows:
Instructions
1. Compute (a) the working capital, (b) the current ratio, and (c) the quick ratio. Round to one decimal place.
2. List the following captions on a sheet of paper:
compute the working capital, the current ratio, and the quick ratio after each of the following transactions, andrecord the results in the appropriate columns. Consider each transaction separately and assume that only that transactiom affects the data given. Round to one decimal place.
a. Sold marketable securities at no gain or loss, $500,000.
b. Paid accounts payable, $287,500.
c. Purchased goods on account, $400,000.
d. Paid notes payable, $125,000.
e. Declared a cash dividend, $325,000.
f. Declared a common stock dividend on common stock, $150,000.
g. Borrowed cash from bank on a long-term note, $1,000,000.
h. Received cash on account, $75,000.
i. Issued additional shares of stock for cash, $2,000,000.
j. Paid cash for prepaid expenses, $200,000
Unlock Deck
Unlock for access to all 63 flashcards in this deck.
Unlock Deck
k this deck
11
a. How does the rate earned on total assets differ from the rate earned on stockholders' equity
b. Which ratio is normally higher Explain
b. Which ratio is normally higher Explain
Unlock Deck
Unlock for access to all 63 flashcards in this deck.
Unlock Deck
k this deck
12
Ratio of liabilities to stockholders' equity and number of times interest charges are earned
Hasbro and Mattel, Inc., are the two largest toy companies in North America. Condensed liabilities and stockholders' equity from a recent balance sheet are shown for each company as follows (in thousands):
The income from operations and interest expense from the income statement for each company were as follows (in thousands):
a. Determine the ratio of liabilities to stockholders' equity for both companies. Round to one decimal place.
b. Determine the number of times interest charges are earned for both companies. Round to one decimal place.
c. Interpret the ratio differences between the two companies.
Unlock Deck
Unlock for access to all 63 flashcards in this deck.
Unlock Deck
k this deck
13
Financial Statement Analysis
The financial statements for Nike, Inc., are presented in Appendix C at the end of the text. The following additional information (in thousands) is available:
Instructions
1. Determine the following measures for the fiscal years ended May 31, 2013 (fiscal 2012), and May 31, 2012 (fiscal 2011), rounding to one decimal place.
a. Working capital
b. Current ratio
c. Quick ratio
d. Accounts receivable turnover
e. Number of days' sales in receivables
f. Inventory turnover
g. Number of days' sales in inventory
h. Ratio of liabilities to stockholders' equity
i. Ratio of sales to assets
j. Rate earned on total assets, assuming interest expense is $23 million for the year ending May 31, 2013, and $31 million for the year ending May 31, 2012
k. Rate earned on common stockholders' equity
l. Price-earnings ratio, assuming that the market price was $61.66 per share on May 31, 2013, and $53.10 per share on May 31, 2012
m. Percentage relationship of net income to sales
2. What conclusions can be drawn from these analyses
The financial statements for Nike, Inc., are presented in Appendix C at the end of the text. The following additional information (in thousands) is available:
Instructions
1. Determine the following measures for the fiscal years ended May 31, 2013 (fiscal 2012), and May 31, 2012 (fiscal 2011), rounding to one decimal place.
a. Working capital
b. Current ratio
c. Quick ratio
d. Accounts receivable turnover
e. Number of days' sales in receivables
f. Inventory turnover
g. Number of days' sales in inventory
h. Ratio of liabilities to stockholders' equity
i. Ratio of sales to assets
j. Rate earned on total assets, assuming interest expense is $23 million for the year ending May 31, 2013, and $31 million for the year ending May 31, 2012
k. Rate earned on common stockholders' equity
l. Price-earnings ratio, assuming that the market price was $61.66 per share on May 31, 2013, and $53.10 per share on May 31, 2012
m. Percentage relationship of net income to sales
2. What conclusions can be drawn from these analyses
Unlock Deck
Unlock for access to all 63 flashcards in this deck.
Unlock Deck
k this deck
14
Profitability and stockholder ratios
Deere Co. manufactures and distributes farm and construction machinery that it sells around the world. In addition to its manufacturing operations, Deere Co.'s credit division loans money to customers to finance the purchase of their farm and construction equipment.
The following information is available for three recent years (in millions except per-share amounts):
1. Calculate the following ratios for each year (Round percentages to one decimal place):
a. Rate earned on total assets
b. Rate earned on stockholders' equity
c. Earnings per share
d. Dividend yield
e. Price-earnings ratio
2. What is the ratio of average liabilities to average stockholders' equity for Year 3
3. Based on these data, evaluate Deere Co.'s performance
Unlock Deck
Unlock for access to all 63 flashcards in this deck.
Unlock Deck
k this deck
15
Current position analysis
PepsiCo, Inc. , the parent company of Frito-Lay snack foods and Pepsi beverages, had the following current assets and current liabilities at the end of two recent years:
a. Determine the (1) current ratio and (2) quick ratio for both years. Round to one decimal place.
b. What conclusions can you draw from these data
Unlock Deck
Unlock for access to all 63 flashcards in this deck.
Unlock Deck
k this deck
16
Ratio of liabilities to stockholders' equity and ratio of fixed assets to long-term liabilities
Recent balance sheet information for two companies in the food industry, Mondelez International, Inc., and The Hershey Company, is as follows (in thousands of dollars):
a. Determine the ratio of liabilities to stockholders' equity for both companies. Round to one decimal place.
b. Determine the ratio of fixed assets to long-term liabilities for both companies. Round to one decimal place.
c. Interpret the ratio differences between the two companies.
Unlock Deck
Unlock for access to all 63 flashcards in this deck.
Unlock Deck
k this deck
17
A Horizontal analysis
The comparative temporary investments and inventory balances of a company follow.
Based on this information, what is the amount and percentage of increase or decrease that would be shown in a balance sheet with horizontal analysis
B Horizontal analysis
The comparative accounts payable and long-term debt balances for a company follow.
Based on this information, what is the amount and percentage of increase or decrease that would be shown in a balance sheet with horizontal analysis
Unlock Deck
Unlock for access to all 63 flashcards in this deck.
Unlock Deck
k this deck
18
How would the current and quick ratios of a service business compare
Unlock Deck
Unlock for access to all 63 flashcards in this deck.
Unlock Deck
k this deck
19
Times interest charges are earned
A company reports the following:
Determine the number of times interest charges are earned.
A company reports the following:
Determine the number of times interest charges are earned.
A company reports the following:
Determine the number of times interest charges are earned.
A company reports the following:
Determine the number of times interest charges are earned.
Unlock Deck
Unlock for access to all 63 flashcards in this deck.
Unlock Deck
k this deck
20
Ratio of sales to assets
Three major segments of the transportation industry are motor carriers, such as YRC Worldwide; railroads, such as Union Pacific; and transportation arrangement services, such as C.H. Robinson Worldwide Inc. Recent financial statement information for these three companies is shown as follows (in thousands of dollars):
a. Determine the ratio of sales to assets for all three companies. Round to one decimal place.
b. Assume that the ratio of sales to assets for each company represents their respective industry segment. Interpret the differences in the ratio of sales to assets in terms of the operating characteristics of each of the respective segments.
Unlock Deck
Unlock for access to all 63 flashcards in this deck.
Unlock Deck
k this deck
21
Horizontal analysis of income statement
For 2016, Clapton Company reported a decline in net income. At the end of the year, S. Hand, the president, is presented with the following condensed comparative income statement:
Instructions
1. Prepare a comparative income statement with horizontal analysis for the two-year period, using 2015 as the base year. Round to one decimal place.
2. To the extent the data permit, comment on the significant relationships revealed by the horizontal analysis prepared in (1).
Unlock Deck
Unlock for access to all 63 flashcards in this deck.
Unlock Deck
k this deck
22
Vertical analysis of balance sheet
Balance sheet data for Novak Company on December 31, the end of two recent fiscal years, follows:
Prepare a comparative balance sheet for both years, stating each asset as a percent of total assets and each liability and stockholders' equity item as a percent of the total liabilities and stockholders' equity. Round to one decimal place.
Unlock Deck
Unlock for access to all 63 flashcards in this deck.
Unlock Deck
k this deck
23
Kroger, a grocery store, recendy had a price- earnings ratio of 13.7, while the average price-earnings ratio in the grocery store industry was 22.5. What might explain this difference
Unlock Deck
Unlock for access to all 63 flashcards in this deck.
Unlock Deck
k this deck
24
Profitability ratios
The following selected data were taken from the financial statements of Robinson Inc. for December 31, 2016, 2015 and 2014:
The 2016 net income was $372,000, and the 2015 net income was $492,000. No dividends on common stock were declared between 2014 and 2016.
a. Determine the rate earned on total assets, the rate earned on stockholders' equity, and the rate earned on common stockholders' equity for the years 2015 and 2016. Round to one decimal place.
b. What conclusions can be drawn from these data as to the company's profitability
Unlock Deck
Unlock for access to all 63 flashcards in this deck.
Unlock Deck
k this deck
25
Horizontal analysis of income statement
For 2016, Macklin Inc. reported a significant increase in net income. At the end of the year, John Mayer, the president, is presented with the following condensed comparative income statement:
Instructions
1. Prepare a comparative income statement with horizontal analysis for the two-year period, using 2015 as the base year. Round to one decimal place.
2. To the extent the data permit, comment on the significant relationships revealed by the horizontal analysis prepared in (1).
Unlock Deck
Unlock for access to all 63 flashcards in this deck.
Unlock Deck
k this deck
26
A Accounts receivable analysis
A company reports the following:
Determine (a) the accounts receivable turnover and (b) the number of days' sales in receivables. Round to one decimal place.
B Accounts receivable analysis
A company reports the following:
Determine (a) the accounts receivable turnover and (b) the number of days' sales in receivables. Round to one decimal place.
A company reports the following:
Determine (a) the accounts receivable turnover and (b) the number of days' sales in receivables. Round to one decimal place.
B Accounts receivable analysis
A company reports the following:
Determine (a) the accounts receivable turnover and (b) the number of days' sales in receivables. Round to one decimal place.
Unlock Deck
Unlock for access to all 63 flashcards in this deck.
Unlock Deck
k this deck
27
Current position analysis
The bond indenture for the 10-year, 9% debenture bonds issued January 2, 2015, required working capital of $100,000, a current ratio of 1.5, and a quick ratio of 1.0 at the end of each calendar year until the bonds mature. At December 31, 2016, the three measures were computed as follows:
a. List the errors in the determination of the three measures of current position analysis.
b. Is the company satisfying the terms of the bond indenture
Unlock Deck
Unlock for access to all 63 flashcards in this deck.
Unlock Deck
k this deck
28
Profitability ratios
Ralph Lauren Corp. sells men's apparel through company-owned retail stores. Recent financial information for Ralph Lauren follows (all numbers in thousands):
Assume the apparel industry average rate earned on total assets is 8.0%, and the average rate earned on stockholders' equity is 10.0% for the year ended April 2, Year 3.
a. Determine the rate earned on total assets for Ralph Lauren for fiscal Years 2 and 3. Round to one digit after the decimal place.
b. Determine the rate earned on stockholders' equity for Ralph Lauren for fiscal Years 2 and 3. Round to one decimal place.
c. Evaluate the two-year trend for the profitability ratios determined in (a) and (b).
d. Evaluate Ralph Lauren's profit performance relative to the industry.
Unlock Deck
Unlock for access to all 63 flashcards in this deck.
Unlock Deck
k this deck
29
Receivables and inventory turnover
Rodgers Industries Inc. has completed its fiscal year on December 31. The auditor, Josh McCoy, has approached the CFO, Aaron Mathews, regarding the year-end receivables and inventory levels of Rodgers Industries. The following conversation takes place:
Josh: We are beginning our audit of Rodgers Industries and have prepared ratio analyses to determine if there have been significant changes in operations or financial position. This helps us guide the audit process. This analysis indicates that the inventory turnover has decreased from 5.1 to 2.7, while the accounts receivable turnover has decreased from 11 to 7. Could you explain this change in operations
Aaron : There is little need for concern. The inventory represents computers that we were unable to sell during the holiday buying season. We are confident, however, that we will be able to sell these computers as we move into the next fiscal year.
Josh: What gives you this confidence
Aaron: We will increase our advertising and provide some very attractive price concessions to move these machines. We have no choice. Newer technology is already out there, and we have to unload this inventory.
Josh:... and the receivables
Aaron: As you may be aware, the company is under tremendous pressure to expand sales and profits. As a result, we lowered our credit standards to our commercial customers so that we would be able to sell products to a broader customer base. As a result of this policy change, we have been able to expand sales by 35%.
Josh: Your responses have not been reassuring to me.
Aaron: I'm a little confused. Assets are good, right Why don't you look at our current ratio It has improved, hasn't it I would think that you would view that very favorably.
Why is Josh concerned about the inventory and accounts receivable turnover ratios and Aaron's responses to them What action may Josh need to take How would you respond to Aaron's last comment
Unlock Deck
Unlock for access to all 63 flashcards in this deck.
Unlock Deck
k this deck
30
Nineteen measures of solvency and profitability
The comparative financial statements of Bettancort Inc. are as follows. The market price of Bettancort Inc. common stock was $71.25 on December 31, 2016.
Instructions
Determine the following measures for 2016, rounding to one decimal place:
1. Working capital
2. Current ratio
3. Quick ratio
4. Accounts receivable turnover
5. Number of days' sales in receivables
6. Inventory turnover
7. Number of days' sales in inventory
8. Ratio of fixed assets to long-term liabilities
9. Ratio of liabilities to stockholders' equity
10. Number of times interest charges are earned
11. Number of times preferred dividends are earned
12. Ratio of sales to assets
13. Rate earned on total assets
14. Rate earned on stockholders' equity
15. Rate earned on common stockholders' equity
16. Earnings per share on common stock
17. Price-earnings ratio
18. Dividends per share of common stock
19. Dividend yield
Unlock Deck
Unlock for access to all 63 flashcards in this deck.
Unlock Deck
k this deck
31
Sales to assets
A company reports the following:
Determine the ratio of sales to assets.
A company reports the following:
Determine the ratio of sales to assets.
A company reports the following:
Determine the ratio of sales to assets.
A company reports the following:
Determine the ratio of sales to assets.
Unlock Deck
Unlock for access to all 63 flashcards in this deck.
Unlock Deck
k this deck
32
Six measures of solvency or profitability
The following data were taken from the financial statements of Gates Inc. for the current fiscal year. Assuming that long-term investments totaled $3,000,000 throughout the year and that total assets were $7,000,000 at the beginning of the current fiscal year, determine the following: (a) ratio of fixed assets to long-term liabilities, (b) ratio of liabilities to stockholders' equity, (c) ratio of sales to assets, (d) rate earned on total assets, (e) rate earned on stockholders' equity, and (f) rate earned on common stockholders' equity. Round to one decimal place.
The following data were taken from the financial statements of Gates Inc. for the current fiscal year. Assuming that long-term investments totaled $3,000,000 throughout the year and that total assets were $7,000,000 at the beginning of the current fiscal year, determine the following: (a) ratio of fixed assets to long-term liabilities, (b) ratio of liabilities to stockholders' equity, (c) ratio of sales to assets, (d) rate earned on total assets, (e) rate earned on stockholders' equity, and (f) rate earned on common stockholders' equity. Round to one decimal place.
Unlock Deck
Unlock for access to all 63 flashcards in this deck.
Unlock Deck
k this deck
33
What is the advantage of using comparative statements for financial analysis rather than statements for a single date or period
Unlock Deck
Unlock for access to all 63 flashcards in this deck.
Unlock Deck
k this deck
34
Nineteen measures of solvency and profitability
The comparative financial statements of Stargel Inc. are as follows. The market price of Stargel Inc. common stock was $119.70 on December 31, 2016.
Instructions
Determine the following measures for 2016, rounding to one decimal place, except per-share amounts, which should be rounded to the nearest penny:
1. Working capital
2. Current ratio
3. Quick ratio
4. Accounts receivable turnover
5. Number of days' sales in receivables
6. Inventory turnover
7. Number of days' sales in inventory
8. Ratio of fixed assets to long-term liabilities
9. Ratio of liabilities to stockholders' equity
10. Number of times interest charges are earned
11. Number of times preferred dividends are earned
12. Ratio of sales to assets
13. Rate earned on total assets
14. Rate earned on stockholders' equity
15. Rate earned on common stockholders' equity
16. Earnings per share on common stock
17. Price-earnings ratio
18. Dividends per share of common stock
19. Dividend yield
Unlock Deck
Unlock for access to all 63 flashcards in this deck.
Unlock Deck
k this deck
35
The dividend yield of Suburban Propane was 7.7% in a recent year, and the dividend yield of Google was 0% in the same year. What might explain the difference between these ratios
Unlock Deck
Unlock for access to all 63 flashcards in this deck.
Unlock Deck
k this deck
36
Six measures of solvency or profitability
The balance sheet for Garcon Inc. at the end of the current fiscal year indicated the following:
Income before income tax was $3,000,000, and income taxes were $1,200,000 for the current year. Cash dividends paid on common stock during the current year totaled $1,200,000. The common stock was selling for $32 per share at the end of the year. Determine each of the following: (a) number of times bond interest charges are earned, (b) number of times preferred dividends are earned, (c) earnings per share on common stock, (d) price-earnings ratio, (e) dividends per share of common stock, and (f) dividend yield. Round to one decimal place, except earnings per share, which should be rounded to two decimal places.
Unlock Deck
Unlock for access to all 63 flashcards in this deck.
Unlock Deck
k this deck
37
Vertical analysis of income statement
The following comparative income statement (in thousands of dollars) for the two recent fiscal years was adapted from the annual report of Speedway Motorsports, Inc., owner and operator of several major motor speedways, such as the Atlanta, Texas, and Las Vegas Motor Speedways.
a. Prepare a comparative income statement for these two years in vertical form, stating each item as a percent of revenues. Round to one decimal place.
b. Comment on the significant changes.
Unlock Deck
Unlock for access to all 63 flashcards in this deck.
Unlock Deck
k this deck
38
Comprehensive profitability and solvency analysis
Marriott International, Inc. , and Hyatt Hotels Corporation are two major owners and managers of lodging and resort properties in the United States. Abstracted income statement information for the two companies is as follows for a recent year:
Balance sheet information is as follows:
The average liabilities, average stockholders' equity, and average total assets were as follows:
1. Determine the following ratios for both companies (round to one decimal place after the whole percent):
a. Rate earned on total assets
b. Rate earned on stockholders' equity
c. Number of times interest charges are earned
d. Ratio of liabilities to stockholders' equity
2. Analyze and compare the two companies, using the information in (1)
Unlock Deck
Unlock for access to all 63 flashcards in this deck.
Unlock Deck
k this deck
39
Accounts receivable analysis
The following data are taken from the financial statements of Krawcheck Inc. Terms of all sales are 2/10, n/55.
a. For 2015 and 2016, determine (1) the accounts receivable turnover and (2) the number of days' sales in receivables. Round to the nearest dollar and one decimal place.
b. What conclusions can be drawn from these data concerning accounts receivable and credit policies
Unlock Deck
Unlock for access to all 63 flashcards in this deck.
Unlock Deck
k this deck
40
Earnings per share, price-earnings ratio, dividend yield
The following information was taken from the financial statements of Tolbert Inc. for December 31 of the current fiscal year:
The net income was $1,750,000, and the declared dividends on the common stock were $1,125,000 for the current year. The market price of the common stock is $45 per share.
For the common stock, determine (a) the earnings per share, (b) the price-earnings ratio, (c) the dividends per share, and (d) the dividend yield. Round ratios and percentages to one decimal place, except for per-share amounts.
Unlock Deck
Unlock for access to all 63 flashcards in this deck.
Unlock Deck
k this deck
41
A Vertical analysis
Income statement information for Axiom Corporation follows:
Prepare a vertical analysis of the income statement for Axiom Corporation.
B Vertical analysis
Income statement information for Einsworth Corporation follows:
Prepare a vertical analysis of the income statement for Einsworth Corporation.
Income statement information for Axiom Corporation follows:
Prepare a vertical analysis of the income statement for Axiom Corporation.
B Vertical analysis
Income statement information for Einsworth Corporation follows:
Prepare a vertical analysis of the income statement for Einsworth Corporation.
Unlock Deck
Unlock for access to all 63 flashcards in this deck.
Unlock Deck
k this deck
42
a. Why is it advantageous to have a high inventory turnover
b. Is it possible to have a high inventory turnover and a high number of days' sales in inventory Discuss.
b. Is it possible to have a high inventory turnover and a high number of days' sales in inventory Discuss.
Unlock Deck
Unlock for access to all 63 flashcards in this deck.
Unlock Deck
k this deck
43
Rate earned on total assets
A company reports the following income statement and balance sheet information for the current year:
Determine the rate earned on total assets.
A company reports the following income statement and balance sheet information for the current year:
Determine the rate earned on total assets.
A company reports the following income statement and balance sheet information for the current year:
Determine the rate earned on total assets.
A company reports the following income statement and balance sheet information for the current year:
Determine the rate earned on total assets.
Unlock Deck
Unlock for access to all 63 flashcards in this deck.
Unlock Deck
k this deck
44
Price-earnings ratio; dividend yield
The table that follows shows the stock price, earnings per share, and dividends per share for three companies for a recent year:
a. Determine the price-earnings ratio and dividend yield for the three companies. Round to one decimal place.
b. Explain the differences in these ratios across the three companies.
Unlock Deck
Unlock for access to all 63 flashcards in this deck.
Unlock Deck
k this deck
45
Vertical analysis of income statement
For 2016, Indigo Company initiated a sales promotion campaign that included the expenditure of an additional $39,000 for advertising. At the end of the year, Lumi Neer, the president, is presented with the following condensed comparative income statement:
Instructions
1. Prepare a comparative income statement for the two-year period, presenting an analysis of each item in relationship to sales for each of the years. Round to one decimal place.
2. To the extent the data permit, comment on the significant relationships revealed by the vertical analysis prepared in (1).
Unlock Deck
Unlock for access to all 63 flashcards in this deck.
Unlock Deck
k this deck
46
Horizontal analysis of the income statement
Income statement data for Moreno Company for two recent years ended December 31, are as follows:
a. Prepare a comparative income statement with horizontal analysis, indicating the increase (decrease) for the current year when compared with the previous year. Round to one decimal place.
b. What conclusions can be drawn from the horizontal analysis
Unlock Deck
Unlock for access to all 63 flashcards in this deck.
Unlock Deck
k this deck
47
Describe two reports provided by independent auditors in the annual report to shareholders.
Unlock Deck
Unlock for access to all 63 flashcards in this deck.
Unlock Deck
k this deck
48
Earnings per share, extraordinary item
The net income reported on the income statement of Cutler Co. was $4,000,000. There were 500,000 shares of $10 par common stock and 100,000 shares of $2 preferred stock outstanding throughout the current year. The income statement included two extraordinary items: an $800,000 gain from condemnation of land and a $400,000 loss arising from flood damage, both after applicable income tax. Determine the per-share figures for common stock for (a) income before extraordinary items and (b) net income.
The net income reported on the income statement of Cutler Co. was $4,000,000. There were 500,000 shares of $10 par common stock and 100,000 shares of $2 preferred stock outstanding throughout the current year. The income statement included two extraordinary items: an $800,000 gain from condemnation of land and a $400,000 loss arising from flood damage, both after applicable income tax. Determine the per-share figures for common stock for (a) income before extraordinary items and (b) net income.
Unlock Deck
Unlock for access to all 63 flashcards in this deck.
Unlock Deck
k this deck
49
Vertical analysis of income statement
For 2016, Fielder Industries Inc. initiated a sales promotion campaign that included the expenditure of an additional $40,000 for advertising. At the end of the year, Leif Grando, the president, is presented with the following condensed comparative income statement:
Instructions
1. Prepare a comparative income statement for the two-year period, presenting an analysis of each item in relationship to sales for each of the years. Round to one decimal place.
2. To the extent the data permit, comment on the significant relationships revealed by the vertical analysis prepared in (1).
Unlock Deck
Unlock for access to all 63 flashcards in this deck.
Unlock Deck
k this deck
50
A Inventory analysis
A company reports the following:
Determine (a) the inventory turnover and (b) the number of days' sales in inventoiy Round to one decimal place.
B Inventory analysis
A company reports the following:
Determine (a) the inventory turnover and (b) the number of days' sales in inventoiy. Round to one decimal place.
A company reports the following:
Determine (a) the inventory turnover and (b) the number of days' sales in inventoiy Round to one decimal place.
B Inventory analysis
A company reports the following:
Determine (a) the inventory turnover and (b) the number of days' sales in inventoiy. Round to one decimal place.
Unlock Deck
Unlock for access to all 63 flashcards in this deck.
Unlock Deck
k this deck
51
Accounts receivable analysis
Xavier Stores Company and Lestrade Stores Inc. are large retail department stores. Both companies offer credit to their customers through their own credit card operations. Information from the financial statements for both companies for two recent years is as follows (all numbers are in millions):
a. Determine the (1) accounts receivable turnover and (2) the number of days' sales in receivables for both companies. Round to one decimal place.
b. Compare the two companies with regard to their credit card policies.
Unlock Deck
Unlock for access to all 63 flashcards in this deck.
Unlock Deck
k this deck
52
Extraordinary item
Assume that the amount of each of the following items is material to the financial statements. Classify each item as either normally recurring (NR) or extraordinary (E).
a. Loss on the disposal of equipment considered to be obsolete because of the development of new technology.
b. Uninsured loss on building due to hurricane damage. The building was purchased by the company in 1910 and had not previously incurred hurricane damage.
c. Gain on sale of land condemned by the local government for a public works project.
d. Uninsured flood loss. (Flood insurance is unavailable because of periodic flooding in the area.)
e. Interest revenue on notes receivable.
f. Uncollectible accounts expense.
g. Loss on sale of investments in stocks and bonds.
Unlock Deck
Unlock for access to all 63 flashcards in this deck.
Unlock Deck
k this deck
53
Vertical analysis
The condensed income statements through income from operations for Dell Inc. and Apple Inc. for recent fiscal years follow (numbers in millions of dollars):
Prepare comparative common-sized statements, rounding percents to one decimal place. Interpret the analyses.
The condensed income statements through income from operations for Dell Inc. and Apple Inc. for recent fiscal years follow (numbers in millions of dollars):
Prepare comparative common-sized statements, rounding percents to one decimal place. Interpret the analyses.
Unlock Deck
Unlock for access to all 63 flashcards in this deck.
Unlock Deck
k this deck
54
Solvency and profitability trend analysis
Addai Company has provided the following comparative information:
You have been asked to evaluate the historical performance of the company over the last five years.
Selected industry ratios have remained relatively steady at the following levels for the last five years:
Instructions
1. Prepare four line graphs with the ratio on the vertical axis and the years on the horizontal axis for the following four ratios (rounded to one decimal place):
a. Rate earned on total assets
b. Rate earned on stockholders' equity
c. Number of times interest charges are earned
d. Ratio of liabilities to stockholders' equity
Display both the company ratio and the industry benchmark on each graph. That is, each graph should have two lines.
2. Prepare an analysis of the graphs in (1).
Unlock Deck
Unlock for access to all 63 flashcards in this deck.
Unlock Deck
k this deck
55
Common stockholders' profitability analysis
A company reports the following:
Determine (a) the rate earned on stockholders' equity and (b) the rate earned on common stockholders' equity. Round to one decimal place.
A company reports the following:
Determine (a) the rate earned on stockholders' equity and (b) the rate earned on common stockholders' equity. Round to one decimal place.
A company reports the following:
Determine (a) the rate earned on stockholders' equity and (b) the rate earned on common stockholders' equity. Round to one decimal place.
A company reports the following:
Determine (a) the rate earned on stockholders' equity and (b) the rate earned on common stockholders' equity. Round to one decimal place.
Unlock Deck
Unlock for access to all 63 flashcards in this deck.
Unlock Deck
k this deck
56
Income statement and earnings per share for extraordinary items and discontinued operations
Apex Inc. reports the following for a recent year:
Income from continuing operations before income tax Extraordinary property loss from hurricane Loss from discontinued operations Weighted average number of shares outstanding Applicable tax rate *Net of any tax effect.
a. Prepare a partial income statement for Apex Inc., beginning with income from continuing operations before income tax.
b. Calculate the earnings per common share for Apex Inc., including per-share amounts for unusual items.
Unlock Deck
Unlock for access to all 63 flashcards in this deck.
Unlock Deck
k this deck
57
The current year's amount of net income (after income tax) is 25% larger than that of the preceding year. Does this indicate an improved operating performance Discuss
Unlock Deck
Unlock for access to all 63 flashcards in this deck.
Unlock Deck
k this deck
58
Solvency and profitability trend analysis
Crosby Company has provided the following comparative information:
You have been asked to evaluate the historical performance of the company over the last five years.
Selected industry ratios have remained relatively steady at the following levels for the last five years:
Instructions
1. Prepare four line graphs with the ratio on the vertical axis and the years on the horizontal axis for the following four ratios (rounded to one decimal place):
a. Rate earned on total assets
b. Rate earned on stockholders' equity
c. Number of times interest charges are earned
d. Ratio of liabilities to stockholders' equity
Display both the company ratio and the industry benchmark on each graph. That is, each graph should have two lines.
2. Prepare an analysis of the graphs in (1).
Unlock Deck
Unlock for access to all 63 flashcards in this deck.
Unlock Deck
k this deck
59
Inventory analysis
The following data were extracted from the income statement of Saleh Inc.:
a. Determine for each year (1) the inventory turnover and (2) the number of days' sales in inventory. Round to the nearest dollar and one decimal place.
b. What conclusions can be drawn from these data concerning the inventories
Unlock Deck
Unlock for access to all 63 flashcards in this deck.
Unlock Deck
k this deck
60
Unusual items
Discuss whether Colston Company correctly reported the following items in the financial statements:
a. In a recent year, the company discovered a clerical error in the prior year's accounting records. As a result, the reported net income for the previous year was overstated by $45,000. The company corrected this error by restating the prior-year financial statements.
b. In a recent year, the company voluntarily changed its method of accounting for longterm construction contracts from the percentage of completion method to the completed contract method. Both methods are acceptable under generally acceptable accounting principles. The cumulative effect of this change was reported as a separate component of income in the current period income statement.
Unlock Deck
Unlock for access to all 63 flashcards in this deck.
Unlock Deck
k this deck
61
Common-sized income statement
Revenue and expense data for the current calendar year for Tannenhill Company and for the electronics industry are as follows. The Tannenhill Company data are expressed in dollars. The electronics industry averages are expressed in percentages.
a. Prepare a common-sized income statement comparing the results of operations for Tannenhill Company with the industry average. Round to one decimal place.
b. As far as the data permit, comment on significant relationships revealed by the comparisons.
Unlock Deck
Unlock for access to all 63 flashcards in this deck.
Unlock Deck
k this deck
62
What do the following data taken from a comparative balance sheet indicate about the company's ability to borrow additional funds on a long-term basis in the current year as compared to the preceding year
Unlock Deck
Unlock for access to all 63 flashcards in this deck.
Unlock Deck
k this deck
63
Earnings per share and price-earnings ratio
A company reports the following:
a. Determine the company's earnings per share on common stock.
b. Determine the company's price-earnings ratio.
A company reports the following:
a. Determine the company's earnings per share on common stock.
b. Determine the company's price-earnings ratio.
A company reports the following:
a. Determine the company's earnings per share on common stock.
b. Determine the company's price-earnings ratio.
A company reports the following:
a. Determine the company's earnings per share on common stock.
b. Determine the company's price-earnings ratio.
Unlock Deck
Unlock for access to all 63 flashcards in this deck.
Unlock Deck
k this deck
Unlock Deck
Unlock for access to all 63 flashcards in this deck.


