Deck 11: Basic Regression Analysis
Full screen (f)
Question
Question
Question
Question
Question
Question
Question
Question
Question
Question
Question
Question
Question
Question
Question
Question
Question
Question
Question
Question
Question
Question
Question
Question
Question
Question
Question
Question
Question
Question
Question
Question
Question
Question
Question
Question
Question
Question
Question
Question
Question
The following data have been collected for a simple linear regression analysis:  In applying the least squares criterion, the slope (b) and the intercept (a) for the best-fitting line are b = 1.4 and a = .2.Compute the value of r2 here.
A).65
B).23
C).58
D).36
E).70
In applying the least squares criterion, the slope (b) and the intercept (a) for the best-fitting line are b = 1.4 and a = .2.Compute the value of r2 here.A).65
B).23
C).58
D).36
E).70
Question
You are attempting to link responses to a job announcement (y) to the number of days the announcement was repeated (x):  The slope term (b) in the estimated regression equation was 1.0.The intercept term (a) was 3.5.Show the 99% confidence interval estimate of the expected number of responses when the number of days the announcement is repeated is 11 and report the upper bound for the interval.
A)15.62
B)18.90
C)20.35
D)26.43
E)22.29
The slope term (b) in the estimated regression equation was 1.0.The intercept term (a) was 3.5.Show the 99% confidence interval estimate of the expected number of responses when the number of days the announcement is repeated is 11 and report the upper bound for the interval.A)15.62
B)18.90
C)20.35
D)26.43
E)22.29
Question
The following data are available for a simple linear regression analysis attempting to link hours of training (x) to hourly output (y). 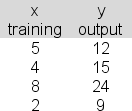 In applying the least squares criterion, the slope (b) and the intercept (a) for the best-fitting line are b = 2.4 and a = 3.6.Produce the 90% confidence interval estimate of the population slope, β.Report the upper bound for your interval.
A)6.86
B)8.29
C)4.42
D)5.71
E)3.90
In applying the least squares criterion, the slope (b) and the intercept (a) for the best-fitting line are b = 2.4 and a = 3.6.Produce the 90% confidence interval estimate of the population slope, β.Report the upper bound for your interval.A)6.86
B)8.29
C)4.42
D)5.71
E)3.90
Question
In a simple linear regression analysis attempting to link lottery sales (y) to jackpot amount (x), the following data are available:  The slope term (b) of the estimated regression equation turns out to be 3.5.The intercept term (a) turns out to be 20.Show the 95% prediction interval for sales for an individual case in which the jackpot is $9 (million).Show the upper bound for the interval.
A)55.6
B)78.2
C)62.4
D)73.7
E)81.1
The slope term (b) of the estimated regression equation turns out to be 3.5.The intercept term (a) turns out to be 20.Show the 95% prediction interval for sales for an individual case in which the jackpot is $9 (million).Show the upper bound for the interval.A)55.6
B)78.2
C)62.4
D)73.7
E)81.1
Question
The following data have been collected for a simple linear regression analysis relating sales (y) to price (x): 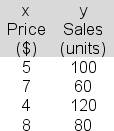 In applying the least squares criterion, the slope (b) and the intercept (a) for the best-fitting line are b = -12 and a = 162.Compute the value of r2 here.
A).66
B).72
C).54
D).77
E).81
In applying the least squares criterion, the slope (b) and the intercept (a) for the best-fitting line are b = -12 and a = 162.Compute the value of r2 here.A).66
B).72
C).54
D).77
E).81
Question
The following data are available for a simple linear regression analysis attempting to link hours of training (x) to hourly output (y).  In applying the least squares criterion, the slope (b) and the intercept (a) for the best-fitting line are b = 2.4 and a = 3.6.You are to set up a hypothesis test to determine whether you can reject the hypothesis that the population slope, β, is 0 at the 5% significance level.Report the value of the appropriate sample test statistic, tstat.
A)3.46
B)2.12
C)1.87
D)2.4
E)4.42
In applying the least squares criterion, the slope (b) and the intercept (a) for the best-fitting line are b = 2.4 and a = 3.6.You are to set up a hypothesis test to determine whether you can reject the hypothesis that the population slope, β, is 0 at the 5% significance level.Report the value of the appropriate sample test statistic, tstat.A)3.46
B)2.12
C)1.87
D)2.4
E)4.42
Question
In a simple linear regression analysis attempting to relate sales (y) to price (x), the following data are available: 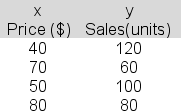 The least squares line would predict a y value of _______ for an x value of 60.
A)90
B)80
C)75
D)71
E)84
The least squares line would predict a y value of _______ for an x value of 60.A)90
B)80
C)75
D)71
E)84
Question
The following data have been collected for a simple linear regression analysis.  The least squares line would predict a y value of _______ for an x value of 15.
A)16.2
B)21.4
C)20.9
D)19.3
E)18.1
The least squares line would predict a y value of _______ for an x value of 15.A)16.2
B)21.4
C)20.9
D)19.3
E)18.1
Question
The following data are available for a simple linear regression analysis attempting to link hours of training (x) to hourly output (y). 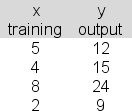 In applying the least squares criterion, the slope (b) and the intercept (a) for the best-fitting line are b = 2.4 and a = 3.6.Set up a hypothesis test to determine whether you can reject the hypothesis that the population slope, β, is 0 at the 5% significance level.Compute the value of the appropriate sample test statistic, tstat, and use it to reach the proper conclusion.
A)Since tstat is outside the critical values of ±3.213, we can reject the β=0 null hypothesis.
B)Since tstat is between the critical values of ±3.213, we can't reject the β=0 null hypothesis.
C)Since tstat is outside the critical values of ±4.403, we can reject the β=0 null hypothesis.
D)Since tstat is between the critical values of ±4.403, we can't reject the β=0 null hypothesis.
In applying the least squares criterion, the slope (b) and the intercept (a) for the best-fitting line are b = 2.4 and a = 3.6.Set up a hypothesis test to determine whether you can reject the hypothesis that the population slope, β, is 0 at the 5% significance level.Compute the value of the appropriate sample test statistic, tstat, and use it to reach the proper conclusion.A)Since tstat is outside the critical values of ±3.213, we can reject the β=0 null hypothesis.
B)Since tstat is between the critical values of ±3.213, we can't reject the β=0 null hypothesis.
C)Since tstat is outside the critical values of ±4.403, we can reject the β=0 null hypothesis.
D)Since tstat is between the critical values of ±4.403, we can't reject the β=0 null hypothesis.
Question
You are attempting to link responses to a job announcement (y) to the number of days the announcement was repeated (x): 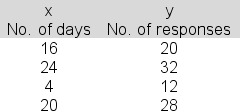 The estimated regression equation is y = 7 + 1.0x.Compute the standard error of estimate.
A)4.61
B)2.45
C)3.67
D)5.49
E)1.27
The estimated regression equation is y = 7 + 1.0x.Compute the standard error of estimate.A)4.61
B)2.45
C)3.67
D)5.49
E)1.27
Question
You are using linear regression to link number of responses to a job announcement (y) to the number of days the announcement was repeated (x): 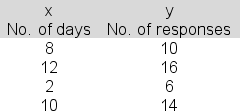 In applying the least squares criterion, the slope (b) and the intercept (a) for the best-fitting line are b = 1.0 and a = 3.5.Produce the 95% confidence interval estimate of the population intercept and report the upper bound for your interval.
A)4.5
B)9.7
C)8.3
D)6.1
E)7.2
In applying the least squares criterion, the slope (b) and the intercept (a) for the best-fitting line are b = 1.0 and a = 3.5.Produce the 95% confidence interval estimate of the population intercept and report the upper bound for your interval.A)4.5
B)9.7
C)8.3
D)6.1
E)7.2
Question
You are attempting to link weekly hours of exercise (x) to blood pressure (y) using simple linear regression and the following data:  In applying the least squares criterion, the slope (b) and the intercept (a) for the best-fitting line are b = -4 and a = 90.Produce the 95% confidence interval estimate of expected blood pressure when weekly exercise is 5 hours (that is, for x = 5) and report the upper bound for the interval.
A)85.6
B)70.0
C)111.8
D)93.2
E)78.3
In applying the least squares criterion, the slope (b) and the intercept (a) for the best-fitting line are b = -4 and a = 90.Produce the 95% confidence interval estimate of expected blood pressure when weekly exercise is 5 hours (that is, for x = 5) and report the upper bound for the interval.A)85.6
B)70.0
C)111.8
D)93.2
E)78.3
Question
In a simple linear regression analysis attempting to link lottery sales (y) to jackpot amount (x), the following data are available: 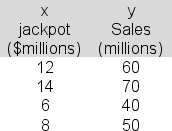 The slope (b) of the estimated regression equation here is 3.5.The intercept (a) is 20.Produce the 95% confidence interval estimate of the population slope, β, and report the upper bound for the interval.
A)5.02
B)4.66
C)7.23
D)3.72
E)8.05
The slope (b) of the estimated regression equation here is 3.5.The intercept (a) is 20.Produce the 95% confidence interval estimate of the population slope, β, and report the upper bound for the interval.A)5.02
B)4.66
C)7.23
D)3.72
E)8.05
Question
You are attempting to link weekly hours of exercise (x) to blood pressure (y) using simple linear regression and the following data: 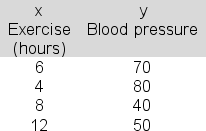 The estimated regression equation is y = 90 - 4x.Compute the standard error of estimate.
A)18.21
B)14.83
C)21.45
D)8.42
E)26.9
The estimated regression equation is y = 90 - 4x.Compute the standard error of estimate.A)18.21
B)14.83
C)21.45
D)8.42
E)26.9
Question
The following data have been collected for a simple linear regression analysis relating sales (y) to price (x):  In applying the least squares criterion, the slope (b) and the intercept (a) for the best-fitting line are b = -12 and a = 162.Produce the 99% confidence interval estimate of the population slope, β.Report the upper bound for your interval.
A)-16.7
B)40.5
C)21.4
D)-15.2
E)26.9
In applying the least squares criterion, the slope (b) and the intercept (a) for the best-fitting line are b = -12 and a = 162.Produce the 99% confidence interval estimate of the population slope, β.Report the upper bound for your interval.A)-16.7
B)40.5
C)21.4
D)-15.2
E)26.9
Question
The following data are available for a simple linear regression analysis attempting to link hours of training (x) to hourly output (y). 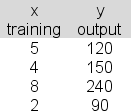 The least squares line would predict _______ units of output per hour when training is 7 hours.
A)168
B)190
C)204
D)218
E)152
The least squares line would predict _______ units of output per hour when training is 7 hours.A)168
B)190
C)204
D)218
E)152
Question
The following data are available for a simple linear regression analysis attempting to link hours of training (x) to hourly output (y).  In applying the least squares criterion, the slope (b) and the intercept (a) for the best-fitting line are b = 2.4 and a = 3.6.Compute the value of r, the correlation coefficient here.
A).735
B).776
C).857
D).926
In applying the least squares criterion, the slope (b) and the intercept (a) for the best-fitting line are b = 2.4 and a = 3.6.Compute the value of r, the correlation coefficient here.A).735
B).776
C).857
D).926
Question
The following data have been collected for a simple linear regression analysis relating sales (y) to price (x): 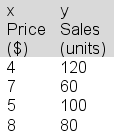 In applying the least squares criterion, the slope (b) and the intercept (a) for the best-fitting line are b = -12 and a = 162.You are to conduct a hypothesis test to determine whether you can reject the null hypothesis that the population slope, β, is 0 at the 1% significance level.Compute the value of the sample test statistic, tstat, and use it to reach the proper conclusion.
A)Since tstat is inside the critical ±9.925 boundaries, we can't reject the β = 0 null hypothesis.
B)Since tstat is outside the critical ±9.925 boundaries, we can reject the β = 0 null hypothesis.
C)Since tstat is inside the critical ±7.845 boundaries, we can't reject the β = 0 null hypothesis.
D)Since tstat is inside the critical ±7.845 boundaries, we can reject the β = 0 null hypothesis.
In applying the least squares criterion, the slope (b) and the intercept (a) for the best-fitting line are b = -12 and a = 162.You are to conduct a hypothesis test to determine whether you can reject the null hypothesis that the population slope, β, is 0 at the 1% significance level.Compute the value of the sample test statistic, tstat, and use it to reach the proper conclusion.A)Since tstat is inside the critical ±9.925 boundaries, we can't reject the β = 0 null hypothesis.
B)Since tstat is outside the critical ±9.925 boundaries, we can reject the β = 0 null hypothesis.
C)Since tstat is inside the critical ±7.845 boundaries, we can't reject the β = 0 null hypothesis.
D)Since tstat is inside the critical ±7.845 boundaries, we can reject the β = 0 null hypothesis.
Question
The following data have been collected for a simple linear regression analysis relating sales (y) to price (x):  In applying the least squares criterion, the slope (b) and the intercept (a) for the best-fitting line are b = -12 and a = 162.You are to conduct a hypothesis test to determine whether you can reject the null hypothesis that the population slope, β, is 0 at the 1% significance level.Report the value of the appropriate sample test statistic, tstat.
A)-2.27
B)-1.23
C)-4.16
D)-3.52
E)-3.01
In applying the least squares criterion, the slope (b) and the intercept (a) for the best-fitting line are b = -12 and a = 162.You are to conduct a hypothesis test to determine whether you can reject the null hypothesis that the population slope, β, is 0 at the 1% significance level.Report the value of the appropriate sample test statistic, tstat.A)-2.27
B)-1.23
C)-4.16
D)-3.52
E)-3.01
Question
You are attempting to link weekly hours of exercise (x) to blood pressure (y) using simple linear regression and the following data: 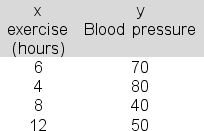 In applying the least squares criterion, the slope (b) and the intercept (a) for the best-fitting line are b = 90 and a = -4.Produce the 95% confidence interval estimate of the population intercept.Report the upper bound for your interval.
A)162
B)154
C)204
D)168
E)177
In applying the least squares criterion, the slope (b) and the intercept (a) for the best-fitting line are b = 90 and a = -4.Produce the 95% confidence interval estimate of the population intercept.Report the upper bound for your interval.A)162
B)154
C)204
D)168
E)177
Question
Karina Burkholtz believes there is a linear connection between the hourly rate (x) that her company charges for its truck rentals and the number of weekly rental hours (y) that the company sells.The following data are available: 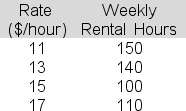 The slope term (b) in the estimated regression equation is -8.The intercept term (a) is 237.Construct a 95% confidence interval estimate of E(y12), the expected weekly rental hours for an hourly rate of $12.Report the upper bound for the interval.
A)89.6
B)166.3
C)182.8
D)125.7
E)137.2
The slope term (b) in the estimated regression equation is -8.The intercept term (a) is 237.Construct a 95% confidence interval estimate of E(y12), the expected weekly rental hours for an hourly rate of $12.Report the upper bound for the interval.A)89.6
B)166.3
C)182.8
D)125.7
E)137.2
Question
Lillian Chernov is trying to identify a linear relationship that can be used to estimate the construction cost for a new sports complex that her construction company is bidding on.Below is a table showing construction costs and floor area for a sample of five similar buildings in the area. 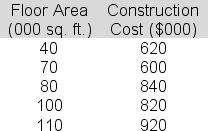 The slope for the least squares line is 4.4.The intercept is 408.Compute the "explained variation" (SSR) here.
A)58080
B)62365
C)39267
D)51256
E)49241
The slope for the least squares line is 4.4.The intercept is 408.Compute the "explained variation" (SSR) here.A)58080
B)62365
C)39267
D)51256
E)49241
Question
The following data are available for a simple linear regression analysis attempting to link hours of training (x) to hourly output (y).  The slope term in the estimated regression equation was 2.4.The intercept term (a) was 3.6.Show the 90% prediction interval for hourly output for an individual with 2.5 hours of training.Report the upper bound for the interval.
A)11.6
B)20.4
C)12.1
D)22.4
E)26.5
The slope term in the estimated regression equation was 2.4.The intercept term (a) was 3.6.Show the 90% prediction interval for hourly output for an individual with 2.5 hours of training.Report the upper bound for the interval.A)11.6
B)20.4
C)12.1
D)22.4
E)26.5
Question
The computer output below shows partial results for a linear regression analysis.Determine the standard error (standard deviation) of the sampling distribution of the sample slope that should be entered in the indicated cell of the output table: 

A)86.2
B)123.7
C)79.4
D)164.6
E)143.5
A)86.2
B)123.7
C)79.4
D)164.6
E)143.5
Question
A National football League agent is conducting a simple linear regression study linking passes caught in a season (x) to annual salary (y) for wide receivers in the league.The data for five players are shown below.  The slope for the least squares line is 2.2.The intercept is 182.Compute the standard error of estimate (sy.x) here.
A)116.34
B)67.82
C)43.51
D)18.19
E)21.68
The slope for the least squares line is 2.2.The intercept is 182.Compute the standard error of estimate (sy.x) here.A)116.34
B)67.82
C)43.51
D)18.19
E)21.68
Question
A cell phone's SAR (Specific Absorption Rate) is a measure of the amount of radio frequency (RF) energy absorbed by the body when using a cell phone.The rate can vary by the distance of the phone from the ear.Below is a table showing SAR (y) and distance (x) for a sample of five 10 minute calls. 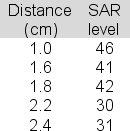 The slope of the least squares line is 59.6.The intercept is -12.Compute the "total variation" (SST).
A)432
B)202
C)316
D)520
E)164
The slope of the least squares line is 59.6.The intercept is -12.Compute the "total variation" (SST).A)432
B)202
C)316
D)520
E)164
Question
Economist Joshua Grant is using linear regression to try to establish a link between the unemployment rate (x) and monthly home sales in the region (y).The following data are available: 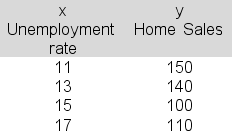 The slope term (b) in the estimated regression equation is -8.The intercept term (a) is 237.Construct a 95% confidence interval estimate of E(y5), the expected number of for months in which the unemployment rate is price is 5 percent.Report the upper bound for the interval.
A)326.4
B)205.7
C)289.3
D)227.5
E)301.6
The slope term (b) in the estimated regression equation is -8.The intercept term (a) is 237.Construct a 95% confidence interval estimate of E(y5), the expected number of for months in which the unemployment rate is price is 5 percent.Report the upper bound for the interval.A)326.4
B)205.7
C)289.3
D)227.5
E)301.6
Question
Tennis coach Ben Gordon is trying to identify a linear relationship that can be used to link average first serve velocity to the percent of first serve points won for his junior tennis players.Below is a table showing velocity and percent of points won for a sample of five junior players. 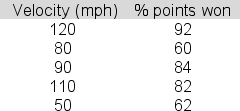 The slope of the least squares line is .44.The intercept is 36.4.Determine the value of R, the correlation coefficient, that you would insert in the table below.

A).719
B).926
C).773
D).848
E).874
The slope of the least squares line is .44.The intercept is 36.4.Determine the value of R, the correlation coefficient, that you would insert in the table below.A).719
B).926
C).773
D).848
E).874
Question
Tennis coach Ben Gordon is trying to identify a linear relationship that can be used to link average first serve velocity to the percent of first serve points won for his junior tennis players.Below is a table showing velocity and percent of points won for a sample of five junior players. 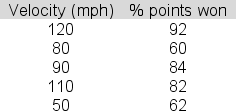 The slope of the least squares line is .44.The intercept is 36.4.Determine the value of R2, the coefficient of determination, that you would insert in the table below.

A).848
B).719
C).659
D).903
E).792
The slope of the least squares line is .44.The intercept is 36.4.Determine the value of R2, the coefficient of determination, that you would insert in the table below.A).848
B).719
C).659
D).903
E).792
Question
Kareem Martin is trying to identify a linear relationship linking the amount of heat (x) applied in the final hardening stage to the heavy duty steel bolts that his company produces for bridge construction and the strength of those bolts (y).Below is a table showing data for a sample of five of the bolts. 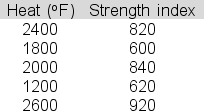 The slope for the least squares line is .22.The intercept is 320.Compute the "unexplained variation" (SSE) here.
A)58080
B)42365
C)39267
D)22720
E)49241
The slope for the least squares line is .22.The intercept is 320.Compute the "unexplained variation" (SSE) here.A)58080
B)42365
C)39267
D)22720
E)49241
Question
Economist Joshua Grant is using linear regression to try to establish a link between the unemployment rate (x) and home sales in Lane County (y) during a given month.The following data are available:  The slope term (b) in the estimated regression equation is -8.The intercept term (a) is 237.Compute the standard error of estimate (sy.x) here.
A)13.2
B)14.5
C)17.8
D)15.3
E)16.9
The slope term (b) in the estimated regression equation is -8.The intercept term (a) is 237.Compute the standard error of estimate (sy.x) here.A)13.2
B)14.5
C)17.8
D)15.3
E)16.9
Question
The following data have been collected for a simple linear regression analysis relating sales (y) to price (x):  The slope term (b) in the estimated regression equation is -12.The intercept term (a) is 162.Show the 90% prediction interval for sales in a particular case in which price is $6 (that is, for x = 6).Report the upper bound for your interval.
A)102.3
B)126.8
C)113.4
D)144.6
E)135.2
The slope term (b) in the estimated regression equation is -12.The intercept term (a) is 162.Show the 90% prediction interval for sales in a particular case in which price is $6 (that is, for x = 6).Report the upper bound for your interval.A)102.3
B)126.8
C)113.4
D)144.6
E)135.2
Question
Preston Gomez is attempting to identify a linear relationship that will link heating and air conditioning costs to total floor area for his commercial properties.Below is a table showing heating /AC costs and floor area for five buildings in the area. 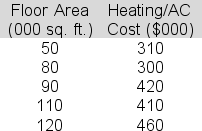 The computer output table below shows partial results for the linear regression analysis done here.Determine the upper bound on a 95% confidence interval estimate of the slope in the regression equation-a value that would be entered in the indicated cell of the output table.


A)3.56
B)5.14
C)4.21
D)3.19
E)4.73
The computer output table below shows partial results for the linear regression analysis done here.Determine the upper bound on a 95% confidence interval estimate of the slope in the regression equation-a value that would be entered in the indicated cell of the output table. A)3.56
B)5.14
C)4.21
D)3.19
E)4.73
Question
Karina Burkholtz believes there is a linear connection between the hourly rate (x) that her company charges for its truck rentals and the number of weekly rental hours (y) that the company sells.The following data are available:  Determine the total sum of squares (SST) that should be entered in the indicated cell below.


A)170000
B)164000
C)152000
D)198000
E)187000
Determine the total sum of squares (SST) that should be entered in the indicated cell below. A)170000
B)164000
C)152000
D)198000
E)187000
Question
A National Football League agent is conducting a simple linear regression study linking completion percentage in a season (x) to salary per game(y) for quarterbacks.The data for five players are shown below.  The slope for the least squares line is 4.4.The intercept is 182.Determine sy.x, the standard error of estimate, that should be entered in the table below.

A)116.34
B)67.82
C)43.51
D)18.19
E)21.68
The slope for the least squares line is 4.4.The intercept is 182.Determine sy.x, the standard error of estimate, that should be entered in the table below.A)116.34
B)67.82
C)43.51
D)18.19
E)21.68
Question
Economist Joshua Grant is using linear regression to try to establish a link between the unemployment rate (x) and monthly home sales in the region (y).The following data are available:  The slope term (b) in the estimated regression equation turns out to be -8.The intercept term (a) is 237.Explained variation (SSR) here would be _______.
A)560
B)920
C)1130
D)1280
E)840
The slope term (b) in the estimated regression equation turns out to be -8.The intercept term (a) is 237.Explained variation (SSR) here would be _______.A)560
B)920
C)1130
D)1280
E)840
Question
The computer output table below shows partial results for a linear regression analysis.To test the "no useful linear relationship" hypothesis, determine tstat for the sample slope-a value that would be entered in the indicated cell of the output table as shown. 

A)2.77
B)1.43
C)3.68
D)4.10
E)1.74
A)2.77
B)1.43
C)3.68
D)4.10
E)1.74
Question
Vicente Management is trying to identify a linear relationship that can be used to estimate the heating costs for its commercial properties.Below is a table showing heating costs and floor area for a sample of five buildings in the area. 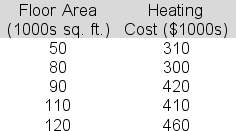 The slope of the least squares line is 2.2.The intercept is 182.Construct a 95% confidence interval estimate of E(y200), the expected heating cost for the set of all buildings that have 200,000 square feet of floor space.Report the upper bound for the interval.
A)754.3
B)836.5
C)678.1
D)792.8
E)906.9
The slope of the least squares line is 2.2.The intercept is 182.Construct a 95% confidence interval estimate of E(y200), the expected heating cost for the set of all buildings that have 200,000 square feet of floor space.Report the upper bound for the interval.A)754.3
B)836.5
C)678.1
D)792.8
E)906.9
Question
Karina Burkholtz believes there is a linear connection between the hourly rate (x) that her company charges for its truck rentals and the number of weekly rental hours (y) that the company sells.The following data are available: 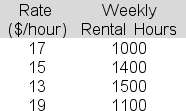 The slope term (b) in the estimated regression equation is -80.The intercept term (a) is 2530.Determine the value of the correlation coefficient R that you should enter in the indicated cell of the table below:

A).868
B).465
C).719
D).628
E).581
The slope term (b) in the estimated regression equation is -80.The intercept term (a) is 2530.Determine the value of the correlation coefficient R that you should enter in the indicated cell of the table below:A).868
B).465
C).719
D).628
E).581
Question
The computer output table below shows partial results for a linear regression analysis.Determine SSE, the Error Sum of Squares, that should be entered in the ANOVA table. 

A)12310
B)8480
C)18300
D)21210
E)19360
A)12310
B)8480
C)18300
D)21210
E)19360

Unlock Deck
Sign up to unlock the cards in this deck!
Unlock Deck
Unlock Deck
1/111
Play
Full screen (f)
Deck 11: Basic Regression Analysis
1
In simple linear regression, the least squares line fit to a sample of data will maximize the number of data points that will fall along that line.
False
2
A procedure used for finding the equation of a straight line that provides the best fit by minimizing the sum of the squared vertical distances of points from the line is called the least squares method.
True
3
In simple linear regression, the slope and intercept values for the least squares line fit to a sample of data points serve as point estimates of the slope and intercept terms of the least squares line that would be fit to the population of data points.
True
4
In multiple regression, a single independent variable is linked to a set of two or more dependent variables.
Unlock Deck
Unlock for access to all 111 flashcards in this deck.
Unlock Deck
k this deck
5
In simple linear regression, there is an additive relationship between SST, SSR, and SSE: that is, SST = SSR + SSE
Unlock Deck
Unlock for access to all 111 flashcards in this deck.
Unlock Deck
k this deck
6
In simple linear regression, the r2 value measures the percentage of total variation in the sample data that cannot be explained by the x-to-y relationship that has been identified.
Unlock Deck
Unlock for access to all 111 flashcards in this deck.
Unlock Deck
k this deck
7
The coefficient of determination r2, a measure of the goodness of fit of the estimated regression equation, is the ratio of the explained variation in y to the total variation in y, and takes on values between 0 and 1.
Unlock Deck
Unlock for access to all 111 flashcards in this deck.
Unlock Deck
k this deck
8
In a simple linear regression, the least squares line turns out to be y = 120 + 4x.The observed value of y when x = 10 is 182.The residual value for x = 10 must be 22.
Unlock Deck
Unlock for access to all 111 flashcards in this deck.
Unlock Deck
k this deck
9
In simple regression, the usual goal is to identify a cause-and-effect relationship between two variables.
Unlock Deck
Unlock for access to all 111 flashcards in this deck.
Unlock Deck
k this deck
10
In residual analysis, if the assumptions about the error term are valid then the plot of the residuals against the corresponding x values should have a funnel shape.
Unlock Deck
Unlock for access to all 111 flashcards in this deck.
Unlock Deck
k this deck
11
Residual analysis makes use of a plot of residuals (on the y axis) and the independent variable (on the x axis) to evaluate the assumptions about the error term in regression.
Unlock Deck
Unlock for access to all 111 flashcards in this deck.
Unlock Deck
k this deck
12
In simple linear regression, the least squares line fit to a sample of data points seeks to minimize the maximum distance of points from the line.
Unlock Deck
Unlock for access to all 111 flashcards in this deck.
Unlock Deck
k this deck
13
In simple linear regression, rejecting the null hypothesis in the key hypothesis test regarding the slope of the "population" line means we haven't yet found sufficient sample evidence that there's a useful linear relationship between x and y.
Unlock Deck
Unlock for access to all 111 flashcards in this deck.
Unlock Deck
k this deck
14
In simple linear regression, the difference between a predicted y value and an observed y value is commonly called the residual or error value.
Unlock Deck
Unlock for access to all 111 flashcards in this deck.
Unlock Deck
k this deck
15
When the slope of a simple linear regression equation is a negative value, the correlation coefficient can be either positive or negative.
Unlock Deck
Unlock for access to all 111 flashcards in this deck.
Unlock Deck
k this deck
16
In a simple linear regression, the least squares line turns out to be y = 120 + 4x.The sum of the residuals (errors) around this line will be 0.
Unlock Deck
Unlock for access to all 111 flashcards in this deck.
Unlock Deck
k this deck
17
A procedure used for finding the equation of a straight line that provides the best fit for the relationship between the independent and dependent variables is called the minimum deviations method.
Unlock Deck
Unlock for access to all 111 flashcards in this deck.
Unlock Deck
k this deck
18
In simple linear regression, the r2 value is the ratio of SSE/SST.
Unlock Deck
Unlock for access to all 111 flashcards in this deck.
Unlock Deck
k this deck
19
The standard error of estimate (sy.x) in simple linear regression is the square of the Mean Square Error (MSE) which is the sum of squares error (SSE) multiplied by its degrees of freedom n-2.
Unlock Deck
Unlock for access to all 111 flashcards in this deck.
Unlock Deck
k this deck
20
In simple linear regression, the variable that will be predicted is labeled the dependent variable.
Unlock Deck
Unlock for access to all 111 flashcards in this deck.
Unlock Deck
k this deck
21
If the correlation coefficient is a positive value, then the slope of the regression line:
A)must also be positive
B)can be either negative or positive
C)can be zero
D)must be negative
E)none of the above
A)must also be positive
B)can be either negative or positive
C)can be zero
D)must be negative
E)none of the above
Unlock Deck
Unlock for access to all 111 flashcards in this deck.
Unlock Deck
k this deck
22
A least squares line:
A)assumes a relationship between the slope of x and the intercept of y
B)may be used to predict a value of y if the corresponding x value is given
C)must be linear, upward-sloping and have a positive y-intercept
D)minimizes the sum of the deviations between the observed value of y and the estimated value of y
E)all of the above
Unlock Deck
Unlock for access to all 111 flashcards in this deck.
Unlock Deck
k this deck
23
In regression analysis, which of the following is NOT a required assumption about the error term ?
A)expected value of the error term is zero
B)variance of the error term is the same for all values of x
C)values of the error term are positive
D)error term is normally distributed
E)all of the above
A)expected value of the error term is zero
B)variance of the error term is the same for all values of x
C)values of the error term are positive
D)error term is normally distributed
E)all of the above
Unlock Deck
Unlock for access to all 111 flashcards in this deck.
Unlock Deck
k this deck
24
In simple linear regression, rejecting the = 0 null hypothesis in the key hypothesis test means:
A)we haven't yet found sufficient sample evidence that there's a useful linear relationship between x and y.
B)we have sufficient sample evidence that there's no useful linear relationship between x and y.
C)there is convincing sample evidence of a useful linear relationship between x and y.
D)the sum of the residuals is such that no linear relationship can be established between x and y.
E)that the p-value is greater than alpha.
Unlock Deck
Unlock for access to all 111 flashcards in this deck.
Unlock Deck
k this deck
25
Which of the following is NOT true regarding the coefficient of determination, r2?
A)it is the sum of squares error (SSE) divided by the sum of squares total (SST)
B)it is a measure of the goodness of fit of the estimated regression equation
C)it takes on values between 0 and 1
D)it explains the amount of variation in y due to x
E)none of the above: all are true
A)it is the sum of squares error (SSE) divided by the sum of squares total (SST)
B)it is a measure of the goodness of fit of the estimated regression equation
C)it takes on values between 0 and 1
D)it explains the amount of variation in y due to x
E)none of the above: all are true
Unlock Deck
Unlock for access to all 111 flashcards in this deck.
Unlock Deck
k this deck
26
Application of the least squares criterion to regression analysis results in values of the y intercept and the slope that minimizes the sum of the squared deviations between the:
A)observed values of x and the estimated values of y
B)observed values of y and the estimated values of x
C)observed values of the dependent variable and the estimated values of the dependent variable
D)observed values of the independent variable and the estimated values of the independent variable
E)none of the above
Unlock Deck
Unlock for access to all 111 flashcards in this deck.
Unlock Deck
k this deck
27
A regression analysis between demand (y in 1000 units) and price (x in $) resulted in the following equation: estimated Y = 9 - 5x.This equation implies that if the price is increased by $1, the demand is expected to
A)increase by 9000-5000 = 4000 units
B)decrease by 9000 units
C)decrease by 9000 + 5000 = 14,000 units
D)decrease by 5,000 units
E)none of the above
A)increase by 9000-5000 = 4000 units
B)decrease by 9000 units
C)decrease by 9000 + 5000 = 14,000 units
D)decrease by 5,000 units
E)none of the above
Unlock Deck
Unlock for access to all 111 flashcards in this deck.
Unlock Deck
k this deck
28
In simple linear regression, an r2 value of -.93 suggests that:
A)there is a fairly strong negative relationship between the variables.
B)the residual plot will be imprecise.
C)a computational error has been made.
D)the value of r (correlation coefficient) will be -.964.
E)none of the above
A)there is a fairly strong negative relationship between the variables.
B)the residual plot will be imprecise.
C)a computational error has been made.
D)the value of r (correlation coefficient) will be -.964.
E)none of the above
Unlock Deck
Unlock for access to all 111 flashcards in this deck.
Unlock Deck
k this deck
29
Which of the following best describes the least squares criterion?
A)it identifies the best fitting line as the line that minimizes the sum of the squared vertical distances of points from the line
B)the best fitting line minimizes the sum of the horizontal distances from the line
C)it minimizes the sum of the absolute distances from the line
D)it is a measure of the goodness of fit of the estimated regression equation
E)none of the above
Unlock Deck
Unlock for access to all 111 flashcards in this deck.
Unlock Deck
k this deck
30
In simple linear regression, the:
A)least squares line is used to predict values of the independent variable.
B)residual plot will reveal information about the basic model assumptions.
C)least square line will not pass through the point (average x, average y).
D)value of r (correlation coefficient) cannot be 0.
E)all of the above
A)least squares line is used to predict values of the independent variable.
B)residual plot will reveal information about the basic model assumptions.
C)least square line will not pass through the point (average x, average y).
D)value of r (correlation coefficient) cannot be 0.
E)all of the above
Unlock Deck
Unlock for access to all 111 flashcards in this deck.
Unlock Deck
k this deck
31
A least squares line:
A)implies a cause-effect relationship between x and y
B)may be used to predict a value of y if the corresponding x value is given
C)can only be determined if a good linear relationship exists between x and y
D)minimizes the sum of the deviations between the observed value of y and the estimated value of y
E)all of the above
Unlock Deck
Unlock for access to all 111 flashcards in this deck.
Unlock Deck
k this deck
32
The purpose of regression analysis is to find a mathematical relationship that allows us to:
A)predict the value of an independent variable based on the value of a dependent variable.
B)predict the value of a dependent variable based on the value of an independent variable.
C)determine whether the average value of one variable, x, differs significantly from the average value of another variable, y.
D)determine whether two events X and Y are statistically dependent or statistically independent.
E)determine whether there is a cause-and effect relationship between two variables.
Unlock Deck
Unlock for access to all 111 flashcards in this deck.
Unlock Deck
k this deck
33
In regression analysis, which of the following is NOT a required assumption about the error term, ?
A)expected value of the error term is zero
B)error term has a normal distribution
C)standard deviation of the error term is constant for all values of x
D)values of the error term are independent
E)none of the above, all are required assumptions
A)expected value of the error term is zero
B)error term has a normal distribution
C)standard deviation of the error term is constant for all values of x
D)values of the error term are independent
E)none of the above, all are required assumptions
Unlock Deck
Unlock for access to all 111 flashcards in this deck.
Unlock Deck
k this deck
34
Application of the least squares method to regression analysis results in values of the y intercept and the slope that minimizes the sum of the squared deviations between the:
A)residuals of x and the residuals of y
B)actual value of the y-intercept and the estimated value of the y- intercept
C)observed values of the dependent variable and the estimated values of the dependent variable
D)observed values of the independent variable and the estimated values of the independent variable
E)none of the above
Unlock Deck
Unlock for access to all 111 flashcards in this deck.
Unlock Deck
k this deck
35
In simple linear regression, given SSE = 2348 and SST = 3569,
A)SSR = 5917.
B)r2 = .342.
C)SSD = 1343.
D)r = .364.
E)MSE = 892
A)SSR = 5917.
B)r2 = .342.
C)SSD = 1343.
D)r = .364.
E)MSE = 892
Unlock Deck
Unlock for access to all 111 flashcards in this deck.
Unlock Deck
k this deck
36
Which of the following is correct?
A)SSE = SSR + SST
B)SSR = SSE + SST
C)SST = (SSR)2
D)SST = SSR + SSE
E)none of the above
A)SSE = SSR + SST
B)SSR = SSE + SST
C)SST = (SSR)2
D)SST = SSR + SSE
E)none of the above
Unlock Deck
Unlock for access to all 111 flashcards in this deck.
Unlock Deck
k this deck
37
Larger values of r2 imply that the observations are more closely grouped about the:
A)mean value of the independent variables
B)mean value of the dependent variable
C)least squares line
D)origin
E)none of the above
A)mean value of the independent variables
B)mean value of the dependent variable
C)least squares line
D)origin
E)none of the above
Unlock Deck
Unlock for access to all 111 flashcards in this deck.
Unlock Deck
k this deck
38
A regression analysis linking demand (y in 1000 units) and price (x in $) resulted in the following equation: estimated Y = 9 - 3x.This equation implies that if the price is decreased by $1, demand can be expected to:
A)increase by 9,000 units
B)decrease by 9,000 units
C)decrease by 3,000 units
D)increase by 3,000 units
E)none of the above
A)increase by 9,000 units
B)decrease by 9,000 units
C)decrease by 3,000 units
D)increase by 3,000 units
E)none of the above
Unlock Deck
Unlock for access to all 111 flashcards in this deck.
Unlock Deck
k this deck
39
In regression analysis, which of the following is NOT a required assumption about the error term, ?
A)The expected value of the error term is zero.
B)The error term follows a standard normal distribution.
C)The standard deviation is constant for all values of x
D)The values of the error term are independent.
E)none of the above, all are assumptions
A)The expected value of the error term is zero.
B)The error term follows a standard normal distribution.
C)The standard deviation is constant for all values of x
D)The values of the error term are independent.
E)none of the above, all are assumptions
Unlock Deck
Unlock for access to all 111 flashcards in this deck.
Unlock Deck
k this deck
40
Application of the least squares method to regression analysis results in values of the y intercept and the slope that minimizes the sum of the squared deviations between the:
A)observed values of the dependent variable and the estimated values of the dependent variable
B)observed x values and the estimated y values
C)actual values of the independent variable and the estimated values of the dependent variable
D)actual values of x and the estimated values of x
E)none of the above
Unlock Deck
Unlock for access to all 111 flashcards in this deck.
Unlock Deck
k this deck
41
The following data have been collected for a simple linear regression analysis: In applying the least squares criterion, the slope (b) and the intercept (a) for the best-fitting line are b = 1.4 and a = .2.Compute the value of r2 here.
A).65
B).23
C).58
D).36
E).70
In applying the least squares criterion, the slope (b) and the intercept (a) for the best-fitting line are b = 1.4 and a = .2.Compute the value of r2 here.A).65
B).23
C).58
D).36
E).70
Unlock Deck
Unlock for access to all 111 flashcards in this deck.
Unlock Deck
k this deck
42
You are attempting to link responses to a job announcement (y) to the number of days the announcement was repeated (x): The slope term (b) in the estimated regression equation was 1.0.The intercept term (a) was 3.5.Show the 99% confidence interval estimate of the expected number of responses when the number of days the announcement is repeated is 11 and report the upper bound for the interval.
A)15.62
B)18.90
C)20.35
D)26.43
E)22.29
The slope term (b) in the estimated regression equation was 1.0.The intercept term (a) was 3.5.Show the 99% confidence interval estimate of the expected number of responses when the number of days the announcement is repeated is 11 and report the upper bound for the interval.A)15.62
B)18.90
C)20.35
D)26.43
E)22.29
Unlock Deck
Unlock for access to all 111 flashcards in this deck.
Unlock Deck
k this deck
43
The following data are available for a simple linear regression analysis attempting to link hours of training (x) to hourly output (y). In applying the least squares criterion, the slope (b) and the intercept (a) for the best-fitting line are b = 2.4 and a = 3.6.Produce the 90% confidence interval estimate of the population slope, β.Report the upper bound for your interval.
A)6.86
B)8.29
C)4.42
D)5.71
E)3.90
In applying the least squares criterion, the slope (b) and the intercept (a) for the best-fitting line are b = 2.4 and a = 3.6.Produce the 90% confidence interval estimate of the population slope, β.Report the upper bound for your interval.A)6.86
B)8.29
C)4.42
D)5.71
E)3.90
Unlock Deck
Unlock for access to all 111 flashcards in this deck.
Unlock Deck
k this deck
44
In a simple linear regression analysis attempting to link lottery sales (y) to jackpot amount (x), the following data are available: The slope term (b) of the estimated regression equation turns out to be 3.5.The intercept term (a) turns out to be 20.Show the 95% prediction interval for sales for an individual case in which the jackpot is $9 (million).Show the upper bound for the interval.
A)55.6
B)78.2
C)62.4
D)73.7
E)81.1
The slope term (b) of the estimated regression equation turns out to be 3.5.The intercept term (a) turns out to be 20.Show the 95% prediction interval for sales for an individual case in which the jackpot is $9 (million).Show the upper bound for the interval.A)55.6
B)78.2
C)62.4
D)73.7
E)81.1
Unlock Deck
Unlock for access to all 111 flashcards in this deck.
Unlock Deck
k this deck
45
The following data have been collected for a simple linear regression analysis relating sales (y) to price (x): In applying the least squares criterion, the slope (b) and the intercept (a) for the best-fitting line are b = -12 and a = 162.Compute the value of r2 here.
A).66
B).72
C).54
D).77
E).81
In applying the least squares criterion, the slope (b) and the intercept (a) for the best-fitting line are b = -12 and a = 162.Compute the value of r2 here.A).66
B).72
C).54
D).77
E).81
Unlock Deck
Unlock for access to all 111 flashcards in this deck.
Unlock Deck
k this deck
46
The following data are available for a simple linear regression analysis attempting to link hours of training (x) to hourly output (y). In applying the least squares criterion, the slope (b) and the intercept (a) for the best-fitting line are b = 2.4 and a = 3.6.You are to set up a hypothesis test to determine whether you can reject the hypothesis that the population slope, β, is 0 at the 5% significance level.Report the value of the appropriate sample test statistic, tstat.
A)3.46
B)2.12
C)1.87
D)2.4
E)4.42
In applying the least squares criterion, the slope (b) and the intercept (a) for the best-fitting line are b = 2.4 and a = 3.6.You are to set up a hypothesis test to determine whether you can reject the hypothesis that the population slope, β, is 0 at the 5% significance level.Report the value of the appropriate sample test statistic, tstat.A)3.46
B)2.12
C)1.87
D)2.4
E)4.42
Unlock Deck
Unlock for access to all 111 flashcards in this deck.
Unlock Deck
k this deck
47
In a simple linear regression analysis attempting to relate sales (y) to price (x), the following data are available: The least squares line would predict a y value of _______ for an x value of 60.
A)90
B)80
C)75
D)71
E)84
The least squares line would predict a y value of _______ for an x value of 60.A)90
B)80
C)75
D)71
E)84
Unlock Deck
Unlock for access to all 111 flashcards in this deck.
Unlock Deck
k this deck
48
The following data have been collected for a simple linear regression analysis. The least squares line would predict a y value of _______ for an x value of 15.
A)16.2
B)21.4
C)20.9
D)19.3
E)18.1
The least squares line would predict a y value of _______ for an x value of 15.A)16.2
B)21.4
C)20.9
D)19.3
E)18.1
Unlock Deck
Unlock for access to all 111 flashcards in this deck.
Unlock Deck
k this deck
49
The following data are available for a simple linear regression analysis attempting to link hours of training (x) to hourly output (y). In applying the least squares criterion, the slope (b) and the intercept (a) for the best-fitting line are b = 2.4 and a = 3.6.Set up a hypothesis test to determine whether you can reject the hypothesis that the population slope, β, is 0 at the 5% significance level.Compute the value of the appropriate sample test statistic, tstat, and use it to reach the proper conclusion.
A)Since tstat is outside the critical values of ±3.213, we can reject the β=0 null hypothesis.
B)Since tstat is between the critical values of ±3.213, we can't reject the β=0 null hypothesis.
C)Since tstat is outside the critical values of ±4.403, we can reject the β=0 null hypothesis.
D)Since tstat is between the critical values of ±4.403, we can't reject the β=0 null hypothesis.
In applying the least squares criterion, the slope (b) and the intercept (a) for the best-fitting line are b = 2.4 and a = 3.6.Set up a hypothesis test to determine whether you can reject the hypothesis that the population slope, β, is 0 at the 5% significance level.Compute the value of the appropriate sample test statistic, tstat, and use it to reach the proper conclusion.A)Since tstat is outside the critical values of ±3.213, we can reject the β=0 null hypothesis.
B)Since tstat is between the critical values of ±3.213, we can't reject the β=0 null hypothesis.
C)Since tstat is outside the critical values of ±4.403, we can reject the β=0 null hypothesis.
D)Since tstat is between the critical values of ±4.403, we can't reject the β=0 null hypothesis.
Unlock Deck
Unlock for access to all 111 flashcards in this deck.
Unlock Deck
k this deck
50
You are attempting to link responses to a job announcement (y) to the number of days the announcement was repeated (x): The estimated regression equation is y = 7 + 1.0x.Compute the standard error of estimate.
A)4.61
B)2.45
C)3.67
D)5.49
E)1.27
The estimated regression equation is y = 7 + 1.0x.Compute the standard error of estimate.A)4.61
B)2.45
C)3.67
D)5.49
E)1.27
Unlock Deck
Unlock for access to all 111 flashcards in this deck.
Unlock Deck
k this deck
51
You are using linear regression to link number of responses to a job announcement (y) to the number of days the announcement was repeated (x): In applying the least squares criterion, the slope (b) and the intercept (a) for the best-fitting line are b = 1.0 and a = 3.5.Produce the 95% confidence interval estimate of the population intercept and report the upper bound for your interval.
A)4.5
B)9.7
C)8.3
D)6.1
E)7.2
In applying the least squares criterion, the slope (b) and the intercept (a) for the best-fitting line are b = 1.0 and a = 3.5.Produce the 95% confidence interval estimate of the population intercept and report the upper bound for your interval.A)4.5
B)9.7
C)8.3
D)6.1
E)7.2
Unlock Deck
Unlock for access to all 111 flashcards in this deck.
Unlock Deck
k this deck
52
You are attempting to link weekly hours of exercise (x) to blood pressure (y) using simple linear regression and the following data: In applying the least squares criterion, the slope (b) and the intercept (a) for the best-fitting line are b = -4 and a = 90.Produce the 95% confidence interval estimate of expected blood pressure when weekly exercise is 5 hours (that is, for x = 5) and report the upper bound for the interval.
A)85.6
B)70.0
C)111.8
D)93.2
E)78.3
In applying the least squares criterion, the slope (b) and the intercept (a) for the best-fitting line are b = -4 and a = 90.Produce the 95% confidence interval estimate of expected blood pressure when weekly exercise is 5 hours (that is, for x = 5) and report the upper bound for the interval.A)85.6
B)70.0
C)111.8
D)93.2
E)78.3
Unlock Deck
Unlock for access to all 111 flashcards in this deck.
Unlock Deck
k this deck
53
In a simple linear regression analysis attempting to link lottery sales (y) to jackpot amount (x), the following data are available: The slope (b) of the estimated regression equation here is 3.5.The intercept (a) is 20.Produce the 95% confidence interval estimate of the population slope, β, and report the upper bound for the interval.
A)5.02
B)4.66
C)7.23
D)3.72
E)8.05
The slope (b) of the estimated regression equation here is 3.5.The intercept (a) is 20.Produce the 95% confidence interval estimate of the population slope, β, and report the upper bound for the interval.A)5.02
B)4.66
C)7.23
D)3.72
E)8.05
Unlock Deck
Unlock for access to all 111 flashcards in this deck.
Unlock Deck
k this deck
54
You are attempting to link weekly hours of exercise (x) to blood pressure (y) using simple linear regression and the following data: The estimated regression equation is y = 90 - 4x.Compute the standard error of estimate.
A)18.21
B)14.83
C)21.45
D)8.42
E)26.9
The estimated regression equation is y = 90 - 4x.Compute the standard error of estimate.A)18.21
B)14.83
C)21.45
D)8.42
E)26.9
Unlock Deck
Unlock for access to all 111 flashcards in this deck.
Unlock Deck
k this deck
55
The following data have been collected for a simple linear regression analysis relating sales (y) to price (x): In applying the least squares criterion, the slope (b) and the intercept (a) for the best-fitting line are b = -12 and a = 162.Produce the 99% confidence interval estimate of the population slope, β.Report the upper bound for your interval.
A)-16.7
B)40.5
C)21.4
D)-15.2
E)26.9
In applying the least squares criterion, the slope (b) and the intercept (a) for the best-fitting line are b = -12 and a = 162.Produce the 99% confidence interval estimate of the population slope, β.Report the upper bound for your interval.A)-16.7
B)40.5
C)21.4
D)-15.2
E)26.9
Unlock Deck
Unlock for access to all 111 flashcards in this deck.
Unlock Deck
k this deck
56
The following data are available for a simple linear regression analysis attempting to link hours of training (x) to hourly output (y). The least squares line would predict _______ units of output per hour when training is 7 hours.
A)168
B)190
C)204
D)218
E)152
The least squares line would predict _______ units of output per hour when training is 7 hours.A)168
B)190
C)204
D)218
E)152
Unlock Deck
Unlock for access to all 111 flashcards in this deck.
Unlock Deck
k this deck
57
The following data are available for a simple linear regression analysis attempting to link hours of training (x) to hourly output (y). In applying the least squares criterion, the slope (b) and the intercept (a) for the best-fitting line are b = 2.4 and a = 3.6.Compute the value of r, the correlation coefficient here.
A).735
B).776
C).857
D).926
In applying the least squares criterion, the slope (b) and the intercept (a) for the best-fitting line are b = 2.4 and a = 3.6.Compute the value of r, the correlation coefficient here.A).735
B).776
C).857
D).926
Unlock Deck
Unlock for access to all 111 flashcards in this deck.
Unlock Deck
k this deck
58
The following data have been collected for a simple linear regression analysis relating sales (y) to price (x): In applying the least squares criterion, the slope (b) and the intercept (a) for the best-fitting line are b = -12 and a = 162.You are to conduct a hypothesis test to determine whether you can reject the null hypothesis that the population slope, β, is 0 at the 1% significance level.Compute the value of the sample test statistic, tstat, and use it to reach the proper conclusion.
A)Since tstat is inside the critical ±9.925 boundaries, we can't reject the β = 0 null hypothesis.
B)Since tstat is outside the critical ±9.925 boundaries, we can reject the β = 0 null hypothesis.
C)Since tstat is inside the critical ±7.845 boundaries, we can't reject the β = 0 null hypothesis.
D)Since tstat is inside the critical ±7.845 boundaries, we can reject the β = 0 null hypothesis.
In applying the least squares criterion, the slope (b) and the intercept (a) for the best-fitting line are b = -12 and a = 162.You are to conduct a hypothesis test to determine whether you can reject the null hypothesis that the population slope, β, is 0 at the 1% significance level.Compute the value of the sample test statistic, tstat, and use it to reach the proper conclusion.A)Since tstat is inside the critical ±9.925 boundaries, we can't reject the β = 0 null hypothesis.
B)Since tstat is outside the critical ±9.925 boundaries, we can reject the β = 0 null hypothesis.
C)Since tstat is inside the critical ±7.845 boundaries, we can't reject the β = 0 null hypothesis.
D)Since tstat is inside the critical ±7.845 boundaries, we can reject the β = 0 null hypothesis.
Unlock Deck
Unlock for access to all 111 flashcards in this deck.
Unlock Deck
k this deck
59
The following data have been collected for a simple linear regression analysis relating sales (y) to price (x): In applying the least squares criterion, the slope (b) and the intercept (a) for the best-fitting line are b = -12 and a = 162.You are to conduct a hypothesis test to determine whether you can reject the null hypothesis that the population slope, β, is 0 at the 1% significance level.Report the value of the appropriate sample test statistic, tstat.
A)-2.27
B)-1.23
C)-4.16
D)-3.52
E)-3.01
In applying the least squares criterion, the slope (b) and the intercept (a) for the best-fitting line are b = -12 and a = 162.You are to conduct a hypothesis test to determine whether you can reject the null hypothesis that the population slope, β, is 0 at the 1% significance level.Report the value of the appropriate sample test statistic, tstat.A)-2.27
B)-1.23
C)-4.16
D)-3.52
E)-3.01
Unlock Deck
Unlock for access to all 111 flashcards in this deck.
Unlock Deck
k this deck
60
You are attempting to link weekly hours of exercise (x) to blood pressure (y) using simple linear regression and the following data: In applying the least squares criterion, the slope (b) and the intercept (a) for the best-fitting line are b = 90 and a = -4.Produce the 95% confidence interval estimate of the population intercept.Report the upper bound for your interval.
A)162
B)154
C)204
D)168
E)177
In applying the least squares criterion, the slope (b) and the intercept (a) for the best-fitting line are b = 90 and a = -4.Produce the 95% confidence interval estimate of the population intercept.Report the upper bound for your interval.A)162
B)154
C)204
D)168
E)177
Unlock Deck
Unlock for access to all 111 flashcards in this deck.
Unlock Deck
k this deck
61
Karina Burkholtz believes there is a linear connection between the hourly rate (x) that her company charges for its truck rentals and the number of weekly rental hours (y) that the company sells.The following data are available: The slope term (b) in the estimated regression equation is -8.The intercept term (a) is 237.Construct a 95% confidence interval estimate of E(y12), the expected weekly rental hours for an hourly rate of $12.Report the upper bound for the interval.
A)89.6
B)166.3
C)182.8
D)125.7
E)137.2
The slope term (b) in the estimated regression equation is -8.The intercept term (a) is 237.Construct a 95% confidence interval estimate of E(y12), the expected weekly rental hours for an hourly rate of $12.Report the upper bound for the interval.A)89.6
B)166.3
C)182.8
D)125.7
E)137.2
Unlock Deck
Unlock for access to all 111 flashcards in this deck.
Unlock Deck
k this deck
62
Lillian Chernov is trying to identify a linear relationship that can be used to estimate the construction cost for a new sports complex that her construction company is bidding on.Below is a table showing construction costs and floor area for a sample of five similar buildings in the area. The slope for the least squares line is 4.4.The intercept is 408.Compute the "explained variation" (SSR) here.
A)58080
B)62365
C)39267
D)51256
E)49241
The slope for the least squares line is 4.4.The intercept is 408.Compute the "explained variation" (SSR) here.A)58080
B)62365
C)39267
D)51256
E)49241
Unlock Deck
Unlock for access to all 111 flashcards in this deck.
Unlock Deck
k this deck
63
The following data are available for a simple linear regression analysis attempting to link hours of training (x) to hourly output (y). The slope term in the estimated regression equation was 2.4.The intercept term (a) was 3.6.Show the 90% prediction interval for hourly output for an individual with 2.5 hours of training.Report the upper bound for the interval.
A)11.6
B)20.4
C)12.1
D)22.4
E)26.5
The slope term in the estimated regression equation was 2.4.The intercept term (a) was 3.6.Show the 90% prediction interval for hourly output for an individual with 2.5 hours of training.Report the upper bound for the interval.A)11.6
B)20.4
C)12.1
D)22.4
E)26.5
Unlock Deck
Unlock for access to all 111 flashcards in this deck.
Unlock Deck
k this deck
64
The computer output below shows partial results for a linear regression analysis.Determine the standard error (standard deviation) of the sampling distribution of the sample slope that should be entered in the indicated cell of the output table:
A)86.2
B)123.7
C)79.4
D)164.6
E)143.5
A)86.2
B)123.7
C)79.4
D)164.6
E)143.5
Unlock Deck
Unlock for access to all 111 flashcards in this deck.
Unlock Deck
k this deck
65
A National football League agent is conducting a simple linear regression study linking passes caught in a season (x) to annual salary (y) for wide receivers in the league.The data for five players are shown below. The slope for the least squares line is 2.2.The intercept is 182.Compute the standard error of estimate (sy.x) here.
A)116.34
B)67.82
C)43.51
D)18.19
E)21.68
The slope for the least squares line is 2.2.The intercept is 182.Compute the standard error of estimate (sy.x) here.A)116.34
B)67.82
C)43.51
D)18.19
E)21.68
Unlock Deck
Unlock for access to all 111 flashcards in this deck.
Unlock Deck
k this deck
66
A cell phone's SAR (Specific Absorption Rate) is a measure of the amount of radio frequency (RF) energy absorbed by the body when using a cell phone.The rate can vary by the distance of the phone from the ear.Below is a table showing SAR (y) and distance (x) for a sample of five 10 minute calls. The slope of the least squares line is 59.6.The intercept is -12.Compute the "total variation" (SST).
A)432
B)202
C)316
D)520
E)164
The slope of the least squares line is 59.6.The intercept is -12.Compute the "total variation" (SST).A)432
B)202
C)316
D)520
E)164
Unlock Deck
Unlock for access to all 111 flashcards in this deck.
Unlock Deck
k this deck
67
Economist Joshua Grant is using linear regression to try to establish a link between the unemployment rate (x) and monthly home sales in the region (y).The following data are available: The slope term (b) in the estimated regression equation is -8.The intercept term (a) is 237.Construct a 95% confidence interval estimate of E(y5), the expected number of for months in which the unemployment rate is price is 5 percent.Report the upper bound for the interval.
A)326.4
B)205.7
C)289.3
D)227.5
E)301.6
The slope term (b) in the estimated regression equation is -8.The intercept term (a) is 237.Construct a 95% confidence interval estimate of E(y5), the expected number of for months in which the unemployment rate is price is 5 percent.Report the upper bound for the interval.A)326.4
B)205.7
C)289.3
D)227.5
E)301.6
Unlock Deck
Unlock for access to all 111 flashcards in this deck.
Unlock Deck
k this deck
68
Tennis coach Ben Gordon is trying to identify a linear relationship that can be used to link average first serve velocity to the percent of first serve points won for his junior tennis players.Below is a table showing velocity and percent of points won for a sample of five junior players. The slope of the least squares line is .44.The intercept is 36.4.Determine the value of R, the correlation coefficient, that you would insert in the table below.
A).719
B).926
C).773
D).848
E).874
The slope of the least squares line is .44.The intercept is 36.4.Determine the value of R, the correlation coefficient, that you would insert in the table below.A).719
B).926
C).773
D).848
E).874
Unlock Deck
Unlock for access to all 111 flashcards in this deck.
Unlock Deck
k this deck
69
Tennis coach Ben Gordon is trying to identify a linear relationship that can be used to link average first serve velocity to the percent of first serve points won for his junior tennis players.Below is a table showing velocity and percent of points won for a sample of five junior players. The slope of the least squares line is .44.The intercept is 36.4.Determine the value of R2, the coefficient of determination, that you would insert in the table below.
A).848
B).719
C).659
D).903
E).792
The slope of the least squares line is .44.The intercept is 36.4.Determine the value of R2, the coefficient of determination, that you would insert in the table below.A).848
B).719
C).659
D).903
E).792
Unlock Deck
Unlock for access to all 111 flashcards in this deck.
Unlock Deck
k this deck
70
Kareem Martin is trying to identify a linear relationship linking the amount of heat (x) applied in the final hardening stage to the heavy duty steel bolts that his company produces for bridge construction and the strength of those bolts (y).Below is a table showing data for a sample of five of the bolts. The slope for the least squares line is .22.The intercept is 320.Compute the "unexplained variation" (SSE) here.
A)58080
B)42365
C)39267
D)22720
E)49241
The slope for the least squares line is .22.The intercept is 320.Compute the "unexplained variation" (SSE) here.A)58080
B)42365
C)39267
D)22720
E)49241
Unlock Deck
Unlock for access to all 111 flashcards in this deck.
Unlock Deck
k this deck
71
Economist Joshua Grant is using linear regression to try to establish a link between the unemployment rate (x) and home sales in Lane County (y) during a given month.The following data are available: The slope term (b) in the estimated regression equation is -8.The intercept term (a) is 237.Compute the standard error of estimate (sy.x) here.
A)13.2
B)14.5
C)17.8
D)15.3
E)16.9
The slope term (b) in the estimated regression equation is -8.The intercept term (a) is 237.Compute the standard error of estimate (sy.x) here.A)13.2
B)14.5
C)17.8
D)15.3
E)16.9
Unlock Deck
Unlock for access to all 111 flashcards in this deck.
Unlock Deck
k this deck
72
The following data have been collected for a simple linear regression analysis relating sales (y) to price (x): The slope term (b) in the estimated regression equation is -12.The intercept term (a) is 162.Show the 90% prediction interval for sales in a particular case in which price is $6 (that is, for x = 6).Report the upper bound for your interval.
A)102.3
B)126.8
C)113.4
D)144.6
E)135.2
The slope term (b) in the estimated regression equation is -12.The intercept term (a) is 162.Show the 90% prediction interval for sales in a particular case in which price is $6 (that is, for x = 6).Report the upper bound for your interval.A)102.3
B)126.8
C)113.4
D)144.6
E)135.2
Unlock Deck
Unlock for access to all 111 flashcards in this deck.
Unlock Deck
k this deck
73
Preston Gomez is attempting to identify a linear relationship that will link heating and air conditioning costs to total floor area for his commercial properties.Below is a table showing heating /AC costs and floor area for five buildings in the area. The computer output table below shows partial results for the linear regression analysis done here.Determine the upper bound on a 95% confidence interval estimate of the slope in the regression equation-a value that would be entered in the indicated cell of the output table.
A)3.56
B)5.14
C)4.21
D)3.19
E)4.73
The computer output table below shows partial results for the linear regression analysis done here.Determine the upper bound on a 95% confidence interval estimate of the slope in the regression equation-a value that would be entered in the indicated cell of the output table. A)3.56
B)5.14
C)4.21
D)3.19
E)4.73
Unlock Deck
Unlock for access to all 111 flashcards in this deck.
Unlock Deck
k this deck
74
Karina Burkholtz believes there is a linear connection between the hourly rate (x) that her company charges for its truck rentals and the number of weekly rental hours (y) that the company sells.The following data are available: Determine the total sum of squares (SST) that should be entered in the indicated cell below.
A)170000
B)164000
C)152000
D)198000
E)187000
Determine the total sum of squares (SST) that should be entered in the indicated cell below. A)170000
B)164000
C)152000
D)198000
E)187000
Unlock Deck
Unlock for access to all 111 flashcards in this deck.
Unlock Deck
k this deck
75
A National Football League agent is conducting a simple linear regression study linking completion percentage in a season (x) to salary per game(y) for quarterbacks.The data for five players are shown below. The slope for the least squares line is 4.4.The intercept is 182.Determine sy.x, the standard error of estimate, that should be entered in the table below.
A)116.34
B)67.82
C)43.51
D)18.19
E)21.68
The slope for the least squares line is 4.4.The intercept is 182.Determine sy.x, the standard error of estimate, that should be entered in the table below.A)116.34
B)67.82
C)43.51
D)18.19
E)21.68
Unlock Deck
Unlock for access to all 111 flashcards in this deck.
Unlock Deck
k this deck
76
Economist Joshua Grant is using linear regression to try to establish a link between the unemployment rate (x) and monthly home sales in the region (y).The following data are available: The slope term (b) in the estimated regression equation turns out to be -8.The intercept term (a) is 237.Explained variation (SSR) here would be _______.
A)560
B)920
C)1130
D)1280
E)840
The slope term (b) in the estimated regression equation turns out to be -8.The intercept term (a) is 237.Explained variation (SSR) here would be _______.A)560
B)920
C)1130
D)1280
E)840
Unlock Deck
Unlock for access to all 111 flashcards in this deck.
Unlock Deck
k this deck
77
The computer output table below shows partial results for a linear regression analysis.To test the "no useful linear relationship" hypothesis, determine tstat for the sample slope-a value that would be entered in the indicated cell of the output table as shown.
A)2.77
B)1.43
C)3.68
D)4.10
E)1.74
A)2.77
B)1.43
C)3.68
D)4.10
E)1.74
Unlock Deck
Unlock for access to all 111 flashcards in this deck.
Unlock Deck
k this deck
78
Vicente Management is trying to identify a linear relationship that can be used to estimate the heating costs for its commercial properties.Below is a table showing heating costs and floor area for a sample of five buildings in the area. The slope of the least squares line is 2.2.The intercept is 182.Construct a 95% confidence interval estimate of E(y200), the expected heating cost for the set of all buildings that have 200,000 square feet of floor space.Report the upper bound for the interval.
A)754.3
B)836.5
C)678.1
D)792.8
E)906.9
The slope of the least squares line is 2.2.The intercept is 182.Construct a 95% confidence interval estimate of E(y200), the expected heating cost for the set of all buildings that have 200,000 square feet of floor space.Report the upper bound for the interval.A)754.3
B)836.5
C)678.1
D)792.8
E)906.9
Unlock Deck
Unlock for access to all 111 flashcards in this deck.
Unlock Deck
k this deck
79
Karina Burkholtz believes there is a linear connection between the hourly rate (x) that her company charges for its truck rentals and the number of weekly rental hours (y) that the company sells.The following data are available: The slope term (b) in the estimated regression equation is -80.The intercept term (a) is 2530.Determine the value of the correlation coefficient R that you should enter in the indicated cell of the table below:
A).868
B).465
C).719
D).628
E).581
The slope term (b) in the estimated regression equation is -80.The intercept term (a) is 2530.Determine the value of the correlation coefficient R that you should enter in the indicated cell of the table below:A).868
B).465
C).719
D).628
E).581
Unlock Deck
Unlock for access to all 111 flashcards in this deck.
Unlock Deck
k this deck
80
The computer output table below shows partial results for a linear regression analysis.Determine SSE, the Error Sum of Squares, that should be entered in the ANOVA table.
A)12310
B)8480
C)18300
D)21210
E)19360
A)12310
B)8480
C)18300
D)21210
E)19360
Unlock Deck
Unlock for access to all 111 flashcards in this deck.
Unlock Deck
k this deck
Unlock Deck
Unlock for access to all 111 flashcards in this deck.


