Deck 9: Creating and Designing Graphs
Full screen (f)
Question
Question
Question
Question
Question
Question
Question
Question
Question
Question
Question
Question
Question
Question
Question
Question
Question
Question
Question
Question
Question
Question
Question
Question
Indicate the answer choice that best completes the statement or answers the question.
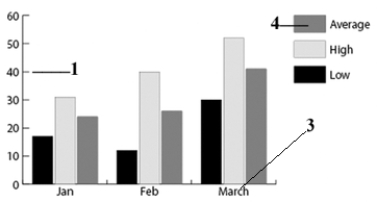
Item 3 in the above figure is an example of a ____.
A)legend
B)data series
C)category label
D)data label
Item 3 in the above figure is an example of a ____.
A)legend
B)data series
C)category label
D)data label
Question
Question
Question
Question
Question
Question
Question
Question
Question

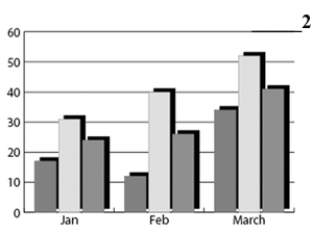
The above figure is an example of a Repeating Design graph.
Question
Question

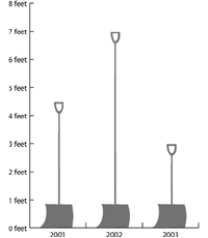
Item 2 in the above figure is a full length tick mark.
Question
Question
Question
Question
Question
Question
Question
Question

Item 1 of the above figure is called the ____.
A)value axis
B)category axis
C)data axis
D)graph axis
Question
Question
Question
Question
Question
Question
Question
Question
Question
Question
Item 2 of the above figure is an example of ____.
A)the graph grid
B)legend guides
C)full width tick marks
D)the value axis
Question
Question
Question

Item 4 in the above figure is an example of a ____.
A)series of data
B)legend
C)series of legends
D)series of categories
Question
Which of the following is not part of a grouped graph?
A)value axis labels
B)legend labels
C)each set of colored columns
D)rulers and guides
Question
The graph in the above figure is an example of a ____.
A)vertically scaled design
B)repeating design
C)sliding-scale design
D)uniformly scaled design
Question
Question
Question
Question
Question
Question
Question
Question
Question
Question
Question
Question
Question
Question
Question
Question
Question
Question
Question
Question
Question
Question

Unlock Deck
Sign up to unlock the cards in this deck!
Unlock Deck
Unlock Deck
1/96
Play
Full screen (f)
Deck 9: Creating and Designing Graphs
1
Numbers that are meant to be labels, such as a Zip code, need to be set in brackets to differentiate them from data that is meant to be plotted.
False
2
You can select groups within the graph by clicking with the Direct Selection tool twice.
False
3
Illustrator offers nine types of graphs for plotting data.
True
4
Tick marks are short lines that extend from the category axis.
Unlock Deck
Unlock for access to all 96 flashcards in this deck.
Unlock Deck
k this deck
5
Numbers on the value axis can have prefixes but not suffixes added to them.
Unlock Deck
Unlock for access to all 96 flashcards in this deck.
Unlock Deck
k this deck
6
Illustrator provides six options for displaying custom designs on a graph.
Unlock Deck
Unlock for access to all 96 flashcards in this deck.
Unlock Deck
k this deck
7
A custom graph design is simply a picture of something.
Unlock Deck
Unlock for access to all 96 flashcards in this deck.
Unlock Deck
k this deck
8
The Transpose row/column button on the Graph Data window is used to change the number of decimal points a number has.
Unlock Deck
Unlock for access to all 96 flashcards in this deck.
Unlock Deck
k this deck
9
Only bitmap objects can be used for custom graphs.
Unlock Deck
Unlock for access to all 96 flashcards in this deck.
Unlock Deck
k this deck
10
You cannot convert one type of graph into another once it has been created.
Unlock Deck
Unlock for access to all 96 flashcards in this deck.
Unlock Deck
k this deck
11
If you click too many times with the Group Selection tool, you may end up selecting the entire graph.
Unlock Deck
Unlock for access to all 96 flashcards in this deck.
Unlock Deck
k this deck
12
A set of data can be represented by a graphic element, such as a bar, line, or point.
Unlock Deck
Unlock for access to all 96 flashcards in this deck.
Unlock Deck
k this deck
13
If you needed to create a column graph showing how much more paper than glass, plastic, or aluminum is recycled in a major city over a one-year period, you could plot the paper recycling data as a line graph, leaving the other recycling categories as columns.
Unlock Deck
Unlock for access to all 96 flashcards in this deck.
Unlock Deck
k this deck
14
The drop shadow feature for graphs is in the Graph Type dialog box, not the Filter menu.
Unlock Deck
Unlock for access to all 96 flashcards in this deck.
Unlock Deck
k this deck
15
The Graph Type dialog box does not offer an option to add the number or value that each column, bar, or marker represents.
Unlock Deck
Unlock for access to all 96 flashcards in this deck.
Unlock Deck
k this deck
16
The value axis can be moved from the left of the graph to the right of the graph.
Unlock Deck
Unlock for access to all 96 flashcards in this deck.
Unlock Deck
k this deck
17
Some types of graphs in Illustrator include Pie, Radius, Line, and Stacked area.
Unlock Deck
Unlock for access to all 96 flashcards in this deck.
Unlock Deck
k this deck
18
You use the Graph Type tool to change the fill and stroke colors of graph groups.
Unlock Deck
Unlock for access to all 96 flashcards in this deck.
Unlock Deck
k this deck
19
You cannot convert a column graph into a bar graph.
Unlock Deck
Unlock for access to all 96 flashcards in this deck.
Unlock Deck
k this deck
20
Pie or column graphs are typically used to compare trends over time.
Unlock Deck
Unlock for access to all 96 flashcards in this deck.
Unlock Deck
k this deck
21
Data can be imported from other programs into the Graph Data window.
Unlock Deck
Unlock for access to all 96 flashcards in this deck.
Unlock Deck
k this deck
22
Category labels describe ____.
A)nonnumeric data such as the names of the days of the week
B)numeric data that may change such as weekly sales totals
C)one of the nine graph categories
D)data that is meant to be plotted
A)nonnumeric data such as the names of the days of the week
B)numeric data that may change such as weekly sales totals
C)one of the nine graph categories
D)data that is meant to be plotted
Unlock Deck
Unlock for access to all 96 flashcards in this deck.
Unlock Deck
k this deck
23
Which of the following cannot be replaced by a custom graph design?
A)markers
B)columns
C)bars
D)type
A)markers
B)columns
C)bars
D)type
Unlock Deck
Unlock for access to all 96 flashcards in this deck.
Unlock Deck
k this deck
24
Indicate the answer choice that best completes the statement or answers the question.
Item 3 in the above figure is an example of a ____.
A)legend
B)data series
C)category label
D)data label
Item 3 in the above figure is an example of a ____.
A)legend
B)data series
C)category label
D)data label
Unlock Deck
Unlock for access to all 96 flashcards in this deck.
Unlock Deck
k this deck
25
To remove data from cells in the Graph Data window, select the cells from which you want to delete the data, click ____ on the menu bar, and then click Clear.
A)Edit
B)File
C)Object
D)Cells
A)Edit
B)File
C)Object
D)Cells
Unlock Deck
Unlock for access to all 96 flashcards in this deck.
Unlock Deck
k this deck
26
The 1.0 that appears in the first cell of the Graph Data window is sample data used to create a temporary structure for a graph and should be removed.
Unlock Deck
Unlock for access to all 96 flashcards in this deck.
Unlock Deck
k this deck
27
If you enter category labels horizontally instead of vertically in the Graph Data window, you can ____.
A)click the Edit on the Menu bar, click Columns, and enter the category labels again
B)click the Clear button, and enter them again
C)click the Transpose row/column button to correct them
D)click the Clear button, and then in the Clear dialog box, click the Row/Column Reversal button
A)click the Edit on the Menu bar, click Columns, and enter the category labels again
B)click the Clear button, and enter them again
C)click the Transpose row/column button to correct them
D)click the Clear button, and then in the Clear dialog box, click the Row/Column Reversal button
Unlock Deck
Unlock for access to all 96 flashcards in this deck.
Unlock Deck
k this deck
28
Text labels, value axis labels, and legend labels are also individual groups within the larger graph group; ____ to select them, then change their font, size, or color as desired.
A)click twice
B)right-click
C)triple-click
D)click
A)click twice
B)right-click
C)triple-click
D)click
Unlock Deck
Unlock for access to all 96 flashcards in this deck.
Unlock Deck
k this deck
29
Data in the Graph data window can be imported from a(n) ____ file.
A)Microsoft Excel
B)Microsoft Word
C)Microsoft PowerPoint
D)Adobe InDesign
A)Microsoft Excel
B)Microsoft Word
C)Microsoft PowerPoint
D)Adobe InDesign
Unlock Deck
Unlock for access to all 96 flashcards in this deck.
Unlock Deck
k this deck
30
If you want to ensure that everything below a certain point on a custom graph design is not resized, you should use a(n) ____.
A)uniformly scaled design
B)sliding-scale design
C)vertically scaled design
D)linear gradient design
A)uniformly scaled design
B)sliding-scale design
C)vertically scaled design
D)linear gradient design
Unlock Deck
Unlock for access to all 96 flashcards in this deck.
Unlock Deck
k this deck
31
While working on a graph, you can do all but which of the following?
A)click the Apply button in the Graph Data panel to see changes made to the graph
B)remove data from cells in the Graph Data panel
C)change the data, if necessary
D)execute Illustrator spreadsheet functions to recalculate data
A)click the Apply button in the Graph Data panel to see changes made to the graph
B)remove data from cells in the Graph Data panel
C)change the data, if necessary
D)execute Illustrator spreadsheet functions to recalculate data
Unlock Deck
Unlock for access to all 96 flashcards in this deck.
Unlock Deck
k this deck
32
Graphs are grouped objects, consisting of many individual groups grouped together.
Unlock Deck
Unlock for access to all 96 flashcards in this deck.
Unlock Deck
k this deck
33
The above figure is an example of a Repeating Design graph.
Unlock Deck
Unlock for access to all 96 flashcards in this deck.
Unlock Deck
k this deck
34
Even if a rectangle has no fill or stroke, it will still be visible in Preview view.
Unlock Deck
Unlock for access to all 96 flashcards in this deck.
Unlock Deck
k this deck
35
Item 2 in the above figure is a full length tick mark.
Unlock Deck
Unlock for access to all 96 flashcards in this deck.
Unlock Deck
k this deck
36
A good choice for a graph that is meant to compare trends or changes over time would be a(n) ____.
A)pie or scatter graph
B)line or bar graph
C)area or pie graph
D)radial graphs
A)pie or scatter graph
B)line or bar graph
C)area or pie graph
D)radial graphs
Unlock Deck
Unlock for access to all 96 flashcards in this deck.
Unlock Deck
k this deck
37
Before you create a graph, it is important to understand how data is plotted in the ____ window.
A)Category
B)Graph Data
C)Import data
D)Group Data
A)Category
B)Graph Data
C)Import data
D)Group Data
Unlock Deck
Unlock for access to all 96 flashcards in this deck.
Unlock Deck
k this deck
38
Custom graph designs appear in the ____.
A)Graph Type dialog box
B)Custom Graph dialog box
C)Graph Column dialog box
D)Custom Design dialog box
A)Graph Type dialog box
B)Custom Graph dialog box
C)Graph Column dialog box
D)Custom Design dialog box
Unlock Deck
Unlock for access to all 96 flashcards in this deck.
Unlock Deck
k this deck
39
A combination graph helps you emphasize one set of numbers in comparison to others.
Unlock Deck
Unlock for access to all 96 flashcards in this deck.
Unlock Deck
k this deck
40
A set of data is represented by all except which of the following?
A)a line
B)a bar
C)a graphic element
D)an anchor point
A)a line
B)a bar
C)a graphic element
D)an anchor point
Unlock Deck
Unlock for access to all 96 flashcards in this deck.
Unlock Deck
k this deck
41
Which of the following is not true about the value axis?
A)It can be displayed on the left side of the graph.
B)It can be displayed on the right side of the graph.
C)It can only be displayed on the bottom of the graph.
D)It can be displayed on either side of the graph.
A)It can be displayed on the left side of the graph.
B)It can be displayed on the right side of the graph.
C)It can only be displayed on the bottom of the graph.
D)It can be displayed on either side of the graph.
Unlock Deck
Unlock for access to all 96 flashcards in this deck.
Unlock Deck
k this deck
42
Expanding a vertically scaled design to a column graph may present a problem if the custom design needs to maintain a(n) ____ ratio.
A)conversion
B)scale
C)custom
D)aspect
A)conversion
B)scale
C)custom
D)aspect
Unlock Deck
Unlock for access to all 96 flashcards in this deck.
Unlock Deck
k this deck
43
Item 1 of the above figure is called the ____.
A)value axis
B)category axis
C)data axis
D)graph axis
Unlock Deck
Unlock for access to all 96 flashcards in this deck.
Unlock Deck
k this deck
44
The following tool will let you select the value axis labels in just two clicks.
A)the Group Selection tool
B)the Direct Selection tool
C)the Selection tool
D)the Hand tool
A)the Group Selection tool
B)the Direct Selection tool
C)the Selection tool
D)the Hand tool
Unlock Deck
Unlock for access to all 96 flashcards in this deck.
Unlock Deck
k this deck
45
Only ____-based objects can be used for custom graph designs.
A)bitmap
B)gradient
C)paint
D)vector
A)bitmap
B)gradient
C)paint
D)vector
Unlock Deck
Unlock for access to all 96 flashcards in this deck.
Unlock Deck
k this deck
46
A graph that uses two graph styles to plot data is called a ____.
A)category graph
B)double graph
C)combination graph
D)mixed graph
A)category graph
B)double graph
C)combination graph
D)mixed graph
Unlock Deck
Unlock for access to all 96 flashcards in this deck.
Unlock Deck
k this deck
47
The Graph Type dialog box does not offer an option for ____.
A)changing the length of the tick marks
B)entering dollar signs before values on the value axis
C)moving the value axis
D)displaying the value that each column represents
A)changing the length of the tick marks
B)entering dollar signs before values on the value axis
C)moving the value axis
D)displaying the value that each column represents
Unlock Deck
Unlock for access to all 96 flashcards in this deck.
Unlock Deck
k this deck
48
Set the number in the ____ text box in the Cell Style dialog box in order to keep any decimal places from displaying.
A)Number of decimals
B)Significant digits
C)Decimals
D)Show value
A)Number of decimals
B)Significant digits
C)Decimals
D)Show value
Unlock Deck
Unlock for access to all 96 flashcards in this deck.
Unlock Deck
k this deck
49
Category labels, legend labels, and data are entered into the ____.
A)Graph Data window
B)Graph Data dialog box
C)Graph Data spreadsheet
D)Graph Picker
A)Graph Data window
B)Graph Data dialog box
C)Graph Data spreadsheet
D)Graph Picker
Unlock Deck
Unlock for access to all 96 flashcards in this deck.
Unlock Deck
k this deck
50
Legend labels describe ____.
A)nonnumeric data such as the names of the months
B)numeric data that may change such as weekly sales totals
C)data that is meant to be plotted
D)data that appears on the horizontal axis
A)nonnumeric data such as the names of the months
B)numeric data that may change such as weekly sales totals
C)data that is meant to be plotted
D)data that appears on the horizontal axis
Unlock Deck
Unlock for access to all 96 flashcards in this deck.
Unlock Deck
k this deck
51
Labels that consist of numbers such as the year 2008 and are not meant to be plotted must be ____.
A)surrounded by brackets
B)surrounded by parentheses
C)in italics
D)set in quotes
A)surrounded by brackets
B)surrounded by parentheses
C)in italics
D)set in quotes
Unlock Deck
Unlock for access to all 96 flashcards in this deck.
Unlock Deck
k this deck
52
A custom design that is resized vertically and horizontally is called a ____.
A)scaled design
B)repeating design
C)sliding-scale design
D)uniformly scaled design
A)scaled design
B)repeating design
C)sliding-scale design
D)uniformly scaled design
Unlock Deck
Unlock for access to all 96 flashcards in this deck.
Unlock Deck
k this deck
53
Item 2 of the above figure is an example of ____.
A)the graph grid
B)legend guides
C)full width tick marks
D)the value axis
Unlock Deck
Unlock for access to all 96 flashcards in this deck.
Unlock Deck
k this deck
54
Markers are small ____ that represent values on a line graph.
A)circles
B)squares
C)anchor points
D)warning triangles
A)circles
B)squares
C)anchor points
D)warning triangles
Unlock Deck
Unlock for access to all 96 flashcards in this deck.
Unlock Deck
k this deck
55
Which of the following can be used for a custom graph design?
A)objects filled with gradients
B)objects created with the Paintbrush tool
C)bitmap images
D)vector-based objects
A)objects filled with gradients
B)objects created with the Paintbrush tool
C)bitmap images
D)vector-based objects
Unlock Deck
Unlock for access to all 96 flashcards in this deck.
Unlock Deck
k this deck
56
Item 4 in the above figure is an example of a ____.
A)series of data
B)legend
C)series of legends
D)series of categories
Unlock Deck
Unlock for access to all 96 flashcards in this deck.
Unlock Deck
k this deck
57
Which of the following is not part of a grouped graph?
A)value axis labels
B)legend labels
C)each set of colored columns
D)rulers and guides
Unlock Deck
Unlock for access to all 96 flashcards in this deck.
Unlock Deck
k this deck
58
The graph in the above figure is an example of a ____.
A)vertically scaled design
B)repeating design
C)sliding-scale design
D)uniformly scaled design
Unlock Deck
Unlock for access to all 96 flashcards in this deck.
Unlock Deck
k this deck
59
To change the number of decimals displayed in the numbers in the Graph Data panel, click the ____.
A)Cell Style button
B)Decimal Number button
C)Decimal Style button
D)Number button
A)Cell Style button
B)Decimal Number button
C)Decimal Style button
D)Number button
Unlock Deck
Unlock for access to all 96 flashcards in this deck.
Unlock Deck
k this deck
60
You can use the ____ dialog box to extend the tick marks to run the full width of the graph.
A)Tick Marks
B)Format Graph
C)Full Width
D)Graph Type
A)Tick Marks
B)Format Graph
C)Full Width
D)Graph Type
Unlock Deck
Unlock for access to all 96 flashcards in this deck.
Unlock Deck
k this deck
61
Enter the appropriate word(s) to complete the statement.
To bring data from an Excel spreadsheet into the Graph Data window, click the ____________________ button.
To bring data from an Excel spreadsheet into the Graph Data window, click the ____________________ button.
Unlock Deck
Unlock for access to all 96 flashcards in this deck.
Unlock Deck
k this deck
62
Enter the appropriate word(s) to complete the statement.
If you want to change the number of decimals in any numbers in the Graph Data window, click the ____________________ button.
If you want to change the number of decimals in any numbers in the Graph Data window, click the ____________________ button.
Unlock Deck
Unlock for access to all 96 flashcards in this deck.
Unlock Deck
k this deck
63
A pie chart or a column chart is used to show ____.
A)a correlation between variables
B)a total quantity rather than to emphasize a portion of data
C)quantitative data as a percentage of the whole
D)a comparison of trends or changes over time
A)a correlation between variables
B)a total quantity rather than to emphasize a portion of data
C)quantitative data as a percentage of the whole
D)a comparison of trends or changes over time
Unlock Deck
Unlock for access to all 96 flashcards in this deck.
Unlock Deck
k this deck
64
The Connect Data Points check box displays in the ____ dialog box.
A)Markers
B)Data Points
C)Format
D)Graph Type
A)Markers
B)Data Points
C)Format
D)Graph Type
Unlock Deck
Unlock for access to all 96 flashcards in this deck.
Unlock Deck
k this deck
65
Enter the appropriate word(s) to complete the statement.
Tick marks and drop shadows can be chosen in the ____________________ dialog box.
Tick marks and drop shadows can be chosen in the ____________________ dialog box.
Unlock Deck
Unlock for access to all 96 flashcards in this deck.
Unlock Deck
k this deck
66
Enter the appropriate word(s) to complete the statement.
____________________ designs allow you to define a point on the custom design from which the design will stretch.
____________________ designs allow you to define a point on the custom design from which the design will stretch.
Unlock Deck
Unlock for access to all 96 flashcards in this deck.
Unlock Deck
k this deck
67
Enter the appropriate word(s) to complete the statement.
The ____________________ is the vertical line to the left of the graph.
The ____________________ is the vertical line to the left of the graph.
Unlock Deck
Unlock for access to all 96 flashcards in this deck.
Unlock Deck
k this deck
68
Enter the appropriate word(s) to complete the statement.
The ____________________ contains small boxes filled with colors that represent the columns on the graph.
The ____________________ contains small boxes filled with colors that represent the columns on the graph.
Unlock Deck
Unlock for access to all 96 flashcards in this deck.
Unlock Deck
k this deck
69
Enter the appropriate word(s) to complete the statement.
____________________ labels describe non-numeric data, such as the months of the year.
____________________ labels describe non-numeric data, such as the months of the year.
Unlock Deck
Unlock for access to all 96 flashcards in this deck.
Unlock Deck
k this deck
70
Enter the appropriate word(s) to complete the statement.
____________________ or radial graphs show a correlation between variables.
____________________ or radial graphs show a correlation between variables.
Unlock Deck
Unlock for access to all 96 flashcards in this deck.
Unlock Deck
k this deck
71
Enter the appropriate word(s) to complete the statement.
If you enter labels vertically instead of horizontally, or vice versa, in the Graph Data panel, you can click the ____________________ button to switch them.
If you enter labels vertically instead of horizontally, or vice versa, in the Graph Data panel, you can click the ____________________ button to switch them.
Unlock Deck
Unlock for access to all 96 flashcards in this deck.
Unlock Deck
k this deck
72
Enter the appropriate word(s) to complete the statement.
____________________ are short lines that extend out from the value axis.
____________________ are short lines that extend out from the value axis.
Unlock Deck
Unlock for access to all 96 flashcards in this deck.
Unlock Deck
k this deck
73
Enter the appropriate word(s) to complete the statement.
Only ____________________ objects can be used for custom graph designs.
Only ____________________ objects can be used for custom graph designs.
Unlock Deck
Unlock for access to all 96 flashcards in this deck.
Unlock Deck
k this deck
74
Enter the appropriate word(s) to complete the statement.
A(n) ____________________ graph is a graph that uses two graph styles to plot numeric data.
A(n) ____________________ graph is a graph that uses two graph styles to plot numeric data.
Unlock Deck
Unlock for access to all 96 flashcards in this deck.
Unlock Deck
k this deck
75
Enter the appropriate word(s) to complete the statement.
____________________ designs are resized vertically and horizontally.
____________________ designs are resized vertically and horizontally.
Unlock Deck
Unlock for access to all 96 flashcards in this deck.
Unlock Deck
k this deck
76
Enter the appropriate word(s) to complete the statement.
A(n) ____________________ design is simply a picture of something used to replace traditional columns, bars, or markers in Illustrator graphs.
A(n) ____________________ design is simply a picture of something used to replace traditional columns, bars, or markers in Illustrator graphs.
Unlock Deck
Unlock for access to all 96 flashcards in this deck.
Unlock Deck
k this deck
77
Enter the appropriate word(s) to complete the statement.
The intersection of a row and a column in the Graph Data window is called a(n) ____________________.
The intersection of a row and a column in the Graph Data window is called a(n) ____________________.
Unlock Deck
Unlock for access to all 96 flashcards in this deck.
Unlock Deck
k this deck
78
If you create a custom design that includes a company logo or picture that should not be resized, your graph type should be ____.
A)uniformly-scaled
B)sliding-scaled
C)repeat scale
D)vertically-scaled
A)uniformly-scaled
B)sliding-scaled
C)repeat scale
D)vertically-scaled
Unlock Deck
Unlock for access to all 96 flashcards in this deck.
Unlock Deck
k this deck
79
Enter the appropriate word(s) to complete the statement.
A set of ____________________ can be represented by a graphic element, such as a bar, line, or point.
A set of ____________________ can be represented by a graphic element, such as a bar, line, or point.
Unlock Deck
Unlock for access to all 96 flashcards in this deck.
Unlock Deck
k this deck
80
A graph is useful in order to do all of the following except____.
A)show a relationship among a set of numbers
B)simplify complex data
C)help communicate a message
D)blend objects
A)show a relationship among a set of numbers
B)simplify complex data
C)help communicate a message
D)blend objects
Unlock Deck
Unlock for access to all 96 flashcards in this deck.
Unlock Deck
k this deck
Unlock Deck
Unlock for access to all 96 flashcards in this deck.


