Deck 10: Statistical Thinking And Applications
Full screen (f)
Question
Question
Question
Question
Question
Question
Question
Question
Question
Question
Question
Question
Question
Question
Question
Question
Question
Question
Question
Question
Question
Question
Question
Question
Question
Question
Question
Question
Exhibit 10-1
In an audit of the outstanding bills in a large multi-national firm, the auditor selected a random sample of 40 of these bills and recorded the dollar value of each outstanding bill.The data were analyzed using Excel (see below).
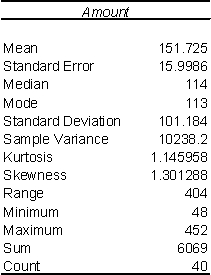
Refer to Exhibit 10-1.A 99% confidence interval for the population mean dollar value of the outstanding bills is equal to _____.
A) (114.4, 189.0)
B) (112.9, 190.6)
C) (110.5, 192.9)
D) (108.4, 195.1)
In an audit of the outstanding bills in a large multi-national firm, the auditor selected a random sample of 40 of these bills and recorded the dollar value of each outstanding bill.The data were analyzed using Excel (see below).
Refer to Exhibit 10-1.A 99% confidence interval for the population mean dollar value of the outstanding bills is equal to _____.
A) (114.4, 189.0)
B) (112.9, 190.6)
C) (110.5, 192.9)
D) (108.4, 195.1)
Question
Question
Question
Question
Question
Question
Question
Question
Question
Exhibit 10-1
In an audit of the outstanding bills in a large multi-national firm, the auditor selected a random sample of 40 of these bills and recorded the dollar value of each outstanding bill.The data were analyzed using Excel (see below).
Refer to Exhibit 10-1.Suppose the auditor wants to test,at a 1% significance level,the null hypothesis that the population mean dollar value of the outstanding bills is equal to 130.0 versus the alternative null hypothesis that the population mean dollar value of the outstanding bills is not equal to 130.0.The auditor:
A)should not reject the null hypothesis.
B)should reject the null hypothesis.
C)must collect more data before rejecting or not rejecting the null hypothesis.
D)cannot reject the null hypothesis with less than a 5% significance level.
Question
Question
Question
Question
Question
Question
Exhibit 10-2
A manager of a hotel chain is interested in investigating whether there is a relationship between staff labor hours and bed-day occupancy incurred by a hotel in a month.The manager randomly selected 17 of the hotels in the chain across the country and recorded, for each of the hotels, the staff's total labor hours for the month of July and the number of bed-days of occupancy for that month. (A hotel has occupied one "bed-day" if one bed is occupied (rented)for an entire day.)The manager is interested in seeing if the labor hours incurred can be predicted from the number of bed-days of occupancy on a monthly basis.
The sample data were analyzed using Excel.Shown below is part of the regression analysis output.
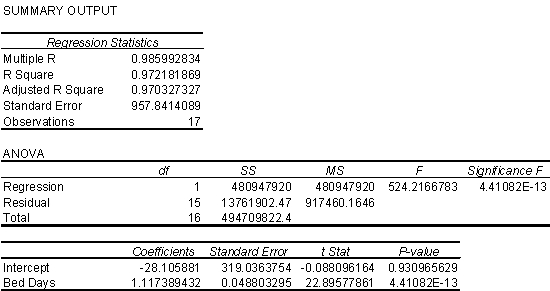
Refer to Exhibit 10-2.According to this regression analysis,what is the predicted number of monthly labor hours required for a hotel with 3000 bed-day of occupancy for the month?
A)4441.5
B)3352.2
C)4106.2
D)3882.8
A manager of a hotel chain is interested in investigating whether there is a relationship between staff labor hours and bed-day occupancy incurred by a hotel in a month.The manager randomly selected 17 of the hotels in the chain across the country and recorded, for each of the hotels, the staff's total labor hours for the month of July and the number of bed-days of occupancy for that month. (A hotel has occupied one "bed-day" if one bed is occupied (rented)for an entire day.)The manager is interested in seeing if the labor hours incurred can be predicted from the number of bed-days of occupancy on a monthly basis.
The sample data were analyzed using Excel.Shown below is part of the regression analysis output.
Refer to Exhibit 10-2.According to this regression analysis,what is the predicted number of monthly labor hours required for a hotel with 3000 bed-day of occupancy for the month?
A)4441.5
B)3352.2
C)4106.2
D)3882.8
Question
Exhibit 10-3
An engineer collected data from three different types of power drills.Specifically, the engineer collected data on how long (in minutes)each type of drill would run continuously after a full battery recharge.Each drill was charged and run continuously 15 times.The reported data are contained in the following table.The engineer analyzed the data using one-way ANOVA in Excel and the results from Excel are also given below.

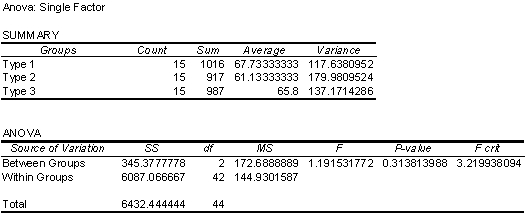
Refer to Exhibit 10-3.The one-way ANOVA was used to determine if the population mean continuous run times are equal (the null hypothesis)for all three types of drills,or if all pairs of population means are not equal (the alternative hypothesis).Which decisions could the manager make?
A)Reject the null hypothesis using a 5% significance level, and reject the null hypothesis using a 1% significance level.
B)Reject the null hypothesis using a 5% significance level, but do not reject the null hypothesis using a 1% significance level.
C)Reject the null hypothesis using a 1% significance level, but do not reject the null hypothesis using a 5% significance level.
D)Do not reject the null hypothesis using a 5% significance level, and do not reject the null hypothesis using a 1% significance level.
An engineer collected data from three different types of power drills.Specifically, the engineer collected data on how long (in minutes)each type of drill would run continuously after a full battery recharge.Each drill was charged and run continuously 15 times.The reported data are contained in the following table.The engineer analyzed the data using one-way ANOVA in Excel and the results from Excel are also given below.
Refer to Exhibit 10-3.The one-way ANOVA was used to determine if the population mean continuous run times are equal (the null hypothesis)for all three types of drills,or if all pairs of population means are not equal (the alternative hypothesis).Which decisions could the manager make?
A)Reject the null hypothesis using a 5% significance level, and reject the null hypothesis using a 1% significance level.
B)Reject the null hypothesis using a 5% significance level, but do not reject the null hypothesis using a 1% significance level.
C)Reject the null hypothesis using a 1% significance level, but do not reject the null hypothesis using a 5% significance level.
D)Do not reject the null hypothesis using a 5% significance level, and do not reject the null hypothesis using a 1% significance level.
Question
Question
Question
Exhibit 10-3
An engineer collected data from three different types of power drills.Specifically, the engineer collected data on how long (in minutes)each type of drill would run continuously after a full battery recharge.Each drill was charged and run continuously 15 times.The reported data are contained in the following table.The engineer analyzed the data using one-way ANOVA in Excel and the results from Excel are also given below.
Refer to Exhibit 10-3.What is the 95% confidence interval for the population mean continuous run time for the Type 3 drill?
A) (59.5, 72.1)
B) (54.1, 77.5)
C) (58.0, 73.6)
D) (59.9, 71.7)
Question
Question
Question
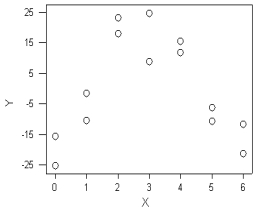
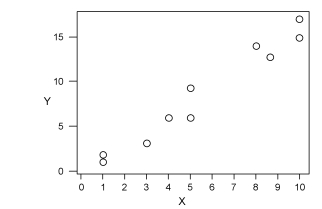
Three scatter diagrams are given below.How many of the diagrams present data that can be described by a linear relationship and,therefore,justifiably summarized by the correlation coefficient?
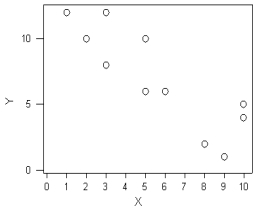
Plot A Plot B
Plot C
A)Plot A
B)Plot B
C)Plot A and Plot B
D)Plot A and Plot C
Plot A Plot B
Plot C
A)Plot A
B)Plot B
C)Plot A and Plot B
D)Plot A and Plot C
Question
Question
Question
Question
Question
Exhibit 10-2
A manager of a hotel chain is interested in investigating whether there is a relationship between staff labor hours and bed-day occupancy incurred by a hotel in a month.The manager randomly selected 17 of the hotels in the chain across the country and recorded, for each of the hotels, the staff's total labor hours for the month of July and the number of bed-days of occupancy for that month. (A hotel has occupied one "bed-day" if one bed is occupied (rented)for an entire day.)The manager is interested in seeing if the labor hours incurred can be predicted from the number of bed-days of occupancy on a monthly basis.
The sample data were analyzed using Excel.Shown below is part of the regression analysis output.
Refer to Exhibit 10-2.According to this regression analysis,if the number of bed-days increases by 200,what is the predicted change in the number of labor hours required for a given month?
A)a decrease of 5621.2
B)a decrease of 17.6
C)an increase of 223.5
D)an increase of 882.2
Question
Question
Exhibit 10-2
A manager of a hotel chain is interested in investigating whether there is a relationship between staff labor hours and bed-day occupancy incurred by a hotel in a month.The manager randomly selected 17 of the hotels in the chain across the country and recorded, for each of the hotels, the staff's total labor hours for the month of July and the number of bed-days of occupancy for that month. (A hotel has occupied one "bed-day" if one bed is occupied (rented)for an entire day.)The manager is interested in seeing if the labor hours incurred can be predicted from the number of bed-days of occupancy on a monthly basis.
The sample data were analyzed using Excel.Shown below is part of the regression analysis output.
Refer to Exhibit 10-2.For the estimated regression equation y = a + bx,what is the value of b?
A)-28.106
B)0.049
C)97.2
D)1.117
Question
Question
Question
Exhibit 10-2
A manager of a hotel chain is interested in investigating whether there is a relationship between staff labor hours and bed-day occupancy incurred by a hotel in a month.The manager randomly selected 17 of the hotels in the chain across the country and recorded, for each of the hotels, the staff's total labor hours for the month of July and the number of bed-days of occupancy for that month. (A hotel has occupied one "bed-day" if one bed is occupied (rented)for an entire day.)The manager is interested in seeing if the labor hours incurred can be predicted from the number of bed-days of occupancy on a monthly basis.
The sample data were analyzed using Excel.Shown below is part of the regression analysis output.
Refer to Exhibit 10-2.According to this regression analysis,what percentage of the variation in the number of monthly labor hours required for a hotel can be explained by the number of bed-day of occupancy in a month?
A)93.1%
B)97.0%
C)97.2%
D)98.6%
Question
Question
Question
Question
Question
Question
Question
Question
Question
Question
Question
Question
Question
Question
Question
Question
Question
Question
Question
Question

Unlock Deck
Sign up to unlock the cards in this deck!
Unlock Deck
Unlock Deck
1/97
Play
Full screen (f)
Deck 10: Statistical Thinking And Applications
1
As the sample size increases,the standard error of the mean increases,all else being held constant.
False
2
The Red Bead Experiment demonstrates that common-cause variation in processes cannot be predicted.
False
3
The number of defects observed in a sample is an example of a continuous random variable.
False
4
When interactions are present in an experiment,main effects have little meaning.
Unlock Deck
Unlock for access to all 97 flashcards in this deck.
Unlock Deck
k this deck
5
A confidence interval is a point estimate of a population parameter.
Unlock Deck
Unlock for access to all 97 flashcards in this deck.
Unlock Deck
k this deck
6
A census is a representative sample of the population.
Unlock Deck
Unlock for access to all 97 flashcards in this deck.
Unlock Deck
k this deck
7
All else being equal,as the confidence interval increases,the confidence level increases.
Unlock Deck
Unlock for access to all 97 flashcards in this deck.
Unlock Deck
k this deck
8
If two variables are negatively correlated,when one variable takes on a positive value,the other variable takes on a negative value.
Unlock Deck
Unlock for access to all 97 flashcards in this deck.
Unlock Deck
k this deck
9
Sample statistics are often used as point estimators for population parameters.
Unlock Deck
Unlock for access to all 97 flashcards in this deck.
Unlock Deck
k this deck
10
In hypothesis testing,the null hypothesis,H?,is assumed to be false in the absence of contradictory data.
Unlock Deck
Unlock for access to all 97 flashcards in this deck.
Unlock Deck
k this deck
11
A purpose of the Funnel Experiment is to demonstrate the effect of 'tampering.'
Unlock Deck
Unlock for access to all 97 flashcards in this deck.
Unlock Deck
k this deck
12
In simple regression,a function describes how the dependent variable is a function of the independent variable.
Unlock Deck
Unlock for access to all 97 flashcards in this deck.
Unlock Deck
k this deck
13
A discrete random variable can take on only finite values.
Unlock Deck
Unlock for access to all 97 flashcards in this deck.
Unlock Deck
k this deck
14
Products are boxed in groups of 25.Drawing a sample of boxes and inspecting all units in the boxes selected is an example of systematic sampling.
Unlock Deck
Unlock for access to all 97 flashcards in this deck.
Unlock Deck
k this deck
15
Deming's Funnel Experiment illustrates that people can and do create unwanted process variation by indiscriminately trying to remove common-cause variation.
Unlock Deck
Unlock for access to all 97 flashcards in this deck.
Unlock Deck
k this deck
16
Collecting,organizing,summarizing,and presenting data is referred to as statistical inference.
Unlock Deck
Unlock for access to all 97 flashcards in this deck.
Unlock Deck
k this deck
17
Correlation is a measure of the linear or non-linear relationship between two variables.
Unlock Deck
Unlock for access to all 97 flashcards in this deck.
Unlock Deck
k this deck
18
An airline that computes the average number of baggage handling errors that has occurred per 1,000 passengers in the last year is utilizing statistical inference.
Unlock Deck
Unlock for access to all 97 flashcards in this deck.
Unlock Deck
k this deck
19
Special-cause variation tends to be easily detectable using statistical methods.
Unlock Deck
Unlock for access to all 97 flashcards in this deck.
Unlock Deck
k this deck
20
A stable system contains only common cause variation.
Unlock Deck
Unlock for access to all 97 flashcards in this deck.
Unlock Deck
k this deck
21
The sampling method where every item in the population has an equal probability of being selected is called:
A)simple random sampling.
B)stratified sampling.
C)systematic sampling.
D)judgment sampling.
A)simple random sampling.
B)stratified sampling.
C)systematic sampling.
D)judgment sampling.
Unlock Deck
Unlock for access to all 97 flashcards in this deck.
Unlock Deck
k this deck
22
The component of statistical methodology that includes the collection,organization,and summarization of data is called:
A)descriptive statistics.
B)analytical statistics.
C)inferential statistics.
D)predictive statistics.
A)descriptive statistics.
B)analytical statistics.
C)inferential statistics.
D)predictive statistics.
Unlock Deck
Unlock for access to all 97 flashcards in this deck.
Unlock Deck
k this deck
23
Historical production data indicate that the diameter of a ball bearing is normally distributed with a mean of 0.525 cm and a standard deviation of 0.008 cm.Suppose that a sample of 16 ball bearings are randomly selected from a very large lot.Determine the probability that the average diameter of a sampled ball bearing is greater than 0.530 cm.
A)0.2324
B)0.4938
C)0.5062
D)0.0062
A)0.2324
B)0.4938
C)0.5062
D)0.0062
Unlock Deck
Unlock for access to all 97 flashcards in this deck.
Unlock Deck
k this deck
24
Which of the following constitutes an approach to reducing sampling error?
A)Cross-checking research designs with knowledgeable analysts
B)Questioning the assumption that tomorrow's and today's population are comparable
C)Taking a larger sample from the population
D)Reducing conditions that contribute to dissimilar population segments
A)Cross-checking research designs with knowledgeable analysts
B)Questioning the assumption that tomorrow's and today's population are comparable
C)Taking a larger sample from the population
D)Reducing conditions that contribute to dissimilar population segments
Unlock Deck
Unlock for access to all 97 flashcards in this deck.
Unlock Deck
k this deck
25
A subset of items selected from a population is called a:
A)sample.
B)statistic.
C)census.
D)parameter.
A)sample.
B)statistic.
C)census.
D)parameter.
Unlock Deck
Unlock for access to all 97 flashcards in this deck.
Unlock Deck
k this deck
26
The following sample data were collected: 12.0,18.3,29.6,14.3 and 27.8.The sample standard deviation for this data is equal to _____.
A)2.18
B)7.093
C)20.4
D)23.9
A)2.18
B)7.093
C)20.4
D)23.9
Unlock Deck
Unlock for access to all 97 flashcards in this deck.
Unlock Deck
k this deck
27
Partitioning a population into hierarchical groups or levels,and selecting a sample from each group or level is known as:
A)simple random sampling.
B)stratified sampling.
C)systematic sampling.
D)judgment sampling.
A)simple random sampling.
B)stratified sampling.
C)systematic sampling.
D)judgment sampling.
Unlock Deck
Unlock for access to all 97 flashcards in this deck.
Unlock Deck
k this deck
28
Exhibit 10-1
In an audit of the outstanding bills in a large multi-national firm, the auditor selected a random sample of 40 of these bills and recorded the dollar value of each outstanding bill.The data were analyzed using Excel (see below).
Refer to Exhibit 10-1.A 99% confidence interval for the population mean dollar value of the outstanding bills is equal to _____.
A) (114.4, 189.0)
B) (112.9, 190.6)
C) (110.5, 192.9)
D) (108.4, 195.1)
Unlock Deck
Unlock for access to all 97 flashcards in this deck.
Unlock Deck
k this deck
29
Characteristics of the population are called:
A)point estimates.
B)random variables.
C)statistics.
D)parameters.
A)point estimates.
B)random variables.
C)statistics.
D)parameters.
Unlock Deck
Unlock for access to all 97 flashcards in this deck.
Unlock Deck
k this deck
30
Suppose that a scatter diagram depicts a relationship between the two variables that can be summarized by a straight line.The correlation coefficient is computed and results in a value of -0.73.Which of the following is NOT TRUE?
A)There is a negative relationship between the two variables.
B)Two other variables having a correlation coefficient of -0.87 would have a stronger linear relationship.
C)In general, an increase in one variable is associated with an increase in the other variable.
D)Even though the correlation coefficient is less than zero, the correlation coefficient still communicates the strength of the linear relationship.
Unlock Deck
Unlock for access to all 97 flashcards in this deck.
Unlock Deck
k this deck
31
A system governed only by common cause variation is a system that:
A)ensures high productivity.
B)is stable.
C)meets a customer's quality specifications.
D)has zero natural variation.
A)ensures high productivity.
B)is stable.
C)meets a customer's quality specifications.
D)has zero natural variation.
Unlock Deck
Unlock for access to all 97 flashcards in this deck.
Unlock Deck
k this deck
32
All of the following are illustrated by the Red Bead Experiment EXCEPT:
A)management is responsible for the system.
B)all the variation in the production of red beads came entirely from the process itself.
C)special cause variation can be predicted.
D)numerical goals are often meaningless.
A)management is responsible for the system.
B)all the variation in the production of red beads came entirely from the process itself.
C)special cause variation can be predicted.
D)numerical goals are often meaningless.
Unlock Deck
Unlock for access to all 97 flashcards in this deck.
Unlock Deck
k this deck
33
_____ is the process of drawing conclusions about unknown characteristics of a population from which data are taken.
A)Logical inference
B)Post-data inference
C)Statistical inference
D)Random inference
A)Logical inference
B)Post-data inference
C)Statistical inference
D)Random inference
Unlock Deck
Unlock for access to all 97 flashcards in this deck.
Unlock Deck
k this deck
34
Which of the following is NOT a tool for descriptive statistics?
A)Frequency distribution
B)Regression analysis
C)Proportion
D)Histogram
A)Frequency distribution
B)Regression analysis
C)Proportion
D)Histogram
Unlock Deck
Unlock for access to all 97 flashcards in this deck.
Unlock Deck
k this deck
35
Which of the following requires the opinion of an expert to determine the location and characteristics of a definable sample group?
A)Judgment sample
B)Simple random sample
C)Systematic sample
D)Stratified sample
A)Judgment sample
B)Simple random sample
C)Systematic sample
D)Stratified sample
Unlock Deck
Unlock for access to all 97 flashcards in this deck.
Unlock Deck
k this deck
36
A particular type of plastic soap bottle is designed to have a capacity of 15 ounces.There is variation in the bottle manufacturing process.Based on historical data,suppose that bottle capacity can be reasonably modeled by a normal distribution with a mean of 15 ounces and a standard deviation of 0.2 ounces.What proportion of these bottles will have a capacity between 14.7 and 15.1 ounces?
A)0.3830
B)0.6247
C)0.8664
D)0.9876
A)0.3830
B)0.6247
C)0.8664
D)0.9876
Unlock Deck
Unlock for access to all 97 flashcards in this deck.
Unlock Deck
k this deck
37
Exhibit 10-1
In an audit of the outstanding bills in a large multi-national firm, the auditor selected a random sample of 40 of these bills and recorded the dollar value of each outstanding bill.The data were analyzed using Excel (see below).
Refer to Exhibit 10-1.Suppose the auditor wants to test,at a 1% significance level,the null hypothesis that the population mean dollar value of the outstanding bills is equal to 130.0 versus the alternative null hypothesis that the population mean dollar value of the outstanding bills is not equal to 130.0.The auditor:
A)should not reject the null hypothesis.
B)should reject the null hypothesis.
C)must collect more data before rejecting or not rejecting the null hypothesis.
D)cannot reject the null hypothesis with less than a 5% significance level.
Unlock Deck
Unlock for access to all 97 flashcards in this deck.
Unlock Deck
k this deck
38
A sample of size sixteen is randomly selected from a population of size 90.Determine the standard error of the mean if the population standard deviation equals 20.
A)2.11
B)4.16
C)4.56
D)5.00
A)2.11
B)4.16
C)4.56
D)5.00
Unlock Deck
Unlock for access to all 97 flashcards in this deck.
Unlock Deck
k this deck
39
A manager at a local manufacturing company has been monitoring the output of one of the machines used to manufacture small aluminum plates.Past data indicate that if the machine is operating "properly," the length of the plates produced by this machine can be modeled as being normally distributed with a mean of 117 centimeters and a standard deviation of 5.2 centimeters.Suppose 10 plates produced by this machine are randomly selected.What is the probability that the average length of these 10 plates will be between 116 and 120 centimeters when the machine is operating "properly?"
A)0.2709
B)0.2943
C)0.9656
D)0.6947
A)0.2709
B)0.2943
C)0.9656
D)0.6947
Unlock Deck
Unlock for access to all 97 flashcards in this deck.
Unlock Deck
k this deck
40
Statistical thinking is a philosophy of learning and action based on all of the following principles EXCEPT:
A)all work occurs in a system of interconnected processes.
B)variation exists in all processes.
C)all variation can be traced to human error.
D)understanding and reducing variation are keys to success.
A)all work occurs in a system of interconnected processes.
B)variation exists in all processes.
C)all variation can be traced to human error.
D)understanding and reducing variation are keys to success.
Unlock Deck
Unlock for access to all 97 flashcards in this deck.
Unlock Deck
k this deck
41
A manager at a market research firm randomly sampled 254 adult residents of Ohio and asked each resident if he/she planned to vacation outside of Ohio this coming summer.Sixty-three of these adults responded that they plan to vacation outside of Ohio this coming summer.What is the 95% confidence interval for the population proportion of adult residents of Ohio who plan to vacation outside of Ohio this coming summer?
A) (0.178, 0.318)
B) (0.246, 0.250)
C) (0.195, 0.301)
D) (0.142, 0.354)
A) (0.178, 0.318)
B) (0.246, 0.250)
C) (0.195, 0.301)
D) (0.142, 0.354)
Unlock Deck
Unlock for access to all 97 flashcards in this deck.
Unlock Deck
k this deck
42
Special causes of variation are often called _____ causes of variation.
A)assignable
B)complex
C)remaining
D)final
A)assignable
B)complex
C)remaining
D)final
Unlock Deck
Unlock for access to all 97 flashcards in this deck.
Unlock Deck
k this deck
43
Exhibit 10-2
A manager of a hotel chain is interested in investigating whether there is a relationship between staff labor hours and bed-day occupancy incurred by a hotel in a month.The manager randomly selected 17 of the hotels in the chain across the country and recorded, for each of the hotels, the staff's total labor hours for the month of July and the number of bed-days of occupancy for that month. (A hotel has occupied one "bed-day" if one bed is occupied (rented)for an entire day.)The manager is interested in seeing if the labor hours incurred can be predicted from the number of bed-days of occupancy on a monthly basis.
The sample data were analyzed using Excel.Shown below is part of the regression analysis output.
Refer to Exhibit 10-2.According to this regression analysis,what is the predicted number of monthly labor hours required for a hotel with 3000 bed-day of occupancy for the month?
A)4441.5
B)3352.2
C)4106.2
D)3882.8
Unlock Deck
Unlock for access to all 97 flashcards in this deck.
Unlock Deck
k this deck
44
Exhibit 10-3
An engineer collected data from three different types of power drills.Specifically, the engineer collected data on how long (in minutes)each type of drill would run continuously after a full battery recharge.Each drill was charged and run continuously 15 times.The reported data are contained in the following table.The engineer analyzed the data using one-way ANOVA in Excel and the results from Excel are also given below.
Refer to Exhibit 10-3.The one-way ANOVA was used to determine if the population mean continuous run times are equal (the null hypothesis)for all three types of drills,or if all pairs of population means are not equal (the alternative hypothesis).Which decisions could the manager make?
A)Reject the null hypothesis using a 5% significance level, and reject the null hypothesis using a 1% significance level.
B)Reject the null hypothesis using a 5% significance level, but do not reject the null hypothesis using a 1% significance level.
C)Reject the null hypothesis using a 1% significance level, but do not reject the null hypothesis using a 5% significance level.
D)Do not reject the null hypothesis using a 5% significance level, and do not reject the null hypothesis using a 1% significance level.
Unlock Deck
Unlock for access to all 97 flashcards in this deck.
Unlock Deck
k this deck
45
Understanding processes provides the context for determining the effects of ____ and the proper type of managerial action to be taken.
A)statistics
B)variation
C)managerial decisions
D)special causes
A)statistics
B)variation
C)managerial decisions
D)special causes
Unlock Deck
Unlock for access to all 97 flashcards in this deck.
Unlock Deck
k this deck
46
Sample ______ are often used as estimators of population _______.
A)parameters, parameters
B)statistics, statistics
C)statistics, parameters
D)parameters, statistics
A)parameters, parameters
B)statistics, statistics
C)statistics, parameters
D)parameters, statistics
Unlock Deck
Unlock for access to all 97 flashcards in this deck.
Unlock Deck
k this deck
47
Exhibit 10-3
An engineer collected data from three different types of power drills.Specifically, the engineer collected data on how long (in minutes)each type of drill would run continuously after a full battery recharge.Each drill was charged and run continuously 15 times.The reported data are contained in the following table.The engineer analyzed the data using one-way ANOVA in Excel and the results from Excel are also given below.
Refer to Exhibit 10-3.What is the 95% confidence interval for the population mean continuous run time for the Type 3 drill?
A) (59.5, 72.1)
B) (54.1, 77.5)
C) (58.0, 73.6)
D) (59.9, 71.7)
Unlock Deck
Unlock for access to all 97 flashcards in this deck.
Unlock Deck
k this deck
48
A government report gives a 99% confidence interval for the proportion of welfare recipients who have been receiving welfare benefits for more than 5 years to be 21% ± 4.5%.Which of the following intervals could not be a 95% confidence interval for the proportion of welfare recipients who have been receiving welfare benefits for more than 5 years?
A)21% ± 4.2%
B)21% ± 3.76%
C)21% ± 3.9%
D)21% ± 4.8%.
A)21% ± 4.2%
B)21% ± 3.76%
C)21% ± 3.9%
D)21% ± 4.8%.
Unlock Deck
Unlock for access to all 97 flashcards in this deck.
Unlock Deck
k this deck
49
_____ arise from external sources that are not inherent in the process.
A)External causes
B)Special variations
C)Special causes
D)Common causes
A)External causes
B)Special variations
C)Special causes
D)Common causes
Unlock Deck
Unlock for access to all 97 flashcards in this deck.
Unlock Deck
k this deck
50
Three scatter diagrams are given below.How many of the diagrams present data that can be described by a linear relationship and,therefore,justifiably summarized by the correlation coefficient?
Plot A Plot B
Plot C
A)Plot A
B)Plot B
C)Plot A and Plot B
D)Plot A and Plot C
Plot A Plot B
Plot C
A)Plot A
B)Plot B
C)Plot A and Plot B
D)Plot A and Plot C
Unlock Deck
Unlock for access to all 97 flashcards in this deck.
Unlock Deck
k this deck
51
Which of the following is NOT an operational problem created by variation?
A)Variation increases unpredictability.
B)Variation reduces capacity utilization.
C)Variation contributes to a "bullwhip" effect.
D)Variation makes it easy to find root causes.
A)Variation increases unpredictability.
B)Variation reduces capacity utilization.
C)Variation contributes to a "bullwhip" effect.
D)Variation makes it easy to find root causes.
Unlock Deck
Unlock for access to all 97 flashcards in this deck.
Unlock Deck
k this deck
52
At the organizational level,statistics helps executives with all of the following EXCEPT:
A)understand the business system and its core processes.
B)use data from the entire organization to assess performance.
C)keep employees better informed.
D)encourage employees to experiment to improve their work.
A)understand the business system and its core processes.
B)use data from the entire organization to assess performance.
C)keep employees better informed.
D)encourage employees to experiment to improve their work.
Unlock Deck
Unlock for access to all 97 flashcards in this deck.
Unlock Deck
k this deck
53
A quality engineer in a light bulb factory is planning a study to estimate the average life of a large shipment of light bulbs.The engineer wants to estimate the average life within plus or minus 15 hours with 95 percent confidence.Assuming a process standard deviation of 100 hours,determine the sample size for this study.
A)7
B)43
C)58
D)171
A)7
B)43
C)58
D)171
Unlock Deck
Unlock for access to all 97 flashcards in this deck.
Unlock Deck
k this deck
54
Calculating the average value of 5 sample measurements of door width is an example of:
A)descriptive statistics.
B)statistical inference.
C)predictive statistics.
D)analytical statistics.
A)descriptive statistics.
B)statistical inference.
C)predictive statistics.
D)analytical statistics.
Unlock Deck
Unlock for access to all 97 flashcards in this deck.
Unlock Deck
k this deck
55
Exhibit 10-2
A manager of a hotel chain is interested in investigating whether there is a relationship between staff labor hours and bed-day occupancy incurred by a hotel in a month.The manager randomly selected 17 of the hotels in the chain across the country and recorded, for each of the hotels, the staff's total labor hours for the month of July and the number of bed-days of occupancy for that month. (A hotel has occupied one "bed-day" if one bed is occupied (rented)for an entire day.)The manager is interested in seeing if the labor hours incurred can be predicted from the number of bed-days of occupancy on a monthly basis.
The sample data were analyzed using Excel.Shown below is part of the regression analysis output.
Refer to Exhibit 10-2.According to this regression analysis,if the number of bed-days increases by 200,what is the predicted change in the number of labor hours required for a given month?
A)a decrease of 5621.2
B)a decrease of 17.6
C)an increase of 223.5
D)an increase of 882.2
Unlock Deck
Unlock for access to all 97 flashcards in this deck.
Unlock Deck
k this deck
56
At the process level,statistical thinking can motivate managers in all of the following EXCEPT:
A)developing and assessing standardized project management systems.
B)setting realistic goals.
C)using data from the entire organization to assess performance.
D)focusing on the process without blaming employees for variation.
A)developing and assessing standardized project management systems.
B)setting realistic goals.
C)using data from the entire organization to assess performance.
D)focusing on the process without blaming employees for variation.
Unlock Deck
Unlock for access to all 97 flashcards in this deck.
Unlock Deck
k this deck
57
Exhibit 10-2
A manager of a hotel chain is interested in investigating whether there is a relationship between staff labor hours and bed-day occupancy incurred by a hotel in a month.The manager randomly selected 17 of the hotels in the chain across the country and recorded, for each of the hotels, the staff's total labor hours for the month of July and the number of bed-days of occupancy for that month. (A hotel has occupied one "bed-day" if one bed is occupied (rented)for an entire day.)The manager is interested in seeing if the labor hours incurred can be predicted from the number of bed-days of occupancy on a monthly basis.
The sample data were analyzed using Excel.Shown below is part of the regression analysis output.
Refer to Exhibit 10-2.For the estimated regression equation y = a + bx,what is the value of b?
A)-28.106
B)0.049
C)97.2
D)1.117
Unlock Deck
Unlock for access to all 97 flashcards in this deck.
Unlock Deck
k this deck
58
Everything else remaining constant,when the sample size increases:
A)the variance decreases.
B)the variance increases.
C)the variance is unaffected.
D)the variance could increase or decrease.
A)the variance decreases.
B)the variance increases.
C)the variance is unaffected.
D)the variance could increase or decrease.
Unlock Deck
Unlock for access to all 97 flashcards in this deck.
Unlock Deck
k this deck
59
An experiment that evaluates the effect of two temperatures (200 and 400 degrees)and two reaction times (50 and 100 minutes)on process yield has ___ possible combinations to test.
A)2
B)4
C)6
D)8
A)2
B)4
C)6
D)8
Unlock Deck
Unlock for access to all 97 flashcards in this deck.
Unlock Deck
k this deck
60
Exhibit 10-2
A manager of a hotel chain is interested in investigating whether there is a relationship between staff labor hours and bed-day occupancy incurred by a hotel in a month.The manager randomly selected 17 of the hotels in the chain across the country and recorded, for each of the hotels, the staff's total labor hours for the month of July and the number of bed-days of occupancy for that month. (A hotel has occupied one "bed-day" if one bed is occupied (rented)for an entire day.)The manager is interested in seeing if the labor hours incurred can be predicted from the number of bed-days of occupancy on a monthly basis.
The sample data were analyzed using Excel.Shown below is part of the regression analysis output.
Refer to Exhibit 10-2.According to this regression analysis,what percentage of the variation in the number of monthly labor hours required for a hotel can be explained by the number of bed-day of occupancy in a month?
A)93.1%
B)97.0%
C)97.2%
D)98.6%
Unlock Deck
Unlock for access to all 97 flashcards in this deck.
Unlock Deck
k this deck
61
_____ sampling is based on the assumption that if the first element is chosen at random,the entire sample will have the properties of a simple random sample.
A)Stratified random
B)Cluster
C)Systematic
D)Judgment
A)Stratified random
B)Cluster
C)Systematic
D)Judgment
Unlock Deck
Unlock for access to all 97 flashcards in this deck.
Unlock Deck
k this deck
62
At the individual or personal level,statistical thinking can help employees in all of the following EXCEPT:
A)be knowledgeable about variation.
B)set realistic goals.
C)analyze work data better.
D)identify important measures and improvement opportunities.
A)be knowledgeable about variation.
B)set realistic goals.
C)analyze work data better.
D)identify important measures and improvement opportunities.
Unlock Deck
Unlock for access to all 97 flashcards in this deck.
Unlock Deck
k this deck
63
_____ can often be tested by holding one variable constant while changing the other to determine effects of the change.
A)Causation
B)Improper sampling
C)Noncomparable data
D)Uncritical projection of trends
A)Causation
B)Improper sampling
C)Noncomparable data
D)Uncritical projection of trends
Unlock Deck
Unlock for access to all 97 flashcards in this deck.
Unlock Deck
k this deck
64
A mathematical function that assigns numerical values to every possible outcome in a sample space is called a _____.
A)probability function
B)population constant
C)sample variable
D)random variable
A)probability function
B)population constant
C)sample variable
D)random variable
Unlock Deck
Unlock for access to all 97 flashcards in this deck.
Unlock Deck
k this deck
65
According to Deming,the study of a dynamic time series is called:
A)analytic study.
B)dynamic study.
C)non-linear study.
D)enumerative study.
A)analytic study.
B)dynamic study.
C)non-linear study.
D)enumerative study.
Unlock Deck
Unlock for access to all 97 flashcards in this deck.
Unlock Deck
k this deck
66
A _____ is a subset of objects taken from the _____.
A)population; sample
B)cluster; superset
C)sample; population
D)population; universal set
A)population; sample
B)cluster; superset
C)sample; population
D)population; universal set
Unlock Deck
Unlock for access to all 97 flashcards in this deck.
Unlock Deck
k this deck
67
One of the biggest mistakes that people make in using statistical methods is confusing data that are sampled from a _____ with data sampled from a _____.
A)cluster sample; static population
B)random sample; judgment sample
C)static population; dynamic process
D)large sample; small population
A)cluster sample; static population
B)random sample; judgment sample
C)static population; dynamic process
D)large sample; small population
Unlock Deck
Unlock for access to all 97 flashcards in this deck.
Unlock Deck
k this deck
68
Errors in sampling generally stem from two causes: _____ error and _____ error.
A)design; computation
B)primary; auxillary
C)discrete; random
D)sampling; systematic
A)design; computation
B)primary; auxillary
C)discrete; random
D)sampling; systematic
Unlock Deck
Unlock for access to all 97 flashcards in this deck.
Unlock Deck
k this deck
69
The collectively exhaustive set of outcomes from an experiment makes up a _____.
A)random set
B)population
C)sample space
D)random variable.
A)random set
B)population
C)sample space
D)random variable.
Unlock Deck
Unlock for access to all 97 flashcards in this deck.
Unlock Deck
k this deck
70
A _____ sample is one obtained by separating the population into non-overlapping groups,and then selecting a simple random sample from each group.
A)stratified random
B)cluster
C)systematic
D)judgment
A)stratified random
B)cluster
C)systematic
D)judgment
Unlock Deck
Unlock for access to all 97 flashcards in this deck.
Unlock Deck
k this deck
71
_____ involves drawing inferences about two contrasting propositions relating to the value of a population parameter,one of which is assumed to be true in the absence of contradictory data.
A)Statistical inference
B)Hypothesis testing
C)Double-blind procedure
D)Model theory
A)Statistical inference
B)Hypothesis testing
C)Double-blind procedure
D)Model theory
Unlock Deck
Unlock for access to all 97 flashcards in this deck.
Unlock Deck
k this deck
72
If random samples are not used,_____ may be introduced.
A)control
B)bias
C)projection
D)probability
A)control
B)bias
C)projection
D)probability
Unlock Deck
Unlock for access to all 97 flashcards in this deck.
Unlock Deck
k this deck
73
Which of the following is Rule 1 in Deming's Funnel Experiment?
A)Leave the funnel alone.
B)Place the funnel over the spot where the marble last comes to rest.
C)Move the funnel an equal distance in the opposite direction from its current position.
D)Set the funnel an equal distance in the opposite direction of the error from the target.
A)Leave the funnel alone.
B)Place the funnel over the spot where the marble last comes to rest.
C)Move the funnel an equal distance in the opposite direction from its current position.
D)Set the funnel an equal distance in the opposite direction of the error from the target.
Unlock Deck
Unlock for access to all 97 flashcards in this deck.
Unlock Deck
k this deck
74
A _____ represents a theoretical model of the relative frequency of a random variable.
A)probability distribution
B)random distribution
C)sample
D)random variable
A)probability distribution
B)random distribution
C)sample
D)random variable
Unlock Deck
Unlock for access to all 97 flashcards in this deck.
Unlock Deck
k this deck
75
According to Deming,the analysis of a static population is called:
A)analytic study.
B)statistical inference.
C)dynamic study.
D)enumerative study.
A)analytic study.
B)statistical inference.
C)dynamic study.
D)enumerative study.
Unlock Deck
Unlock for access to all 97 flashcards in this deck.
Unlock Deck
k this deck
76
Which of the following is NOT a type of sampling procedure?
A)Stratified random sampling
B)Linear sampling
C)Cluster sampling
D)Judgment sampling
A)Stratified random sampling
B)Linear sampling
C)Cluster sampling
D)Judgment sampling
Unlock Deck
Unlock for access to all 97 flashcards in this deck.
Unlock Deck
k this deck
77
As the risks associated with making an incorrect conclusion cannot be quantified in the case of a non-random sample,_____ sampling is not a preferred method of sampling.
A)stratified random
B)cluster
C)systematic
D)judgment
A)stratified random
B)cluster
C)systematic
D)judgment
Unlock Deck
Unlock for access to all 97 flashcards in this deck.
Unlock Deck
k this deck
78
A typical group is selected,and a random sample is taken from within the group.This is an example of _____ sampling.
A)simple
B)stratified
C)cluster
D)judgment
A)simple
B)stratified
C)cluster
D)judgment
Unlock Deck
Unlock for access to all 97 flashcards in this deck.
Unlock Deck
k this deck
79
A(n)_____ experiment is a test or series of tests that enables the experimenter to compare two or more methods to determine which is better or determine levels of controllable factors to optimize the yield of a process or minimize the variability of a response variable.
A)designed
B)simple
C)controlled
D)optimal
A)designed
B)simple
C)controlled
D)optimal
Unlock Deck
Unlock for access to all 97 flashcards in this deck.
Unlock Deck
k this deck
80
A _____ can take on any real value over a specified interval of real numbers.
A)sample space
B)continuous random variable
C)discrete random variable population
D)discrete random population
A)sample space
B)continuous random variable
C)discrete random variable population
D)discrete random population
Unlock Deck
Unlock for access to all 97 flashcards in this deck.
Unlock Deck
k this deck
Unlock Deck
Unlock for access to all 97 flashcards in this deck.


