Deck 21: Business Statistics and Data Presentation
Full screen (f)
Question
Question
As the sales manager for Magnum Enterprises, you have been asked by the president to prepare the following charts for the shareholders' meeting next week. Use the six-month sales report, Table 21-1 on page 713, as the database for these charts. Calculate totals as required.
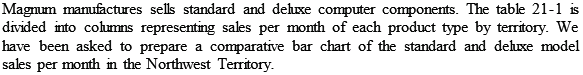
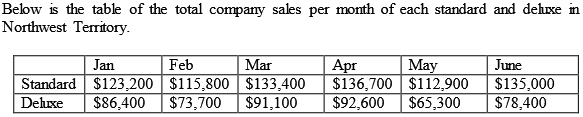
Comparative bar chart of the standard and deluxe model sales per month in the Northwest territory
Comparative bar chart of the standard and deluxe model sales per month in the Northwest territory
Question
Determine the range of the following sets of values.
184 237 256 359 36 71
184 237 256 359 36 71
Question
You arc the owner of The Green Machine, Inc., a. oar dealership specializing, in pre-owned hybrid automobiles. Yon have, a unique and motivating bonus plan for your salespeople that has worked well over the years.
Each quarter the mean number of cars sold is calculated. The first tune a salesperson sells more oars than the mean, lie or she earns a $100 bonus for each car over the mean in that quarter. If a salesperson exceeds the mean a second time in a year, the, bonus increases to $150 per car forthat Quarter. If a salesperson exceeds the mean three times in one year, the bonus is $200 per car for that quarter. If anyone exceeds the mean all four quarters, the fourth-quarter bonus is $300 per car. Remember, the bonus is paid only for the number of cars over the mean.
Each year the program starts over again. All bonuses are paid once per year, in January, forthe previous year. The following table represents, the number of hybrid cars sold by your five salespeople for each quarter last year. Calculate the bonus each person should receive for last year.
Question
Question
Question
Question
BUSINESS DECISION: CHOOSING A CHART
You have been asked to prepare a chart of stock prices for the upcoming semiannual stockholders' meeting for Magnum Enterprises. The following table shows Magnum's stock prices on the first day of each month. Choose and prepare a chart that best illustrates this information.
You have been asked to prepare a chart of stock prices for the upcoming semiannual stockholders' meeting for Magnum Enterprises. The following table shows Magnum's stock prices on the first day of each month. Choose and prepare a chart that best illustrates this information.
Question
Question
Question
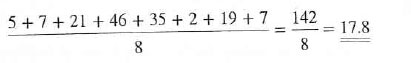
Calculate the mean of the following sets of values. Round to the nearest tenth when applicable.
5 7 21 46 35 2 19 7
5 7 21 46 35 2 19 7
Question
Question
Question
Question
The following numbers represent the gallons of chocolate fudge syrup used per month by a Dairy Queen to make hot fudge sundaes.

a. What is the mean of this set of data
b. What is the median of this set of data
c. What is the mode of this set of data
d. What is the range of this set of data
a. What is the mean of this set of data
b. What is the median of this set of data
c. What is the mode of this set of data
d. What is the range of this set of data
Question
Question
Question
You are the owner of The Dependable Delivery Service. Your company has four vehicles: a large and a small van and a large and a small truck. The following set of data represents the number of packages delivered last week.
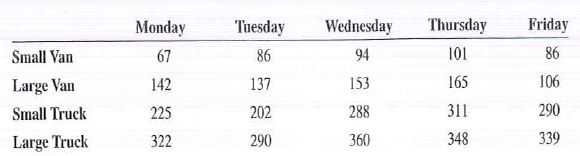
a. What is the mean number of packages delivered for each van
b. What is the median number of packages delivered for each truck
c. What is the mean number of packages delivered on Monday
d. What is the median number of packages delivered on Thursday
e. What is the mode of all the packages delivered during the week
f. What is the range of all the packages delivered during the week
Question
Question
Question
Question
The following data represent the monthly sales figure in thousands of dollars for the New York and California branches of universal Corporation.
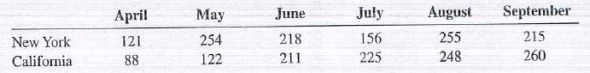
a. Construct a multiple-line chart depicting the monthly sales for the two branches. Showthe New York branch as a solid line and the California branch as a dashed line.
b. Construct a comparative bar chart for the same data. Highlight the bars for each branch differently.
a. Construct a multiple-line chart depicting the monthly sales for the two branches. Showthe New York branch as a solid line and the California branch as a dashed line.
b. Construct a comparative bar chart for the same data. Highlight the bars for each branch differently.
Question
Question
Determine the median of the following sets of values. Round to the nearest tenth when applicable.
Question
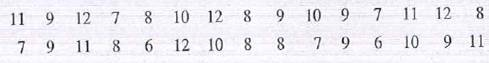
You are the vice president in charge of production for Endeavor Marine, Inc., a manufacturer of custom fishing boats. The following figures represent the number of boats manufactured during each of the past 18 months.
12 15 24 18 22 16 21 19 10 14 26 23 17 15 21 9 28 13
a. Group the data into five classes of equal size (5-9, 10-14, 15-19, 20-24, and 25-29) and construct a frequency distribution of the number of boats.
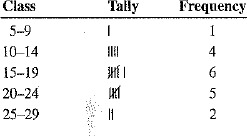
b. Calculate the mean of the grouped data by using 7, 12, 17, 22, and 27 as the midpoints. Round the mean to the nearest tenth if necessary.
C. Construct a histogram of these data to graphically illustrate your company's boat manufacturing figures.
12 15 24 18 22 16 21 19 10 14 26 23 17 15 21 9 28 13
a. Group the data into five classes of equal size (5-9, 10-14, 15-19, 20-24, and 25-29) and construct a frequency distribution of the number of boats.
b. Calculate the mean of the grouped data by using 7, 12, 17, 22, and 27 as the midpoints. Round the mean to the nearest tenth if necessary.
C. Construct a histogram of these data to graphically illustrate your company's boat manufacturing figures.
Question
Question
Question
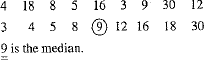
Determine the median of the following sets of values. Round to the nearest tenth when applicable.
56 34 28 60 48 55
56 34 28 60 48 55
Question
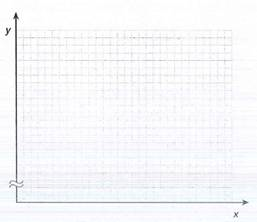
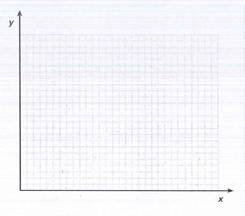
You are the sales manager of the Esquire Sportswear Company. Last week your 30 salespeople reported the following automobile mileage while making sales calls to retail stores around the state:

a. Group the data into seven classes of equal size (0 99,100 199, 200 299,300 399, etc.) and construct a frequency distribution of the mileage.
b. Calculate the mean of the grouped data by using 49.5, 149.5, 249.5, etc., as the midpoints.
c. Using the grid provided below, prepare a histogram of these data to illustrate your salespeoples' mileage graphically.
Question
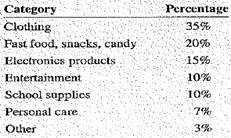
Construct a pie chart from the following information compiled in a recent survey of the buying of children aged 8 to. 17.
Question
Question
Question
You are the owner of the Internet Cafe. As part of a marketing effort to increase the "average sale" per customer, you recently did a survey of the lunch-hour sales receipts for a busy Saturday. Following are the results of that survey.
a. Group the sales receipts into six classes of equal size ($4.00-$4.99, $5.00-$5.99, etc.) and construct a frequency distribution.
b. Calculate the mean of the grouped data.
c. Using the grid provided below, prepare a histogram of the sales receipts.
a. Group the sales receipts into six classes of equal size ($4.00-$4.99, $5.00-$5.99, etc.) and construct a frequency distribution.
b. Calculate the mean of the grouped data.
c. Using the grid provided below, prepare a histogram of the sales receipts.
Question
Question
Question
Question
Question
Use the line chart "Widget Sales 2009-2016" to answer the following questions.
a. What was the amount of widget sales in 2009
b. In what year did widget sales reach $0.8 billion

c. What does this line graph represent
d. What variables are represented on the x-axis and the y-axis
e. What was the amount of widget sales in 2015
f. In which year did sales reach $0.6 billion
g. Calculate how much greater widget sales were in 2016 compared with 2009.
a. What was the amount of widget sales in 2009
b. In what year did widget sales reach $0.8 billion
c. What does this line graph represent
d. What variables are represented on the x-axis and the y-axis
e. What was the amount of widget sales in 2015
f. In which year did sales reach $0.6 billion
g. Calculate how much greater widget sales were in 2016 compared with 2009.
Question
Question
Question
As the sales manager for Magnum Enterprises, you have been asked by the president to prepare the following charts for the shareholders' meeting next week. Use the six-month sales report, Table 21-1 on page 713, as the database for these charts. Calculate totals as required.
Single-line chart of the total company sales per month
Single-line chart of the total company sales per month
Question
Determine the mode of the following sets of values.
8 3 5 6 3 7 2 1 8 2 4 3 6 2
8 3 5 6 3 7 2 1 8 2 4 3 6 2
Question
You have just been hired as the quality control manager for Pressure Point Manufacturing, a company producing fuel injection systems for General Motors, Ford, and Chrysler. Top management has requested a status report on the number of defective units produced each day. You decide to keep track of the number of defects each day for 30 days. Following are the results of your survey.
Pressure point Manufacturing Defects per day Survey-1
a. Find the mean, median, mode, and range of these data for your report to top management.
After implementing your suggestions for improved quality on the production line, you decide to survey the defects for another 30 days with the following results:
Pressure point ManufacturingDefects per daySurvey-2
b. Find the mean, median, mode, and range of the new data
c. If the company's cost to fix.each defective unit is $75, use the mean of each survey to calculate tire average cost per day for defects before and after your improvements
d. Theoretically, how much will your improvements save the company in a 300-day production year
e. Congratulations! The company has awarded you a bonus amounting to 15% of the first year's savings- How much is your bonus check
Question
As the sales manager for Magnum Enterprises, you have been asked by the president to prepare the following charts for the shareholders' meeting next week. Use the six-month sales report, Table 21-1 on page 713, as the database for these charts. Calculate totals as required.
Multiple-line chart of the total sales per month of each model, standard and deluxe
Multiple-line chart of the total sales per month of each model, standard and deluxe
Question
Question
Question
As the sales manager for Magnum Enterprises, you have been asked by the president to prepare the following charts for the shareholders' meeting next week. Use the six-month sales report, Table 21-1 on page 713, as the database for these charts. Calculate totals as required.
Standard bar chart of the deluxe sales per month in the Southeast territory
Standard bar chart of the deluxe sales per month in the Southeast territory
Question
Question
You are the human resource director for Apollo Industries. Forty applicants for employment were given an assessment test in math and English with the following results:
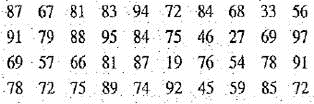
a. What arc the range and mode of these scores
b. Group the 1 data into nine classes of equal size (11-20, 21-30, etc,) and construct a frequency distribution.
c. Calculate the mean of the grouped data by using 15.5, 25.5, etc., as the midpoints.
d. If company policy is to consider only those who score 10 points higher or better than the mean of the data, how many from this group arc still being considered for the job
e. Construct a histogram of the assessment test scores frequency distribution.
Question
As the sales manager for Magnum Enterprises, you have been asked by the president to prepare the following charts for the shareholders' meeting next week. Use the six-month sales report, Table 21-1 on page 713, as the database for these charts. Calculate totals as required.
Component bar chart of the standard and deluxe model sales as components of total monthly sales in the Northeast territory
Component bar chart of the standard and deluxe model sales as components of total monthly sales in the Northeast territory
Question

Unlock Deck
Sign up to unlock the cards in this deck!
Unlock Deck
Unlock Deck
1/51
Play
Full screen (f)
Deck 21: Business Statistics and Data Presentation
1
The horizontal axis of a line chart is known as the _______and is used to measure units of time; the vertical axis of a line chart is known as the ______and is used to measure the quantity or magnitude of something. (21-2)
The horizontal axis of a line chart is known as the x-axis and is used to measure units of time; is used to measure units of time; the vertical axis of a line chart is known as the y-axis and is used to measure the quantity or magnitude of something.
2
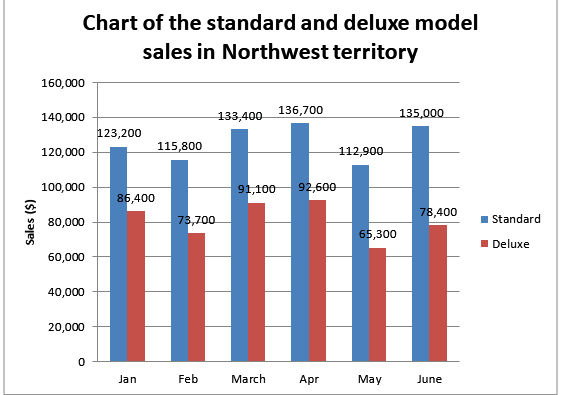
As the sales manager for Magnum Enterprises, you have been asked by the president to prepare the following charts for the shareholders' meeting next week. Use the six-month sales report, Table 21-1 on page 713, as the database for these charts. Calculate totals as required.
Comparative bar chart of the standard and deluxe model sales per month in the Northwest territory
Comparative bar chart of the standard and deluxe model sales per month in the Northwest territory

3
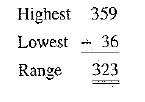
Determine the range of the following sets of values.
184 237 256 359 36 71
184 237 256 359 36 71
The range is a measure of dispersion equal to the difference between the
 in a set. It is used to measure the scope, or broadness of a set of data.
The given data set is
 .
.
To determine Range locate the
 in the given set

 After, locating the highest and lowest values, subtract them to get the range value
 So, the required range is
 .
.
in a set. It is used to measure the scope, or broadness of a set of data. The given data set is
.To determine Range locate the
in the given set After, locating the highest and lowest values, subtract them to get the range value So, the required range is . 4
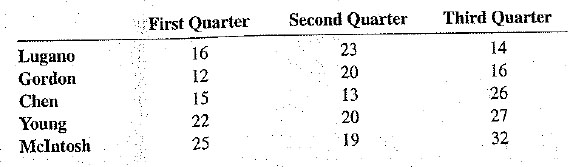
You arc the owner of The Green Machine, Inc., a. oar dealership specializing, in pre-owned hybrid automobiles. Yon have, a unique and motivating bonus plan for your salespeople that has worked well over the years.
Each quarter the mean number of cars sold is calculated. The first tune a salesperson sells more oars than the mean, lie or she earns a $100 bonus for each car over the mean in that quarter. If a salesperson exceeds the mean a second time in a year, the, bonus increases to $150 per car forthat Quarter. If a salesperson exceeds the mean three times in one year, the bonus is $200 per car for that quarter. If anyone exceeds the mean all four quarters, the fourth-quarter bonus is $300 per car. Remember, the bonus is paid only for the number of cars over the mean.
Each year the program starts over again. All bonuses are paid once per year, in January, forthe previous year. The following table represents, the number of hybrid cars sold by your five salespeople for each quarter last year. Calculate the bonus each person should receive for last year.
Each quarter the mean number of cars sold is calculated. The first tune a salesperson sells more oars than the mean, lie or she earns a $100 bonus for each car over the mean in that quarter. If a salesperson exceeds the mean a second time in a year, the, bonus increases to $150 per car forthat Quarter. If a salesperson exceeds the mean three times in one year, the bonus is $200 per car for that quarter. If anyone exceeds the mean all four quarters, the fourth-quarter bonus is $300 per car. Remember, the bonus is paid only for the number of cars over the mean.
Each year the program starts over again. All bonuses are paid once per year, in January, forthe previous year. The following table represents, the number of hybrid cars sold by your five salespeople for each quarter last year. Calculate the bonus each person should receive for last year.
Unlock Deck
Unlock for access to all 51 flashcards in this deck.
Unlock Deck
k this deck
5
As the sales manager for Magnum Enterprises, you have been asked by the president to prepare the following charts for the shareholders' meeting next week. Use the six-month sales report, Table 21-1 on page 713, as the database for these charts. Calculate totals as required.
Pie chart of the total six-month sales of the four territories
Pie chart of the total six-month sales of the four territories
Unlock Deck
Unlock for access to all 51 flashcards in this deck.
Unlock Deck
k this deck
6
Determine the range of the following sets of values.
48 42 54 28 112 76 95 27 36 11 96 196 191
48 42 54 28 112 76 95 27 36 11 96 196 191
Unlock Deck
Unlock for access to all 51 flashcards in this deck.
Unlock Deck
k this deck
7
When a bar chart is used to illustrate the relationship between two or more similar variables, it is known as a(n)________bar chart. When a bar chart is used to illustrate the parts of something that add to a total, it is known as a(n) _______bar chart. (21-3)
Unlock Deck
Unlock for access to all 51 flashcards in this deck.
Unlock Deck
k this deck
8
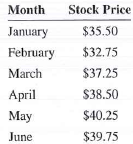
BUSINESS DECISION: CHOOSING A CHART
You have been asked to prepare a chart of stock prices for the upcoming semiannual stockholders' meeting for Magnum Enterprises. The following table shows Magnum's stock prices on the first day of each month. Choose and prepare a chart that best illustrates this information.
You have been asked to prepare a chart of stock prices for the upcoming semiannual stockholders' meeting for Magnum Enterprises. The following table shows Magnum's stock prices on the first day of each month. Choose and prepare a chart that best illustrates this information.
Unlock Deck
Unlock for access to all 51 flashcards in this deck.
Unlock Deck
k this deck
9
Determine the range of the following sets of values.
$2.35 $4.16 $3.42 $1.29 $8.9 $4.55
$2.35 $4.16 $3.42 $1.29 $8.9 $4.55
Unlock Deck
Unlock for access to all 51 flashcards in this deck.
Unlock Deck
k this deck
10
To construct a pie chart, we multiply each component's percentby ________degrees to determine how many degrees of the circle each component's slice will be. (21-4)
Unlock Deck
Unlock for access to all 51 flashcards in this deck.
Unlock Deck
k this deck
11
Calculate the mean of the following sets of values. Round to the nearest tenth when applicable.
5 7 21 46 35 2 19 7
5 7 21 46 35 2 19 7
Unlock Deck
Unlock for access to all 51 flashcards in this deck.
Unlock Deck
k this deck
12
Determine the range of the following sets of values.
1,099 887 1,669 1,217 2,969 790
1,099 887 1,669 1,217 2,969 790
Unlock Deck
Unlock for access to all 51 flashcards in this deck.
Unlock Deck
k this deck
13
A numerical value that is representative of a whole set of values is known as a(n)______. It is also known as the meanor the arithmetic mean. Write the formula for the mean of ungrouped data. (21-5)
Unlock Deck
Unlock for access to all 51 flashcards in this deck.
Unlock Deck
k this deck
14
Calculate the mean of the following sets of values. Round to the nearest tenth when applicable.
4 6 1 8 9 2 3 5 6 8 9 10
4 6 1 8 9 2 3 5 6 8 9 10
Unlock Deck
Unlock for access to all 51 flashcards in this deck.
Unlock Deck
k this deck
15
The following numbers represent the gallons of chocolate fudge syrup used per month by a Dairy Queen to make hot fudge sundaes.
a. What is the mean of this set of data
b. What is the median of this set of data
c. What is the mode of this set of data
d. What is the range of this set of data
a. What is the mean of this set of data
b. What is the median of this set of data
c. What is the mode of this set of data
d. What is the range of this set of data
Unlock Deck
Unlock for access to all 51 flashcards in this deck.
Unlock Deck
k this deck
16
The __________is the midpoint value of a set of data that is listed in ascending or descending order. Write a formula for this midpoint value when there is an even number of values in the data set. (21-6)
Unlock Deck
Unlock for access to all 51 flashcards in this deck.
Unlock Deck
k this deck
17
Calculate the mean of the following sets of values. Round to the nearest tenth when applicable.
324 553 179 213 423 336 190 440 382 111 329 111 397
324 553 179 213 423 336 190 440 382 111 329 111 397
Unlock Deck
Unlock for access to all 51 flashcards in this deck.
Unlock Deck
k this deck
18
You are the owner of The Dependable Delivery Service. Your company has four vehicles: a large and a small van and a large and a small truck. The following set of data represents the number of packages delivered last week.
a. What is the mean number of packages delivered for each van
b. What is the median number of packages delivered for each truck
c. What is the mean number of packages delivered on Monday
d. What is the median number of packages delivered on Thursday
e. What is the mode of all the packages delivered during the week
f. What is the range of all the packages delivered during the week
Unlock Deck
Unlock for access to all 51 flashcards in this deck.
Unlock Deck
k this deck
19
The _______ is the value or values in a set of data that occur most often. (21-7)
Unlock Deck
Unlock for access to all 51 flashcards in this deck.
Unlock Deck
k this deck
20
Calculate the mean of the following sets of values. Round to the nearest tenth when applicable.
4.87 4.32 5.43 6.3 7.25 5.13
4.87 4.32 5.43 6.3 7.25 5.13
Unlock Deck
Unlock for access to all 51 flashcards in this deck.
Unlock Deck
k this deck
21
You are the manager of a production plant that makes computer hard drives for Digital Storage Corporation. Last week your plant had the following production numbers during a 6-day production run:
2,300 2,430 2,018 2,540 2,675 4,8200
a. What is the mean, median, mode, and range of this set of production data
b. Which measure best describes the production at your plant Why
2,300 2,430 2,018 2,540 2,675 4,8200
a. What is the mean, median, mode, and range of this set of production data
b. Which measure best describes the production at your plant Why
Unlock Deck
Unlock for access to all 51 flashcards in this deck.
Unlock Deck
k this deck
22
The following data represent the monthly sales figure in thousands of dollars for the New York and California branches of universal Corporation.
a. Construct a multiple-line chart depicting the monthly sales for the two branches. Showthe New York branch as a solid line and the California branch as a dashed line.
b. Construct a comparative bar chart for the same data. Highlight the bars for each branch differently.
a. Construct a multiple-line chart depicting the monthly sales for the two branches. Showthe New York branch as a solid line and the California branch as a dashed line.
b. Construct a comparative bar chart for the same data. Highlight the bars for each branch differently.
Unlock Deck
Unlock for access to all 51 flashcards in this deck.
Unlock Deck
k this deck
23
The difference between the lowest and the highest values in a data set are known as the _________. This useful statistic isa measure of ____________ (21-8)
Unlock Deck
Unlock for access to all 51 flashcards in this deck.
Unlock Deck
k this deck
24
Determine the median of the following sets of values. Round to the nearest tenth when applicable.
Unlock Deck
Unlock for access to all 51 flashcards in this deck.
Unlock Deck
k this deck
25
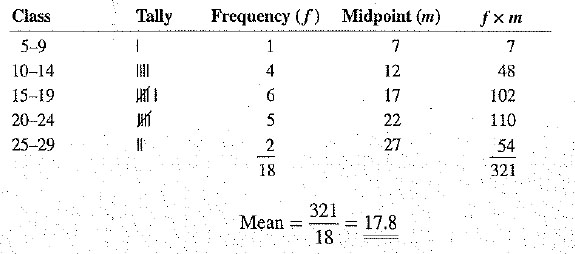
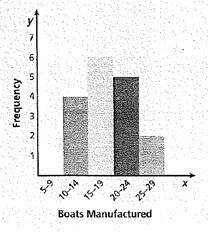
You are the vice president in charge of production for Endeavor Marine, Inc., a manufacturer of custom fishing boats. The following figures represent the number of boats manufactured during each of the past 18 months.
12 15 24 18 22 16 21 19 10 14 26 23 17 15 21 9 28 13
a. Group the data into five classes of equal size (5-9, 10-14, 15-19, 20-24, and 25-29) and construct a frequency distribution of the number of boats.
b. Calculate the mean of the grouped data by using 7, 12, 17, 22, and 27 as the midpoints. Round the mean to the nearest tenth if necessary.
C. Construct a histogram of these data to graphically illustrate your company's boat manufacturing figures.
Unlock Deck
Unlock for access to all 51 flashcards in this deck.
Unlock Deck
k this deck
26
The systematic process of collecting, interpreting, and presenting numerical data about business situations is known as business ______ (21-1)
Unlock Deck
Unlock for access to all 51 flashcards in this deck.
Unlock Deck
k this deck
27
When dealing with large amounts of data in a set, it is often easier to represent the data by dividing the values into equal-size groupsknown as _________. The chart obtained by this procedure isknown as a frequency __________or frequency table. (21-9)
Unlock Deck
Unlock for access to all 51 flashcards in this deck.
Unlock Deck
k this deck
28
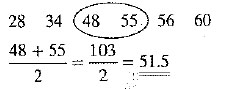
Determine the median of the following sets of values. Round to the nearest tenth when applicable.
56 34 28 60 48 55
56 34 28 60 48 55
Unlock Deck
Unlock for access to all 51 flashcards in this deck.
Unlock Deck
k this deck
29
You are the sales manager of the Esquire Sportswear Company. Last week your 30 salespeople reported the following automobile mileage while making sales calls to retail stores around the state:
a. Group the data into seven classes of equal size (0 99,100 199, 200 299,300 399, etc.) and construct a frequency distribution of the mileage.
b. Calculate the mean of the grouped data by using 49.5, 149.5, 249.5, etc., as the midpoints.
c. Using the grid provided below, prepare a histogram of these data to illustrate your salespeoples' mileage graphically.
Unlock Deck
Unlock for access to all 51 flashcards in this deck.
Unlock Deck
k this deck
30
Construct a pie chart from the following information compiled in a recent survey of the buying of children aged 8 to. 17.
Unlock Deck
Unlock for access to all 51 flashcards in this deck.
Unlock Deck
k this deck
31
Write the formula for the mean of grouped data. (21-10)
Unlock Deck
Unlock for access to all 51 flashcards in this deck.
Unlock Deck
k this deck
32
Determine the median of the following sets of values. Round to the nearest tenth when applicable.
57 38 29 82 71 90 11 94 26 18 18
57 38 29 82 71 90 11 94 26 18 18
Unlock Deck
Unlock for access to all 51 flashcards in this deck.
Unlock Deck
k this deck
33
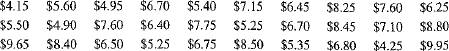
You are the owner of the Internet Cafe. As part of a marketing effort to increase the "average sale" per customer, you recently did a survey of the lunch-hour sales receipts for a busy Saturday. Following are the results of that survey.
a. Group the sales receipts into six classes of equal size ($4.00-$4.99, $5.00-$5.99, etc.) and construct a frequency distribution.
b. Calculate the mean of the grouped data.
c. Using the grid provided below, prepare a histogram of the sales receipts.
a. Group the sales receipts into six classes of equal size ($4.00-$4.99, $5.00-$5.99, etc.) and construct a frequency distribution.
b. Calculate the mean of the grouped data.
c. Using the grid provided below, prepare a histogram of the sales receipts.
Unlock Deck
Unlock for access to all 51 flashcards in this deck.
Unlock Deck
k this deck
34
Statistical procedures that deal with the collection, classification, summarization, and presentation of data are known as _________statistics. The process of arriving at conclusions, predictions, forecasts, or estimates based on a sample from a larger population is known as statistical________ (21-1)
Unlock Deck
Unlock for access to all 51 flashcards in this deck.
Unlock Deck
k this deck
35
________ is a special type of bar chart without space between the bars that is used to display the data from a frequency distribution. (21-11)
Unlock Deck
Unlock for access to all 51 flashcards in this deck.
Unlock Deck
k this deck
36
Determine the median of the following sets of values. Round to the nearest tenth when applicable.
$2.50 $3.25 $4.35 $1.22 $1.67 $4.59
$2.50 $3.25 $4.35 $1.22 $1.67 $4.59
Unlock Deck
Unlock for access to all 51 flashcards in this deck.
Unlock Deck
k this deck
37
Last month The Computer Connection sold $150,000 in desktop computers, $75,000 in notebook computers, $30,000 in software, $37,500 in printers, and $7,500 in accessories.
a. What percent of the total sales does each category of merchandise represent
b. Construct a. pie chart showing the -percentage breakdown of sales by merchandise category.
a. What percent of the total sales does each category of merchandise represent
b. Construct a. pie chart showing the -percentage breakdown of sales by merchandise category.
Unlock Deck
Unlock for access to all 51 flashcards in this deck.
Unlock Deck
k this deck
38
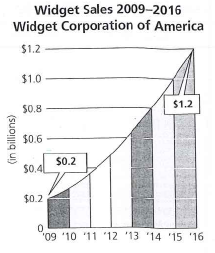
Use the line chart "Widget Sales 2009-2016" to answer the following questions.
a. What was the amount of widget sales in 2009
b. In what year did widget sales reach $0.8 billion
c. What does this line graph represent
d. What variables are represented on the x-axis and the y-axis
e. What was the amount of widget sales in 2015
f. In which year did sales reach $0.6 billion
g. Calculate how much greater widget sales were in 2016 compared with 2009.
Unlock Deck
Unlock for access to all 51 flashcards in this deck.
Unlock Deck
k this deck
39
Determine the median of the following sets of values. Round to the nearest tenth when applicable.
35% 51% 50% 23% 18% 67% 44% 52%
35% 51% 50% 23% 18% 67% 44% 52%
Unlock Deck
Unlock for access to all 51 flashcards in this deck.
Unlock Deck
k this deck
40
A collection of related data arranged for ease of reference or comparison, usually in parallel columns with meaningful titles, is known as a(n)______ (21-1)
Unlock Deck
Unlock for access to all 51 flashcards in this deck.
Unlock Deck
k this deck
41
As the sales manager for Magnum Enterprises, you have been asked by the president to prepare the following charts for the shareholders' meeting next week. Use the six-month sales report, Table 21-1 on page 713, as the database for these charts. Calculate totals as required.
Single-line chart of the total company sales per month
Single-line chart of the total company sales per month
Unlock Deck
Unlock for access to all 51 flashcards in this deck.
Unlock Deck
k this deck
42
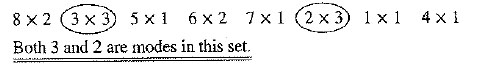
Determine the mode of the following sets of values.
8 3 5 6 3 7 2 1 8 2 4 3 6 2
8 3 5 6 3 7 2 1 8 2 4 3 6 2
Unlock Deck
Unlock for access to all 51 flashcards in this deck.
Unlock Deck
k this deck
43
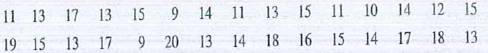
You have just been hired as the quality control manager for Pressure Point Manufacturing, a company producing fuel injection systems for General Motors, Ford, and Chrysler. Top management has requested a status report on the number of defective units produced each day. You decide to keep track of the number of defects each day for 30 days. Following are the results of your survey.
Pressure point Manufacturing Defects per day Survey-1
a. Find the mean, median, mode, and range of these data for your report to top management.
After implementing your suggestions for improved quality on the production line, you decide to survey the defects for another 30 days with the following results:
Pressure point ManufacturingDefects per daySurvey-2
b. Find the mean, median, mode, and range of the new data
c. If the company's cost to fix.each defective unit is $75, use the mean of each survey to calculate tire average cost per day for defects before and after your improvements
d. Theoretically, how much will your improvements save the company in a 300-day production year
e. Congratulations! The company has awarded you a bonus amounting to 15% of the first year's savings- How much is your bonus check
Pressure point Manufacturing Defects per day Survey-1
a. Find the mean, median, mode, and range of these data for your report to top management.
After implementing your suggestions for improved quality on the production line, you decide to survey the defects for another 30 days with the following results:
Pressure point ManufacturingDefects per daySurvey-2
b. Find the mean, median, mode, and range of the new data
c. If the company's cost to fix.each defective unit is $75, use the mean of each survey to calculate tire average cost per day for defects before and after your improvements
d. Theoretically, how much will your improvements save the company in a 300-day production year
e. Congratulations! The company has awarded you a bonus amounting to 15% of the first year's savings- How much is your bonus check
Unlock Deck
Unlock for access to all 51 flashcards in this deck.
Unlock Deck
k this deck
44
As the sales manager for Magnum Enterprises, you have been asked by the president to prepare the following charts for the shareholders' meeting next week. Use the six-month sales report, Table 21-1 on page 713, as the database for these charts. Calculate totals as required.
Multiple-line chart of the total sales per month of each model, standard and deluxe
Multiple-line chart of the total sales per month of each model, standard and deluxe
Unlock Deck
Unlock for access to all 51 flashcards in this deck.
Unlock Deck
k this deck
45
Determine the mode of the following sets of values.
21 57 46 21 34 76 43 68 21 76 18 12
21 57 46 21 34 76 43 68 21 76 18 12
Unlock Deck
Unlock for access to all 51 flashcards in this deck.
Unlock Deck
k this deck
46
______chart is a series of data points on a grid that are continuously connected by straight lines that display a picture of change occurring over a period of time. (21-2)
Unlock Deck
Unlock for access to all 51 flashcards in this deck.
Unlock Deck
k this deck
47
As the sales manager for Magnum Enterprises, you have been asked by the president to prepare the following charts for the shareholders' meeting next week. Use the six-month sales report, Table 21-1 on page 713, as the database for these charts. Calculate totals as required.
Standard bar chart of the deluxe sales per month in the Southeast territory
Standard bar chart of the deluxe sales per month in the Southeast territory
Unlock Deck
Unlock for access to all 51 flashcards in this deck.
Unlock Deck
k this deck
48
Determine the mode of the following sets of values.
$1,200 $7,300 $4,500 $3,450 $1,675
$1,200 $7,300 $4,500 $3,450 $1,675
Unlock Deck
Unlock for access to all 51 flashcards in this deck.
Unlock Deck
k this deck
49
You are the human resource director for Apollo Industries. Forty applicants for employment were given an assessment test in math and English with the following results:
a. What arc the range and mode of these scores
b. Group the 1 data into nine classes of equal size (11-20, 21-30, etc,) and construct a frequency distribution.
c. Calculate the mean of the grouped data by using 15.5, 25.5, etc., as the midpoints.
d. If company policy is to consider only those who score 10 points higher or better than the mean of the data, how many from this group arc still being considered for the job
e. Construct a histogram of the assessment test scores frequency distribution.
Unlock Deck
Unlock for access to all 51 flashcards in this deck.
Unlock Deck
k this deck
50
As the sales manager for Magnum Enterprises, you have been asked by the president to prepare the following charts for the shareholders' meeting next week. Use the six-month sales report, Table 21-1 on page 713, as the database for these charts. Calculate totals as required.
Component bar chart of the standard and deluxe model sales as components of total monthly sales in the Northeast territory
Component bar chart of the standard and deluxe model sales as components of total monthly sales in the Northeast territory
Unlock Deck
Unlock for access to all 51 flashcards in this deck.
Unlock Deck
k this deck
51
Determine the mode of the following sets of values.
4 9 3 5 4 7 1 9 9 4 7 1 8 1 4 6 7 4 6 9 9 2
4 9 3 5 4 7 1 9 9 4 7 1 8 1 4 6 7 4 6 9 9 2
Unlock Deck
Unlock for access to all 51 flashcards in this deck.
Unlock Deck
k this deck
Unlock Deck
Unlock for access to all 51 flashcards in this deck.


