Deck 4: Market Failures Caused by Externalities Asymmetric Information
Full screen (f)
Question
Question
Question
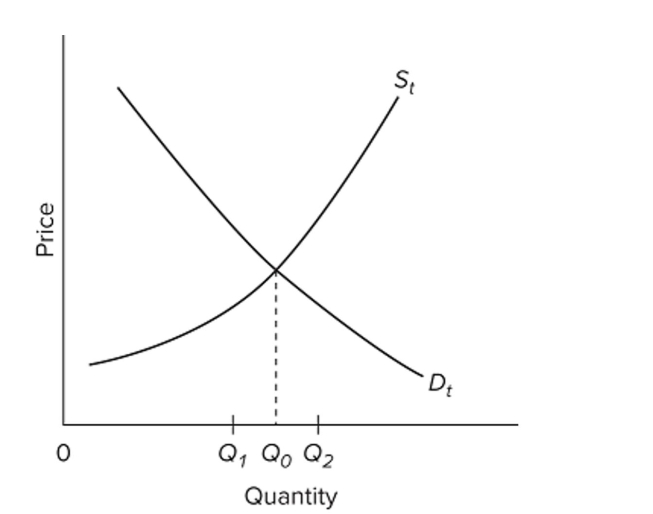
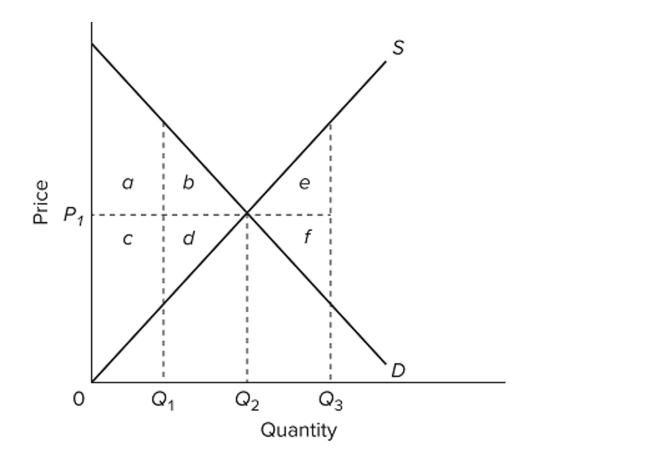 Refer to the diagram. The area that identifies the maximum sum of consumer surplus and producer surplus is
A) a + b + c + d + e + f.
B) c + d + f.
C) a + b + e.
D) a + b + c + d.
Question
Question
Question
 Refer to the diagram. Assuming equilibrium price P1, producer surplus is represented by areas
A) a + b.
B) a + b + c + d.
C) c + d.
D) a + c.
Question
Question
Question
 Refer to the diagram. Assuming equilibrium price P1, consumer surplus is represented by areas
A) a + b.
B) a + b + c + d.
C) c + d.
D) a + c.
Question
Question
 Refer to the diagram. If actual production and consumption occur at Q3,
A) efficiency is achieved.
B) an efficiency loss (or deadweight loss) of e + f occurs.
C) an efficiency loss (or deadweight loss) of a + b + c + d occurs.
D) an efficiency loss (or deadweight loss) of a + c occurs.
Question
Question
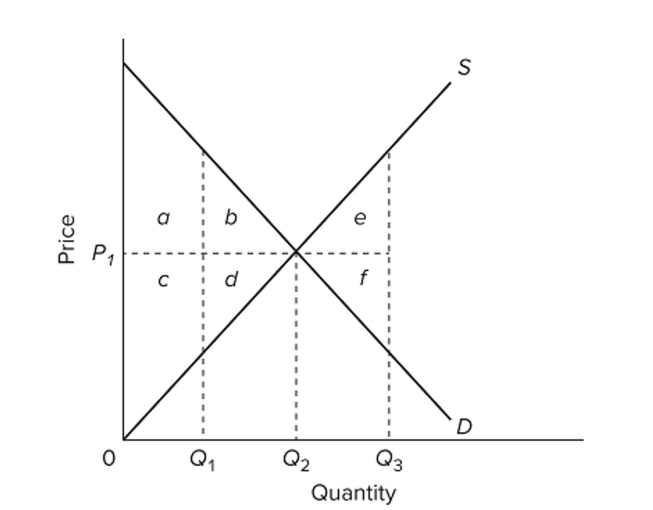 Refer to the diagram. Which of the following areas best represents the efficiency loss from underproduction?
A) a + c
B) e + f
C) a + b + c + d
D) b + d
Question
Question
Question
Question
Question
Question
 Refer to the diagram. If actual production and consumption occur at Q1,
A) efficiency is achieved.
B) consumer surplus is maximized.
C) an efficiency loss (or deadweight loss) of b + d occurs.
D) an efficiency loss (or deadweight loss) of e + d occurs.
Question
 Refer to the diagram. If actual production and consumption occur at Q2,
A) efficiency is achieved.
B) an efficiency loss (or deadweight loss) of a + b + c + d occurs.
C) an efficiency loss (or deadweight loss) of a + c occurs.
D) an efficiency loss (or deadweight loss) of e + f occurs.
Question
Question
Question
Question
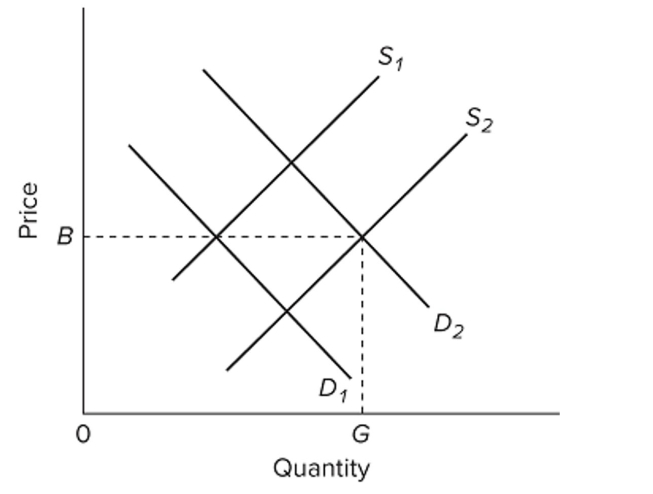
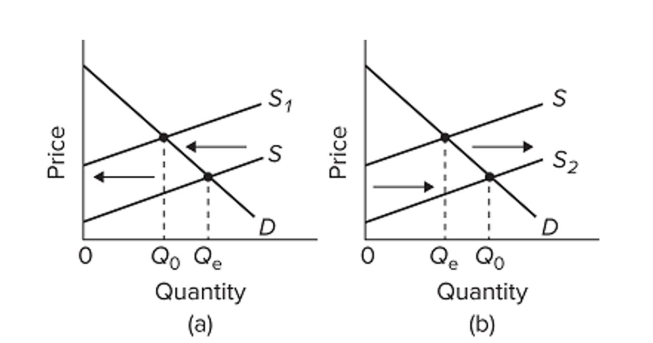 Refer to the diagrams for two separate product markets. Assume that society's optimal level of output in each market is Q0 and that government purposely shifts the market supply curve from S to
S1 in diagram (a) on the left and from S to S2 in diagram (b) on the right. The shift of the supply curve
From S to S2 in diagram (b) might be caused by a per-unit
A) subsidy paid to the producers of this product.
B) tax on the producers of this product.
C) subsidy paid to the buyers of this product.
D) tax on the buyers of this product.
Question
Question
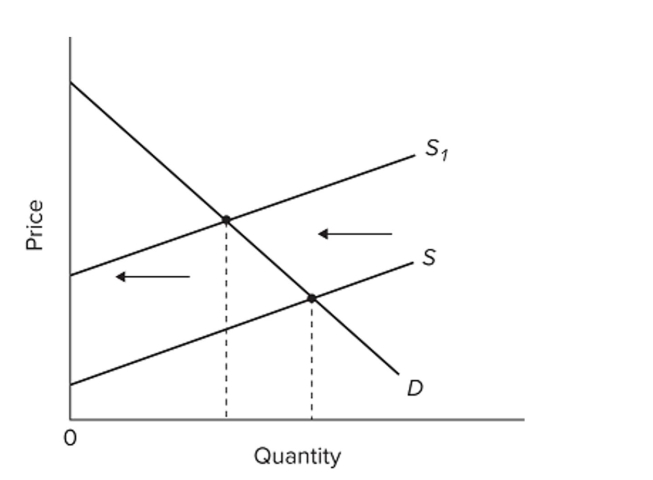
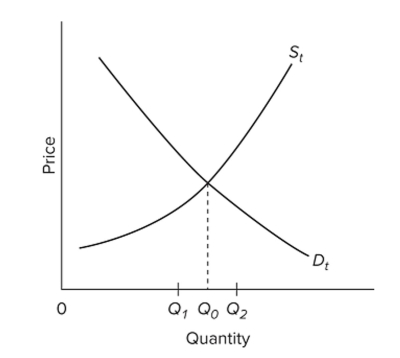 Refer to the diagram of the market for product X. Curve St embodies all costs (including externalities), and Dt embodies all benefits (including externalities) associated with the production
And consumption of X. Assuming the equilibrium output is Q2, we can conclude that the existence
Of external
A) costs has resulted in an overallocation of resources to X.
B) benefits has resulted in an overallocation of resources to X.
C) costs has resulted in an underallocation of resources to X.
D) benefits has resulted in an underallocation of resources to X.
Question
Question
Question
Question
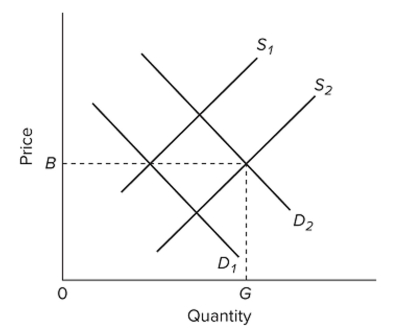 Refer to the competitive market diagram for product Z. Assume that the current market demand and supply curves for Z are D1 and S1. If there are substantial external benefits associated with the
Production of Z, then
A) government can improve the allocation of resources by subsidizing consumers of Z.
B) government can improve the allocation of resources by imposing a per-unit tax on Z.
C) a government subsidy for producers of Z would ensure that consumers are paying directly for all of the benefits they receive from Z.
D) consumers are paying too much for the good.
Question
 Refer to the competitive market diagram for product Z. Assume that the current market demand and supply curves for Z are D2 and S2. If there are substantial external costs associated with the
Production of Z, then
A) a price lower than B and an output greater than G would improve resource allocation.
B) government should levy a per-unit excise tax on Z to shift the demand curve to the right.
C) government should levy a per-unit excise tax on Z to shift the supply curve toward S1.
D) government should subsidize the production of Z to lower equilibrium price and increase equilibrium output.
Question
 Refer to the diagram of the market for product X. Curve St embodies all costs (including externalities), and Dt embodies all benefits (including externalities) associated with the production
And consumption of X. Assuming the market equilibrium output is Q1, we can conclude that the
Existence of external
A) costs has resulted in an overallocation of resources to X.
B) benefits has resulted in an overallocation of resources to X.
C) costs has resulted in an underallocation of resources to X.
D) benefits has resulted in an underallocation of resources to X.
Question
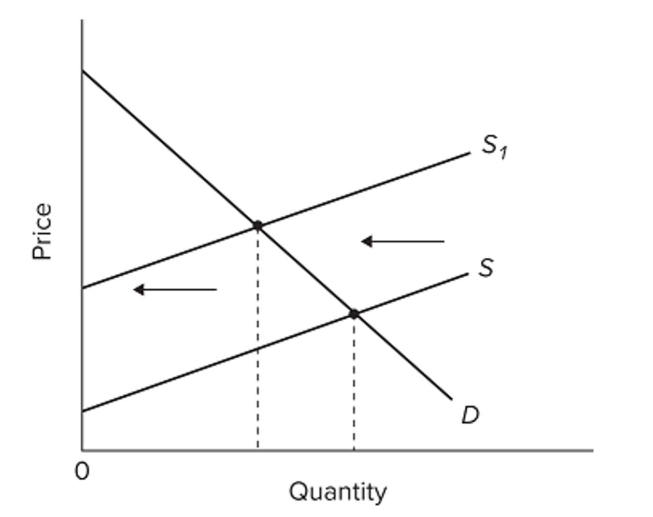 Refer to the diagram, in which S is the market supply curve and S1 is a supply curve comprising all costs of production, including external costs. Assume that the number of people affected by these
External costs is large. Without government interference, this market will reach
A) an optimal allocation of society's resources.
B) an underallocation of resources to this product.
C) an overallocation of resources to this product.
D) a higher price than is consistent with an optimal allocation of resources.
Question
Question
 Refer to the diagram, in which S is the market supply curve and S1 is a supply curve comprising all costs of production, including external costs. Assume that the number of people affected by these
External costs is large. If the government wishes to establish an optimal allocation of resources in
This market, it should
A) not intervene because the market outcome is optimal.
B) subsidize consumers so that the market demand curve shifts leftward.
C) subsidize producers so that the market supply curve shifts leftward.
D) tax producers so that the market supply curve shifts leftward.
Question
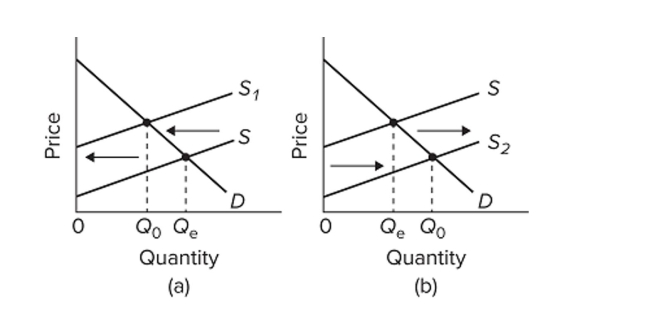 Refer to the diagrams for two separate product markets. Assume that society's optimal level of output in each market is Q0 and that government purposely shifts the market supply curve from S to
S1 in diagram (a) on the left and from S to S2 in diagram (b) on the right. We can conclude that the
Government is correcting for
A) negative externalities in diagram (a) and positive externalities in diagram (b).
B) positive externalities in diagram (a) and negative externalities in diagram (b).
C) negative externalities in both diagrams.
D) positive externalities in both diagrams.
Question
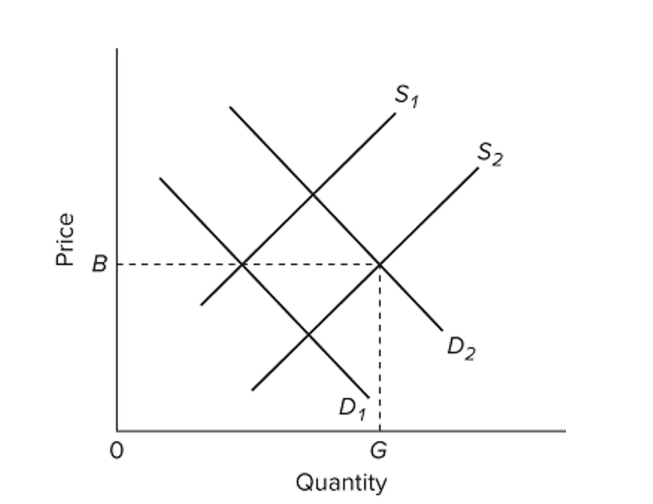 Refer to the competitive market diagram for product Z. Assume that the current market demand and supply curves for Z are D2 and S2. If there are substantial external benefits associated with the
Production of Z, then
A) efficient resource allocation occurs at output G and price B because the market mechanism does not measure all benefits.
B) an output smaller than G would improve resource allocation.
C) government should levy a per-unit excise tax on Z to shift the demand curve toward D1.
D) an output greater than G would result in a more efficient allocation of resources.
Question
Question
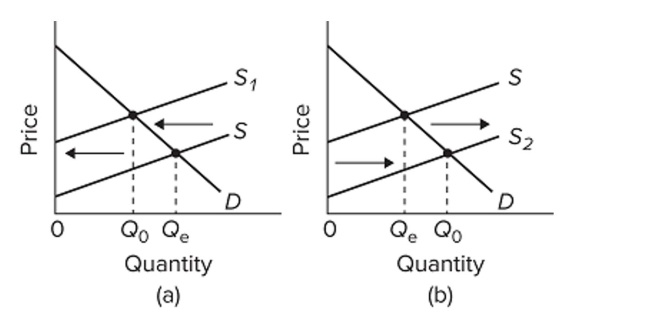 Refer to the diagrams for two separate product markets. Assume that society's optimal level of output in each market is Q0 and that government purposely shifts the market supply curve from S to
S1 in diagram (a) on the left and from S to S2 in diagram (b) on the right. The shift of the supply curve
From S to S1 in diagram (a) might be caused by a per-unit
A) subsidy paid to the producers of this product.
B) tax on the producers of this product.
C) subsidy paid to the buyers of this product.
D) tax on the buyers of this product.
Question
Question
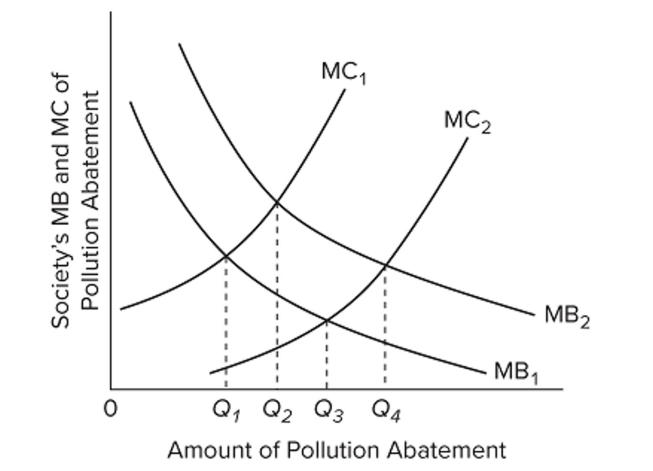 The MB curves in the diagram slope downward because of the law of
A) conservation of matter and energy.
B) diminishing returns.
C) diminishing marginal utility.
D) increasing cost.
Question
Question
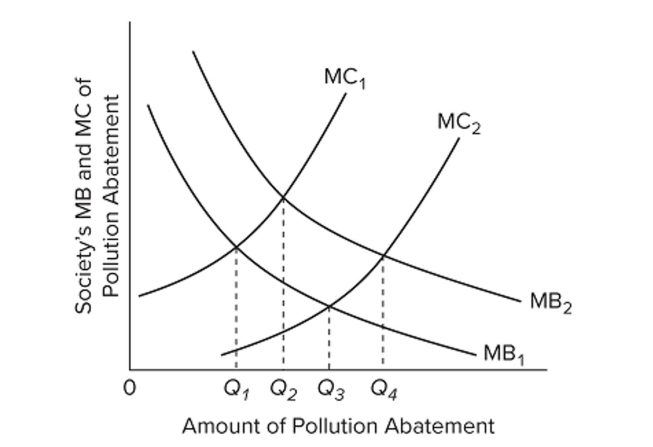 Refer to the diagram. From society's perspective, if MB1 and MC2 are relevant,
A) Q2 represents too little pollution abatement.
B) Q1 represents too much pollution abatement.
C) Q2 represents an optimal amount of pollution abatement.
D) Q4 represents too little pollution abatement.
Question
Question
Question
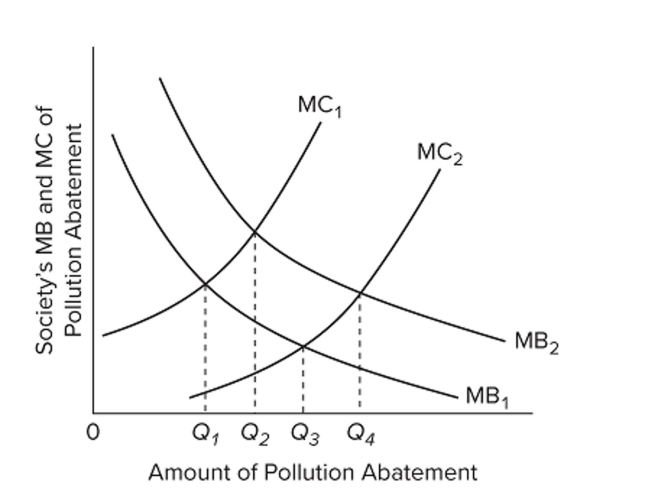 The MC curves in the diagram slope upward because of the law of
A) demand.
B) conservation of matter and energy.
C) diminishing marginal utility.
D) diminishing returns.
Question
Question
Question
Question
Question
Question
Question
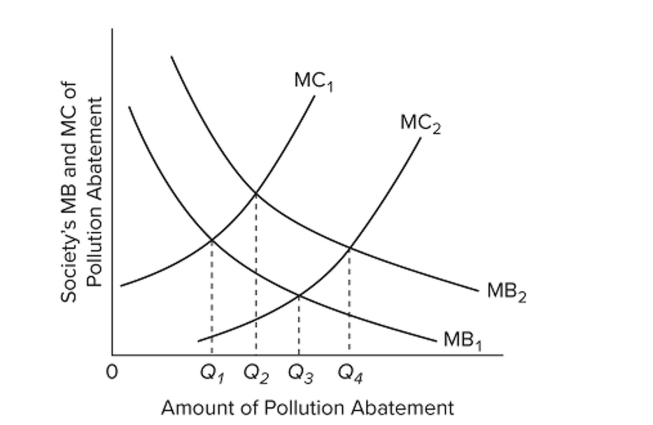 Refer to the diagram. From society's perspective, if MB2 and MC1 are relevant,
A) Q4 represents too little pollution abatement.
B) Q1 represents too little pollution abatement.
C) Q3 represents an optimal amount of pollution abatement.
D) Q2 represents too little pollution abatement.
Question
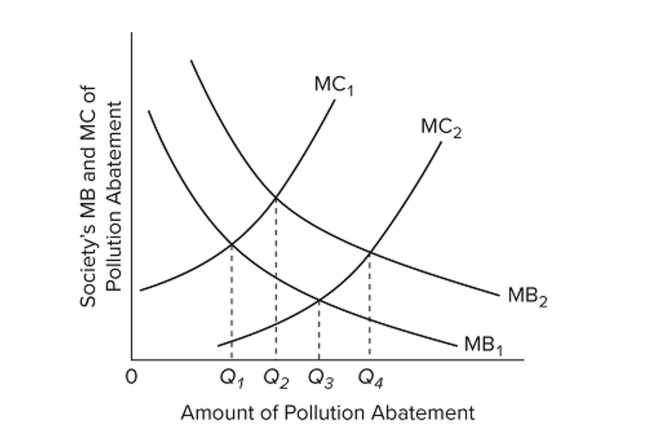 Refer to the diagram. With MB1 and MC1, society's optimal amount of pollution abatement is
A) Q1.
B) Q2.
C) Q3.
D) Q4.
Question
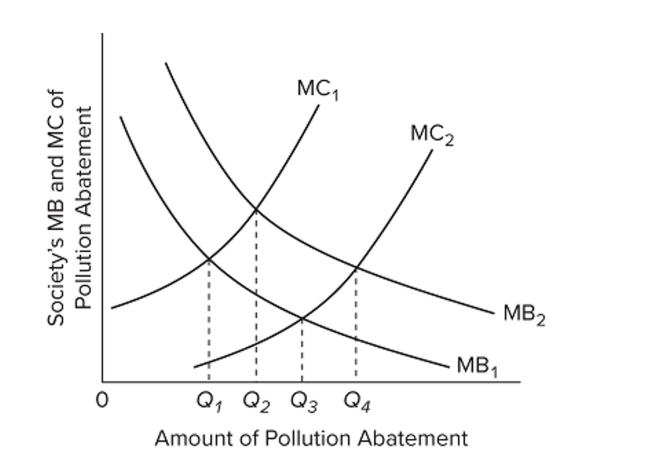 Refer to the diagram. Which one of the following might shift the marginal cost curve from MC1 to MC2?
A) major new studies strongly linking cancer to pollution
B) improved technology for reducing pollution
C) a change in consumer tastes from services to manufactured goods
D) an increase in the price of recycled goods
Question
Question
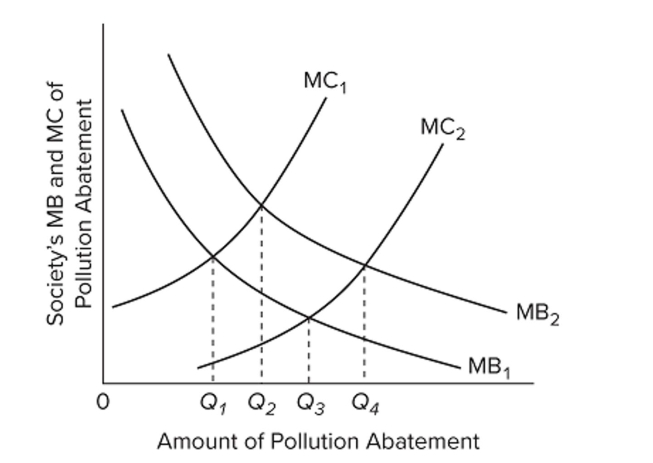 Refer to the diagram. Which one of the following might shift the marginal benefit curve from MB1 to MB2?
A) major new studies strongly linking cancer to pollution
B) improved technology for reducing pollution
C) a change in consumer tastes from manufactured goods to services
D) a decrease in the price of recycled goods
Question
Question
Question
Question
Question
Question
Question
Question
Question
Question
Question
Question
Question
Question
Question
Question
Question
Question
Question
Question
Question
Question
Question

Unlock Deck
Sign up to unlock the cards in this deck!
Unlock Deck
Unlock Deck
1/222
Play
Full screen (f)
Deck 4: Market Failures Caused by Externalities Asymmetric Information
1
Graphically, if the supply and demand curves are linear, consumer surplus is measured as the triangle
A) under the demand curve and below the actual price.
B) under the demand curve and above the actual price.
C) above the supply curve and above the actual price.
D) above the supply curve and below the actual price.
A) under the demand curve and below the actual price.
B) under the demand curve and above the actual price.
C) above the supply curve and above the actual price.
D) above the supply curve and below the actual price.
under the demand curve and above the actual price.
2
Market failures
A) are only a concern when they result in prices that are too high.
B) apply exclusively to situations where markets do not produce any of an economically desirable good.
C) result in overproduction or underproduction of a good.
D) result from government interference in markets.
A) are only a concern when they result in prices that are too high.
B) apply exclusively to situations where markets do not produce any of an economically desirable good.
C) result in overproduction or underproduction of a good.
D) result from government interference in markets.
result in overproduction or underproduction of a good.
3
Refer to the diagram. The area that identifies the maximum sum of consumer surplus and producer surplus isA) a + b + c + d + e + f.
B) c + d + f.
C) a + b + e.
D) a + b + c + d.
a + b + c + d.
4
Other things equal, a fall in the market price caused by a change in supply will
A) increase consumer surplus.
B) decrease consumer surplus.
C) increase producer surplus while leaving consumer surplus unchanged.
D) decrease producer surplus while leaving consumer surplus unchanged.
A) increase consumer surplus.
B) decrease consumer surplus.
C) increase producer surplus while leaving consumer surplus unchanged.
D) decrease producer surplus while leaving consumer surplus unchanged.
Unlock Deck
Unlock for access to all 222 flashcards in this deck.
Unlock Deck
k this deck
5
Consumer surplus
A) is the difference between the maximum prices consumers are willing to pay for a product and the lower equilibrium price.
B) is the difference between the maximum prices consumers are willing to pay for a product and the minimum prices producers are willing to accept.
C) is the difference between the minimum prices producers are willing to accept for a product and the higher equilibrium price.
D) rises as equilibrium price rises.
Unlock Deck
Unlock for access to all 222 flashcards in this deck.
Unlock Deck
k this deck
6
Refer to the diagram. Assuming equilibrium price P1, producer surplus is represented by areasA) a + b.
B) a + b + c + d.
C) c + d.
D) a + c.
Unlock Deck
Unlock for access to all 222 flashcards in this deck.
Unlock Deck
k this deck
7
Producer surplus is the difference between
A) the maximum prices consumers are willing to pay for a product and the lower equilibrium price.
B) the quantity supplied and quantity demanded at an above equilibrium price.
C) the minimum prices producers are willing to accept for a product and the higher equilibrium price.
D) the maximum prices consumers are willing to pay for a product and the minimum prices producers are willing to accept.
Unlock Deck
Unlock for access to all 222 flashcards in this deck.
Unlock Deck
k this deck
8
Allocative efficiency occurs only at that output where
A) marginal benefit exceeds marginal cost by the greatest amount.
B) consumer surplus exceeds producer surplus by the greatest amount.
C) the combined amounts of consumer surplus and producer surplus are maximized.
D) the areas of consumer and producer surplus are equal.
A) marginal benefit exceeds marginal cost by the greatest amount.
B) consumer surplus exceeds producer surplus by the greatest amount.
C) the combined amounts of consumer surplus and producer surplus are maximized.
D) the areas of consumer and producer surplus are equal.
Unlock Deck
Unlock for access to all 222 flashcards in this deck.
Unlock Deck
k this deck
9
Refer to the diagram. Assuming equilibrium price P1, consumer surplus is represented by areasA) a + b.
B) a + b + c + d.
C) c + d.
D) a + c.
Unlock Deck
Unlock for access to all 222 flashcards in this deck.
Unlock Deck
k this deck
10
Graphically, producer surplus is measured as the area
A) under the demand curve and below the actual price.
B) under the demand curve and above the actual price.
C) above the supply curve and above the actual price.
D) above the supply curve and below the actual price.
A) under the demand curve and below the actual price.
B) under the demand curve and above the actual price.
C) above the supply curve and above the actual price.
D) above the supply curve and below the actual price.
Unlock Deck
Unlock for access to all 222 flashcards in this deck.
Unlock Deck
k this deck
11
Refer to the diagram. If actual production and consumption occur at Q3,A) efficiency is achieved.
B) an efficiency loss (or deadweight loss) of e + f occurs.
C) an efficiency loss (or deadweight loss) of a + b + c + d occurs.
D) an efficiency loss (or deadweight loss) of a + c occurs.
Unlock Deck
Unlock for access to all 222 flashcards in this deck.
Unlock Deck
k this deck
12
Amanda buys a ruby for $330 for which she was willing to pay $340. The minimum acceptable price to the seller, Tony, was $140. Amanda experiences
A) a consumer surplus of $10, and Tony experiences a producer surplus of $190.
B) a producer surplus of $200, and Tony experiences a consumer surplus of $10.
C) a consumer surplus of $670, and Tony experiences a producer surplus of $200.
D) a producer surplus of $10, and Tony experiences a consumer surplus of $190.
Unlock Deck
Unlock for access to all 222 flashcards in this deck.
Unlock Deck
k this deck
13
Refer to the diagram. Which of the following areas best represents the efficiency loss from underproduction?A) a + c
B) e + f
C) a + b + c + d
D) b + d
Unlock Deck
Unlock for access to all 222 flashcards in this deck.
Unlock Deck
k this deck
14
What two conditions must hold for a competitive market to produce efficient outcomes?
A) Demand curves must reflect all costs of production, and supply curves must reflect consumers' full willingness to pay.
B) Supply curves must reflect all costs of production, and demand curves must reflect consumers' full willingness to pay.
C) Firms must minimize production costs, and consumers must minimize total expenditures.
D) Firms must maximize profits, and consumers must all pay prices equal to their maximum willingness to pay.
Unlock Deck
Unlock for access to all 222 flashcards in this deck.
Unlock Deck
k this deck
15
Market failure is said to occur whenever
A) competitive markets do not allocate resources in the most economically desirable way.
B) prices rise.
C) some consumers who want a good do not obtain it because the price is higher than they are willing to pay.
D) government intervenes in the functioning of competitive markets.
A) competitive markets do not allocate resources in the most economically desirable way.
B) prices rise.
C) some consumers who want a good do not obtain it because the price is higher than they are willing to pay.
D) government intervenes in the functioning of competitive markets.
Unlock Deck
Unlock for access to all 222 flashcards in this deck.
Unlock Deck
k this deck
16
A producer's minimum acceptable price for a particular unit of a good
A) is the same for all units of the good.
B) will, for most units produced, equal the maximum that consumers are willing to pay for the good.
C) equals the marginal cost of producing that particular unit.
D) must cover the wages, rent, and interest payments necessary to produce the good but need not include profit.
Unlock Deck
Unlock for access to all 222 flashcards in this deck.
Unlock Deck
k this deck
17
If the demand curve reflects consumers' full willingness to pay, and the supply curve reflects all costs of production, then which of the following is true?
A) The benefit surpluses shared between consumers and producers will be maximized.
B) The benefit surpluses received by consumers and producers will be equal.
C) There will be no consumer or producer surplus.
D) Consumer surplus will be maximized, and producer surplus will be minimized.
A) The benefit surpluses shared between consumers and producers will be maximized.
B) The benefit surpluses received by consumers and producers will be equal.
C) There will be no consumer or producer surplus.
D) Consumer surplus will be maximized, and producer surplus will be minimized.
Unlock Deck
Unlock for access to all 222 flashcards in this deck.
Unlock Deck
k this deck
18
Jennifer buys a piece of costume jewelry for $33, for which she was willing to pay $42. The minimum acceptable price to the seller, Nathan, was $30. Jennifer experiences a
A) a consumer surplus of $12, and Nathan experiences a producer surplus of $3.
B) a producer surplus of $9, and Nathan experiences a consumer surplus of $3.
C) a consumer surplus of $9, and Nathan experiences a producer surplus of $3.
D) a producer surplus of $9, and Nathan experiences a producer surplus of $12.
Unlock Deck
Unlock for access to all 222 flashcards in this deck.
Unlock Deck
k this deck
19
Refer to the diagram. If actual production and consumption occur at Q1,A) efficiency is achieved.
B) consumer surplus is maximized.
C) an efficiency loss (or deadweight loss) of b + d occurs.
D) an efficiency loss (or deadweight loss) of e + d occurs.
Unlock Deck
Unlock for access to all 222 flashcards in this deck.
Unlock Deck
k this deck
20
Refer to the diagram. If actual production and consumption occur at Q2,A) efficiency is achieved.
B) an efficiency loss (or deadweight loss) of a + b + c + d occurs.
C) an efficiency loss (or deadweight loss) of a + c occurs.
D) an efficiency loss (or deadweight loss) of e + f occurs.
Unlock Deck
Unlock for access to all 222 flashcards in this deck.
Unlock Deck
k this deck
21
An efficiency loss (or deadweight loss)
A) is measured as the combined loss of consumer surplus and producer surplus from over- or underproducing.
B) results from producing a unit of output for which the maximum willingness to pay exceeds the minimum acceptable price.
C) can result from underproduction, but not from overproduction.
D) can result from overproduction, but not from underproduction.
Unlock Deck
Unlock for access to all 222 flashcards in this deck.
Unlock Deck
k this deck
22
At the output where the combined amounts of consumer and producer surplus are largest,
A) the areas of consumer and producer surplus necessarily are equal.
B) the maximum willingness to pay for the last unit of output equals the minimum acceptable price of that unit of output.
C) consumer surplus exceeds producer surplus by the greatest amount.
D) marginal benefit exceeds marginal cost by the greatest amount.
Unlock Deck
Unlock for access to all 222 flashcards in this deck.
Unlock Deck
k this deck
23
A positive externality or spillover benefit occurs when
A) product differentiation increases the variety of products available to consumers.
B) the benefits associated with a product exceed those accruing to people who consume it.
C) a firm does not bear all of the costs of producing a good or service.
D) firms earn positive economic profits.
A) product differentiation increases the variety of products available to consumers.
B) the benefits associated with a product exceed those accruing to people who consume it.
C) a firm does not bear all of the costs of producing a good or service.
D) firms earn positive economic profits.
Unlock Deck
Unlock for access to all 222 flashcards in this deck.
Unlock Deck
k this deck
24
Refer to the diagrams for two separate product markets. Assume that society's optimal level of output in each market is Q0 and that government purposely shifts the market supply curve from S toS1 in diagram (a) on the left and from S to S2 in diagram (b) on the right. The shift of the supply curve
From S to S2 in diagram (b) might be caused by a per-unit
A) subsidy paid to the producers of this product.
B) tax on the producers of this product.
C) subsidy paid to the buyers of this product.
D) tax on the buyers of this product.
Unlock Deck
Unlock for access to all 222 flashcards in this deck.
Unlock Deck
k this deck
25
Which of the following conditions does not need to occur for a market to achieve allocative efficiency?
A) Consumers' maximum willingness to pay equals producers' minimum acceptable price for the last unit of output.
B) The sum of producer and consumer surplus is maximized.
C) The total revenue received by producers equals the total cost of production.
D) The marginal benefit of the last unit produced equals the marginal cost of producing that unit.
Unlock Deck
Unlock for access to all 222 flashcards in this deck.
Unlock Deck
k this deck
26
Refer to the diagram of the market for product X. Curve St embodies all costs (including externalities), and Dt embodies all benefits (including externalities) associated with the productionAnd consumption of X. Assuming the equilibrium output is Q2, we can conclude that the existence
Of external
A) costs has resulted in an overallocation of resources to X.
B) benefits has resulted in an overallocation of resources to X.
C) costs has resulted in an underallocation of resources to X.
D) benefits has resulted in an underallocation of resources to X.
Unlock Deck
Unlock for access to all 222 flashcards in this deck.
Unlock Deck
k this deck
27
An efficiency loss (or deadweight loss) declines in size when a unit of output is produced for which
A) marginal cost exceeds marginal benefit.
B) maximum willingness to pay exceeds minimum acceptable price.
C) consumer surplus exceeds producer surplus.
D) producer surplus exceeds consumer surplus.
A) marginal cost exceeds marginal benefit.
B) maximum willingness to pay exceeds minimum acceptable price.
C) consumer surplus exceeds producer surplus.
D) producer surplus exceeds consumer surplus.
Unlock Deck
Unlock for access to all 222 flashcards in this deck.
Unlock Deck
k this deck
28
At the output level defining allocative efficiency,
A) the areas of consumer and producer surplus necessarily are equal.
B) marginal benefit exceeds marginal cost by the greatest amount.
C) consumer surplus exceeds producer surplus by the greatest amount.
D) the maximum willingness to pay for the last unit of output equals the minimum acceptable price of that unit of output.
Unlock Deck
Unlock for access to all 222 flashcards in this deck.
Unlock Deck
k this deck
29
If a good that generates positive externalities was produced and priced to take into account these spillover benefits, then its
A) price and output would increase.
B) output would increase, but price would remain constant.
C) price would increase and output would decrease.
D) price would increase, but output would remain constant.
A) price and output would increase.
B) output would increase, but price would remain constant.
C) price would increase and output would decrease.
D) price would increase, but output would remain constant.
Unlock Deck
Unlock for access to all 222 flashcards in this deck.
Unlock Deck
k this deck
30
Refer to the competitive market diagram for product Z. Assume that the current market demand and supply curves for Z are D1 and S1. If there are substantial external benefits associated with theProduction of Z, then
A) government can improve the allocation of resources by subsidizing consumers of Z.
B) government can improve the allocation of resources by imposing a per-unit tax on Z.
C) a government subsidy for producers of Z would ensure that consumers are paying directly for all of the benefits they receive from Z.
D) consumers are paying too much for the good.
Unlock Deck
Unlock for access to all 222 flashcards in this deck.
Unlock Deck
k this deck
31
Refer to the competitive market diagram for product Z. Assume that the current market demand and supply curves for Z are D2 and S2. If there are substantial external costs associated with theProduction of Z, then
A) a price lower than B and an output greater than G would improve resource allocation.
B) government should levy a per-unit excise tax on Z to shift the demand curve to the right.
C) government should levy a per-unit excise tax on Z to shift the supply curve toward S1.
D) government should subsidize the production of Z to lower equilibrium price and increase equilibrium output.
Unlock Deck
Unlock for access to all 222 flashcards in this deck.
Unlock Deck
k this deck
32
Refer to the diagram of the market for product X. Curve St embodies all costs (including externalities), and Dt embodies all benefits (including externalities) associated with the productionAnd consumption of X. Assuming the market equilibrium output is Q1, we can conclude that the
Existence of external
A) costs has resulted in an overallocation of resources to X.
B) benefits has resulted in an overallocation of resources to X.
C) costs has resulted in an underallocation of resources to X.
D) benefits has resulted in an underallocation of resources to X.
Unlock Deck
Unlock for access to all 222 flashcards in this deck.
Unlock Deck
k this deck
33
Refer to the diagram, in which S is the market supply curve and S1 is a supply curve comprising all costs of production, including external costs. Assume that the number of people affected by theseExternal costs is large. Without government interference, this market will reach
A) an optimal allocation of society's resources.
B) an underallocation of resources to this product.
C) an overallocation of resources to this product.
D) a higher price than is consistent with an optimal allocation of resources.
Unlock Deck
Unlock for access to all 222 flashcards in this deck.
Unlock Deck
k this deck
34
A negative externality or spillover cost occurs when
A) firms fail to achieve allocative efficiency.
B) firms fail to achieve productive efficiency.
C) the price of a good exceeds the marginal cost of producing it.
D) the total cost of producing a good exceeds the costs borne by the producer.
A) firms fail to achieve allocative efficiency.
B) firms fail to achieve productive efficiency.
C) the price of a good exceeds the marginal cost of producing it.
D) the total cost of producing a good exceeds the costs borne by the producer.
Unlock Deck
Unlock for access to all 222 flashcards in this deck.
Unlock Deck
k this deck
35
Refer to the diagram, in which S is the market supply curve and S1 is a supply curve comprising all costs of production, including external costs. Assume that the number of people affected by theseExternal costs is large. If the government wishes to establish an optimal allocation of resources in
This market, it should
A) not intervene because the market outcome is optimal.
B) subsidize consumers so that the market demand curve shifts leftward.
C) subsidize producers so that the market supply curve shifts leftward.
D) tax producers so that the market supply curve shifts leftward.
Unlock Deck
Unlock for access to all 222 flashcards in this deck.
Unlock Deck
k this deck
36
Refer to the diagrams for two separate product markets. Assume that society's optimal level of output in each market is Q0 and that government purposely shifts the market supply curve from S toS1 in diagram (a) on the left and from S to S2 in diagram (b) on the right. We can conclude that the
Government is correcting for
A) negative externalities in diagram (a) and positive externalities in diagram (b).
B) positive externalities in diagram (a) and negative externalities in diagram (b).
C) negative externalities in both diagrams.
D) positive externalities in both diagrams.
Unlock Deck
Unlock for access to all 222 flashcards in this deck.
Unlock Deck
k this deck
37
Refer to the competitive market diagram for product Z. Assume that the current market demand and supply curves for Z are D2 and S2. If there are substantial external benefits associated with theProduction of Z, then
A) efficient resource allocation occurs at output G and price B because the market mechanism does not measure all benefits.
B) an output smaller than G would improve resource allocation.
C) government should levy a per-unit excise tax on Z to shift the demand curve toward D1.
D) an output greater than G would result in a more efficient allocation of resources.
Unlock Deck
Unlock for access to all 222 flashcards in this deck.
Unlock Deck
k this deck
38
Pigovian taxes
A) are used to correct negative externalities.
B) are used to correct positive externalities.
C) are primarily designed to fund government.
D) are a form of income tax.
A) are used to correct negative externalities.
B) are used to correct positive externalities.
C) are primarily designed to fund government.
D) are a form of income tax.
Unlock Deck
Unlock for access to all 222 flashcards in this deck.
Unlock Deck
k this deck
39
Refer to the diagrams for two separate product markets. Assume that society's optimal level of output in each market is Q0 and that government purposely shifts the market supply curve from S toS1 in diagram (a) on the left and from S to S2 in diagram (b) on the right. The shift of the supply curve
From S to S1 in diagram (a) might be caused by a per-unit
A) subsidy paid to the producers of this product.
B) tax on the producers of this product.
C) subsidy paid to the buyers of this product.
D) tax on the buyers of this product.
Unlock Deck
Unlock for access to all 222 flashcards in this deck.
Unlock Deck
k this deck
40
Suppose that the Anytown city government asks private citizens to donate money to support the town's annual holiday lighting display. Assuming that the citizens of Anytown enjoy the lighting
Display, the request for donations suggests that
A) the display creates negative externalities.
B) government should tax the producers of holiday lighting.
C) resources are currently overallocated to the provision of holiday lighting in Anytown.
D) resources are currently underallocated to the provision of holiday lighting in Anytown.
Unlock Deck
Unlock for access to all 222 flashcards in this deck.
Unlock Deck
k this deck
41
The MB curves in the diagram slope downward because of the law ofA) conservation of matter and energy.
B) diminishing returns.
C) diminishing marginal utility.
D) increasing cost.
Unlock Deck
Unlock for access to all 222 flashcards in this deck.
Unlock Deck
k this deck
42
(Last Word) A cap-and-trade program
A) assigns a property right to the atmosphere.
B) mandates that every firm individually cut its emissions to below a certain level.
C) assigns a property right to polluting the atmosphere.
D) is easy to establish and enforce.
A) assigns a property right to the atmosphere.
B) mandates that every firm individually cut its emissions to below a certain level.
C) assigns a property right to polluting the atmosphere.
D) is easy to establish and enforce.
Unlock Deck
Unlock for access to all 222 flashcards in this deck.
Unlock Deck
k this deck
43
Refer to the diagram. From society's perspective, if MB1 and MC2 are relevant,A) Q2 represents too little pollution abatement.
B) Q1 represents too much pollution abatement.
C) Q2 represents an optimal amount of pollution abatement.
D) Q4 represents too little pollution abatement.
Unlock Deck
Unlock for access to all 222 flashcards in this deck.
Unlock Deck
k this deck
44
The socially optimal amount of pollution abatement occurs where society's marginal
A) benefit of abatement exceeds its marginal cost of abatement by the greatest amount.
B) benefit of abatement equals its marginal cost of abatement.
C) benefit of abatement is zero.
D) cost of abatement is at its maximum.
A) benefit of abatement exceeds its marginal cost of abatement by the greatest amount.
B) benefit of abatement equals its marginal cost of abatement.
C) benefit of abatement is zero.
D) cost of abatement is at its maximum.
Unlock Deck
Unlock for access to all 222 flashcards in this deck.
Unlock Deck
k this deck
45
Along a demand curve, product price and consumer surplus are inversely related.
Unlock Deck
Unlock for access to all 222 flashcards in this deck.
Unlock Deck
k this deck
46
The MC curves in the diagram slope upward because of the law ofA) demand.
B) conservation of matter and energy.
C) diminishing marginal utility.
D) diminishing returns.
Unlock Deck
Unlock for access to all 222 flashcards in this deck.
Unlock Deck
k this deck
47
The marginal cost to society of reducing pollution rises with increases in pollution abatement because of the law of
A) diminishing marginal utility.
B) conservation of matter and energy.
C) demand.
D) diminishing returns.
A) diminishing marginal utility.
B) conservation of matter and energy.
C) demand.
D) diminishing returns.
Unlock Deck
Unlock for access to all 222 flashcards in this deck.
Unlock Deck
k this deck
48
Society's optimal amount of pollution abatement is where society's marginal benefit of abatement is
zero.
zero.
Unlock Deck
Unlock for access to all 222 flashcards in this deck.
Unlock Deck
k this deck
49
The marginal benefit to society of reducing pollution declines with increases in pollution abatement because of the law of
A) increasing costs.
B) diminishing returns.
C) diminishing marginal utility.
D) conservation of matter and energy.
A) increasing costs.
B) diminishing returns.
C) diminishing marginal utility.
D) conservation of matter and energy.
Unlock Deck
Unlock for access to all 222 flashcards in this deck.
Unlock Deck
k this deck
50
Allocative efficiency occurs where (for the last unit) maximum willingness to pay exceeds minimum
acceptable price by the greatest amount.
acceptable price by the greatest amount.
Unlock Deck
Unlock for access to all 222 flashcards in this deck.
Unlock Deck
k this deck
51
(Consider This) Darcy and Rachel live down the hall from each other in the same dorm. Darcy likes to play her music loudly down the hall, and Rachel finds the music annoying. A Coase theorem
Solution for this problem would be for
A) Darcy and Rachel to negotiate a mutually agreeable level of volume and/or selection of music.
B) the director of housing to impose a fine on Darcy whenever she plays her music too loud.
C) the dorm government to set a payment schedule by which Rachel would compensate Darcy for making her play her music at a lower volume.
D) the college to ban the playing of music in dorms.
Unlock Deck
Unlock for access to all 222 flashcards in this deck.
Unlock Deck
k this deck
52
(Consider This) According to the Coase theorem,
A) government should levy excise taxes on firms that generate spillover or external costs.
B) taxes should be levied such that they change private behavior as little as possible.
C) private individuals can often negotiate their own resolution of externality problems, without the need for government intervention.
D) private firms should not provide public goods.
Unlock Deck
Unlock for access to all 222 flashcards in this deck.
Unlock Deck
k this deck
53
Refer to the diagram. From society's perspective, if MB2 and MC1 are relevant,A) Q4 represents too little pollution abatement.
B) Q1 represents too little pollution abatement.
C) Q3 represents an optimal amount of pollution abatement.
D) Q2 represents too little pollution abatement.
Unlock Deck
Unlock for access to all 222 flashcards in this deck.
Unlock Deck
k this deck
54
Refer to the diagram. With MB1 and MC1, society's optimal amount of pollution abatement isA) Q1.
B) Q2.
C) Q3.
D) Q4.
Unlock Deck
Unlock for access to all 222 flashcards in this deck.
Unlock Deck
k this deck
55
Refer to the diagram. Which one of the following might shift the marginal cost curve from MC1 to MC2?A) major new studies strongly linking cancer to pollution
B) improved technology for reducing pollution
C) a change in consumer tastes from services to manufactured goods
D) an increase in the price of recycled goods
Unlock Deck
Unlock for access to all 222 flashcards in this deck.
Unlock Deck
k this deck
56
(Last Word) In a cap-and-trade program,
A) government fixes the price of pollution rights and firms choose how many permits to purchase.
B) government fixes the maximum amount of a pollutant that firms can discharge and issues permits that firms can buy from and sell to each other.
C) each firm is provided a fixed number of permits for a particular pollutant and no individual firm is allowed to acquire additional permits.
D) firms can emit whatever type of pollutant they want, so long as the total tonnage does not exceed a government-established quantity.
Unlock Deck
Unlock for access to all 222 flashcards in this deck.
Unlock Deck
k this deck
57
Refer to the diagram. Which one of the following might shift the marginal benefit curve from MB1 to MB2?A) major new studies strongly linking cancer to pollution
B) improved technology for reducing pollution
C) a change in consumer tastes from manufactured goods to services
D) a decrease in the price of recycled goods
Unlock Deck
Unlock for access to all 222 flashcards in this deck.
Unlock Deck
k this deck
58
Allocative efficiency occurs where the collective sum of consumer and producer surplus is at a
maximum.
maximum.
Unlock Deck
Unlock for access to all 222 flashcards in this deck.
Unlock Deck
k this deck
59
(Consider This) Suppose that a large tree on Betty's property is blocking Chuck's view of the lake below. Betty accepts Chuck's offer to pay Betty $100 for the right to cut down the tree. This situation
Describes
A) the Coase theorem.
B) the optimal allocation of a social good.
C) a positive externality.
D) a market for externality rights.
Describes
A) the Coase theorem.
B) the optimal allocation of a social good.
C) a positive externality.
D) a market for externality rights.
Unlock Deck
Unlock for access to all 222 flashcards in this deck.
Unlock Deck
k this deck
60
Along a supply curve, product price and producer surplus are inversely related.
Unlock Deck
Unlock for access to all 222 flashcards in this deck.
Unlock Deck
k this deck
61
Because the federal government typically provides disaster relief to farmers, many farmers do not buy crop insurance even through it is federally subsidized. This illustrates
A) the adverse selection problem.
B) the moral hazard problem.
C) the special interest effect.
D) logrolling.
A) the adverse selection problem.
B) the moral hazard problem.
C) the special interest effect.
D) logrolling.
Unlock Deck
Unlock for access to all 222 flashcards in this deck.
Unlock Deck
k this deck
62
Product reviews help to alleviate problems associated with
A) asymmetric information.
B) moral hazard.
C) positive externalities.
D) negative externalities.
A) asymmetric information.
B) moral hazard.
C) positive externalities.
D) negative externalities.
Unlock Deck
Unlock for access to all 222 flashcards in this deck.
Unlock Deck
k this deck
63
An improvement in the technology of pollution control is likely to increase society's optimal amount
of pollution abatement.
of pollution abatement.
Unlock Deck
Unlock for access to all 222 flashcards in this deck.
Unlock Deck
k this deck
64
Suppose a firm offers its workers a cafeteria plan in which it allows workers to allocate a set amount of fringe benefit money toward specific insurance. Mary, who has five kids needing braces, selects
The family dental coverage. This is an example of the
A) free-rider problem.
B) principal-agent problem.
C) adverse selection problem.
D) moral hazard problem.
The family dental coverage. This is an example of the
A) free-rider problem.
B) principal-agent problem.
C) adverse selection problem.
D) moral hazard problem.
Unlock Deck
Unlock for access to all 222 flashcards in this deck.
Unlock Deck
k this deck
65
Owners of defective used cars have more information about the condition of their vehicles than potential buyers of those used cars. This is an example of
A) the moral hazard problem.
B) a spillover cost.
C) a positive externality.
D) asymmetric information.
A) the moral hazard problem.
B) a spillover cost.
C) a positive externality.
D) asymmetric information.
Unlock Deck
Unlock for access to all 222 flashcards in this deck.
Unlock Deck
k this deck
66
As it applies to insurance, the adverse selection problem is the tendency for
A) those most likely to collect on insurance to buy it.
B) those who buy insurance to take less precaution in avoiding the insured risk.
C) sellers to price discriminate.
D) sellers to restrict output and charge high prices.
A) those most likely to collect on insurance to buy it.
B) those who buy insurance to take less precaution in avoiding the insured risk.
C) sellers to price discriminate.
D) sellers to restrict output and charge high prices.
Unlock Deck
Unlock for access to all 222 flashcards in this deck.
Unlock Deck
k this deck
67
Buyers will opt out of markets in which
A) there are significant negative externalities.
B) standardized products are being produced.
C) there is inadequate information about sellers and their products.
D) there are only foreign sellers.
A) there are significant negative externalities.
B) standardized products are being produced.
C) there is inadequate information about sellers and their products.
D) there are only foreign sellers.
Unlock Deck
Unlock for access to all 222 flashcards in this deck.
Unlock Deck
k this deck
68
Where there is asymmetric information between buyers and sellers,
A) product shortages will occur at the equilibrium price.
B) product surpluses will occur at the equilibrium price.
C) markets can produce inefficient outcomes.
D) markets will fail due to the over-allocation of resources.
A) product shortages will occur at the equilibrium price.
B) product surpluses will occur at the equilibrium price.
C) markets can produce inefficient outcomes.
D) markets will fail due to the over-allocation of resources.
Unlock Deck
Unlock for access to all 222 flashcards in this deck.
Unlock Deck
k this deck
69
Suppose an insurance company decided to offer divorce insurance. Based on the concept of moral hazard, economists would expect
A) all married couples to purchase divorce insurance.
B) no married couples to purchase divorce insurance.
C) mostly the couples with marital problems to purchase divorce insurance.
D) the divorce rate to decrease.
A) all married couples to purchase divorce insurance.
B) no married couples to purchase divorce insurance.
C) mostly the couples with marital problems to purchase divorce insurance.
D) the divorce rate to decrease.
Unlock Deck
Unlock for access to all 222 flashcards in this deck.
Unlock Deck
k this deck
70
In response to the 2008 financial crisis, the government began to bail out banks deemed "too big to fail." Critics of this action argued that this would create the prospect of future bailouts and
Encourage banks to be fiscally irresponsible in the future. This illustrates
A) the adverse selection problem.
B) the moral hazard problem.
C) the principal-agent problem.
D) logrolling.
Encourage banks to be fiscally irresponsible in the future. This illustrates
A) the adverse selection problem.
B) the moral hazard problem.
C) the principal-agent problem.
D) logrolling.
Unlock Deck
Unlock for access to all 222 flashcards in this deck.
Unlock Deck
k this deck
71
Society's marginal cost of pollution abatement curve slopes upward because of the law of
diminishing marginal utility.
diminishing marginal utility.
Unlock Deck
Unlock for access to all 222 flashcards in this deck.
Unlock Deck
k this deck
72
(Consider This) The principle that private negotiation can resolve potential externalities without
resorting to government intervention is known as the Coase theorem.
resorting to government intervention is known as the Coase theorem.
Unlock Deck
Unlock for access to all 222 flashcards in this deck.
Unlock Deck
k this deck
73
Upon learning that his auto transmission is about to fail, Ray sells his car to an unsuspecting buyer. This circumstance illustrates the
A) adverse selection problem.
B) free-rider problem.
C) moral hazard problem.
D) principal-agent problem.
A) adverse selection problem.
B) free-rider problem.
C) moral hazard problem.
D) principal-agent problem.
Unlock Deck
Unlock for access to all 222 flashcards in this deck.
Unlock Deck
k this deck
74
TripAdvisor provides online reviews of hotels, restaurants, and attractions at tourist destinations around the world. When a traveler is planning a vacation, TripAdvisor helps the traveler avoid
A) adverse selection.
B) moral hazard.
C) positive externalities.
D) negative externalities.
A) adverse selection.
B) moral hazard.
C) positive externalities.
D) negative externalities.
Unlock Deck
Unlock for access to all 222 flashcards in this deck.
Unlock Deck
k this deck
75
As it applies to insurance, the moral hazard problem is the tendency for
A) those most likely to collect on insurance to buy it.
B) those who buy insurance to take less precaution in avoiding the insured risk.
C) sellers to price discriminate.
D) sellers to restrict output and charge high prices.
A) those most likely to collect on insurance to buy it.
B) those who buy insurance to take less precaution in avoiding the insured risk.
C) sellers to price discriminate.
D) sellers to restrict output and charge high prices.
Unlock Deck
Unlock for access to all 222 flashcards in this deck.
Unlock Deck
k this deck
76
Upon buying a car with airbags, Indy begins to drive recklessly. This is an example of the
A) principal-agent problem.
B) adverse selection problem.
C) moral hazard problem.
D) free-rider problem.
A) principal-agent problem.
B) adverse selection problem.
C) moral hazard problem.
D) free-rider problem.
Unlock Deck
Unlock for access to all 222 flashcards in this deck.
Unlock Deck
k this deck
77
Sellers will opt out of markets in which
A) there are significant negative externalities.
B) standardized products exist.
C) there are only foreign buyers.
D) information about buyers is inadequate which allows some buyers to consequently impose high costs on the sellers.
A) there are significant negative externalities.
B) standardized products exist.
C) there are only foreign buyers.
D) information about buyers is inadequate which allows some buyers to consequently impose high costs on the sellers.
Unlock Deck
Unlock for access to all 222 flashcards in this deck.
Unlock Deck
k this deck
78
Professional buyers of antiques often have more information about the value of antique objects than do the sellers. This illustrates
A) the principal-agent problem.
B) the moral hazard problem.
C) the free-rider problem.
D) asymmetric information.
A) the principal-agent problem.
B) the moral hazard problem.
C) the free-rider problem.
D) asymmetric information.
Unlock Deck
Unlock for access to all 222 flashcards in this deck.
Unlock Deck
k this deck
79
Some sellers of used cars provide warranties to buyers, with the aim of reassuring buyers that the car is of good quality. These warranties help reduce the chance of what occurring?
A) negative externalities
B) adverse selection
C) spillover benefits
D) moral hazard
A) negative externalities
B) adverse selection
C) spillover benefits
D) moral hazard
Unlock Deck
Unlock for access to all 222 flashcards in this deck.
Unlock Deck
k this deck
80
In a television advertisement for AFLAC supplemental health insurance, an ice skater says to his skating partner, "Do you want to try a triple jump?" She responds, "Why not, I have AFLAC." This
Response illustrates the
A) principal-agent problem.
B) adverse selection problem.
C) moral hazard problem.
D) free-rider problem.
Response illustrates the
A) principal-agent problem.
B) adverse selection problem.
C) moral hazard problem.
D) free-rider problem.
Unlock Deck
Unlock for access to all 222 flashcards in this deck.
Unlock Deck
k this deck
Unlock Deck
Unlock for access to all 222 flashcards in this deck.


