Deck 14: Studying Textbook Chapters
Full screen (f)
Question
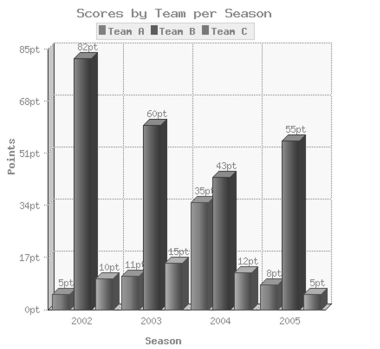
What is the purpose of the bar graph? _____________________________________________
Question
Question
Question
Question
Question
Question
What is the purpose of this table?_________________________________________________
Question
What unit of measurement is used on the y-axis?_____________________________________
Question
Question
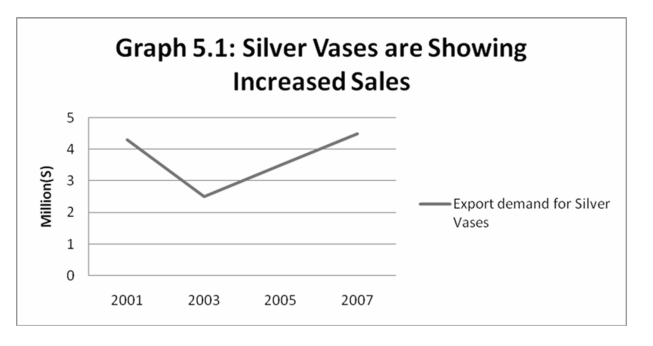
The line graph shows
A)a steady decrease in the export demand.
B)a steady increase in the export demand.
C)a fluctuations in the export demand.
D)The line graph does not discuss export demand.
Question
Question
Question
Question
What year had the highest cumulative number of points?
A)2002
B)2003
C)2004
D)2005
Question
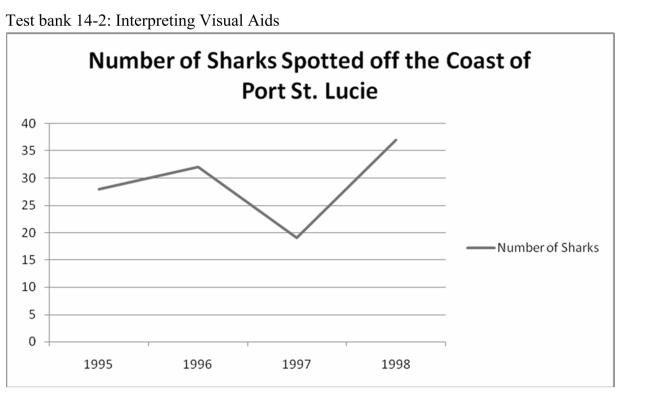
The line graph above shows
A)a steady increase in the number of sharks.
B)a steady decrease in the number of sharks.
C)a sharp downturn in the numbers of sharks followed by an increase.
D)a fluctuation in the number of sharks.
Question
What is the purpose of the line graph?_____________________________________________
Question
What is the scale of measurement on the y-axis?
A)10 points
B)7 points
C)3 points
D)17 points
Question
What is the y-axis measuring?___________________________________________________
Question
What is the x-axis measuring?___________________________________________________
Question
Question
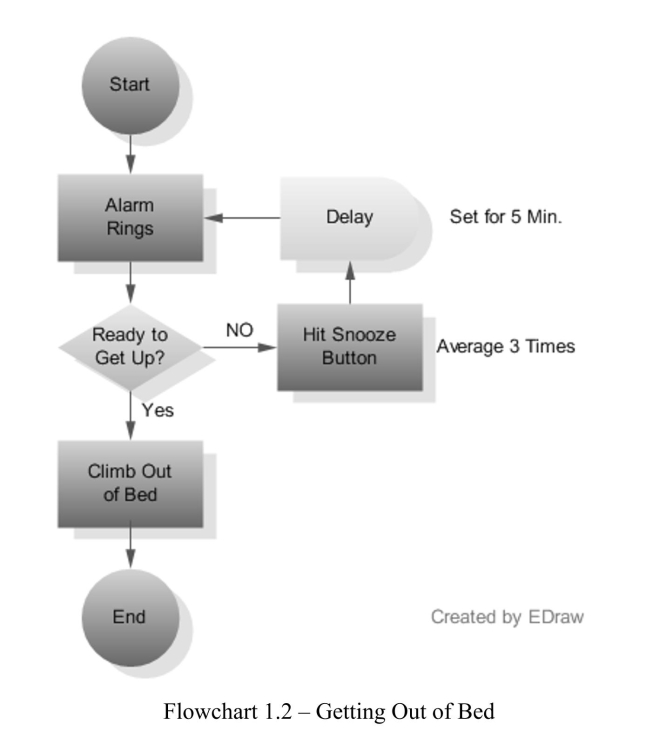
What is the second step in the process?___________________________________________
Question
What pattern of organization is demonstrated in the flowchart?
a.Comparison
b.Time order
c.Cause and effect
d.Space order

Unlock Deck
Sign up to unlock the cards in this deck!
Unlock Deck
Unlock Deck
1/22
Play
Full screen (f)
Deck 14: Studying Textbook Chapters
1
What is the purpose of the bar graph? _____________________________________________
To show a comparison of team scores from the 2002, 2003, 2004, and 2005 seasons
2
The title of a table or graph provides __________.
A)a key to the table
B)the date being discussed
C)a summary of the important information
D)an index of key details
A)a key to the table
B)the date being discussed
C)a summary of the important information
D)an index of key details
C
3
Highlighting or writing in the margin of the text is called ___________.
A)MAPPing
B)summarizing
C)using learning aids
D)annotating
A)MAPPing
B)summarizing
C)using learning aids
D)annotating
D
4
When using the double column note taking strategy, a reader should rely on the ______ strategy to write clear, concise notes.
A)MAPP
B)SQ3R
C)EASY
D)Summarizing
A)MAPP
B)SQ3R
C)EASY
D)Summarizing
Unlock Deck
Unlock for access to all 22 flashcards in this deck.
Unlock Deck
k this deck
5
To better understand the textbook, a reader should rely on ______________.
A)Annotating
B)Textbook Resources
C)Summaries
D)Headings
A)Annotating
B)Textbook Resources
C)Summaries
D)Headings
Unlock Deck
Unlock for access to all 22 flashcards in this deck.
Unlock Deck
k this deck
6
A good way to rehearse the information discussed in a paragraph is to ___________.
A)write a summary
B)annotate the text
C)activate prior knowledge
D)use double column note taking
A)write a summary
B)annotate the text
C)activate prior knowledge
D)use double column note taking
Unlock Deck
Unlock for access to all 22 flashcards in this deck.
Unlock Deck
k this deck
7
What is the purpose of this table?_________________________________________________
Unlock Deck
Unlock for access to all 22 flashcards in this deck.
Unlock Deck
k this deck
8
What unit of measurement is used on the y-axis?_____________________________________
Unlock Deck
Unlock for access to all 22 flashcards in this deck.
Unlock Deck
k this deck
9
The formula for a good summary is _________.
A)S=T+MDs
B)S=MI + MDs
C)S=T+MI+MDs
D)None of the above
A)S=T+MDs
B)S=MI + MDs
C)S=T+MI+MDs
D)None of the above
Unlock Deck
Unlock for access to all 22 flashcards in this deck.
Unlock Deck
k this deck
10
The line graph shows
A)a steady decrease in the export demand.
B)a steady increase in the export demand.
C)a fluctuations in the export demand.
D)The line graph does not discuss export demand.
Unlock Deck
Unlock for access to all 22 flashcards in this deck.
Unlock Deck
k this deck
11
Which of the following is not a strategy for reading your textbooks?
A)Use the reading process to your advantage
B)Analyze test questions
C)Understand that often hierarchical in the way they present the content
D)Take notes as you read
A)Use the reading process to your advantage
B)Analyze test questions
C)Understand that often hierarchical in the way they present the content
D)Take notes as you read
Unlock Deck
Unlock for access to all 22 flashcards in this deck.
Unlock Deck
k this deck
12
Subheading usually indicate__________.
A)Main idea
B)Thesis statement
C)Major details
D)Topic
A)Main idea
B)Thesis statement
C)Major details
D)Topic
Unlock Deck
Unlock for access to all 22 flashcards in this deck.
Unlock Deck
k this deck
13
A ________ shows how a condition or behavior changes over time.
A)line graph
B)table
C)pie chart
D)bar graph
A)line graph
B)table
C)pie chart
D)bar graph
Unlock Deck
Unlock for access to all 22 flashcards in this deck.
Unlock Deck
k this deck
14
What year had the highest cumulative number of points?
A)2002
B)2003
C)2004
D)2005
Unlock Deck
Unlock for access to all 22 flashcards in this deck.
Unlock Deck
k this deck
15
The line graph above shows
A)a steady increase in the number of sharks.
B)a steady decrease in the number of sharks.
C)a sharp downturn in the numbers of sharks followed by an increase.
D)a fluctuation in the number of sharks.
Unlock Deck
Unlock for access to all 22 flashcards in this deck.
Unlock Deck
k this deck
16
What is the purpose of the line graph?_____________________________________________
Unlock Deck
Unlock for access to all 22 flashcards in this deck.
Unlock Deck
k this deck
17
What is the scale of measurement on the y-axis?
A)10 points
B)7 points
C)3 points
D)17 points
Unlock Deck
Unlock for access to all 22 flashcards in this deck.
Unlock Deck
k this deck
18
What is the y-axis measuring?___________________________________________________
Unlock Deck
Unlock for access to all 22 flashcards in this deck.
Unlock Deck
k this deck
19
What is the x-axis measuring?___________________________________________________
Unlock Deck
Unlock for access to all 22 flashcards in this deck.
Unlock Deck
k this deck
20
In a textbook, the ____ can be found in the heading, and is often repeated though out a section.
A)Main idea
B)Thesis statement
C)Major details
D)Topic
A)Main idea
B)Thesis statement
C)Major details
D)Topic
Unlock Deck
Unlock for access to all 22 flashcards in this deck.
Unlock Deck
k this deck
21
What is the second step in the process?___________________________________________
Unlock Deck
Unlock for access to all 22 flashcards in this deck.
Unlock Deck
k this deck
22
What pattern of organization is demonstrated in the flowchart?
a.Comparison
b.Time order
c.Cause and effect
d.Space order
Unlock Deck
Unlock for access to all 22 flashcards in this deck.
Unlock Deck
k this deck
Unlock Deck
Unlock for access to all 22 flashcards in this deck.


