Deck 11: Estimation: Comparing Two Populations
Full screen (f)
Question
Question
Two independent random samples of 25 observations each are drawn from two normal populations. The parameters of these populations are: 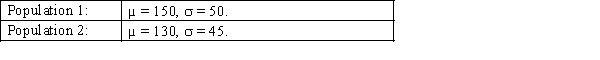 Find the probability that the mean of sample 1 will exceed the mean of sample 2.
Find the probability that the mean of sample 1 will exceed the mean of sample 2. Question
If two random samples of sizes  and
and  are selected independently from two populations with means
  and
and  , then the mean of the sampling distribution of the sample mean difference,
  , equals:
A) +
+  .
.
B) -
-  .
.
C) /
/  .
.
D)
 .:
.:
and are selected independently from two populations with means and , then the mean of the sampling distribution of the sample mean difference, , equals:A)
+ .B)
- .C)
/ .D)
.: Question
Question
If two random samples of sizes  and
and  are selected independently from two populations with variances
  and
and  , then the standard error of the sampling distribution of the sample mean difference,
  , equals:
A)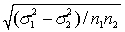 .
.
B)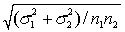 .
.
C) .
.
D) .
.
and are selected independently from two populations with variances and , then the standard error of the sampling distribution of the sample mean difference, , equals:A)
.B)
.C)
.D)
. Question
Question
If two random samples of sizes 30 and 45 are selected independently from two non-normal populations with means of 53 and 57, then the mean of the sampling distribution of the sample mean difference,  , equals -4.
, equals -4. Question
Question
Question
Question
Two independent random samples are drawn from two normal populations. The sample sizes are 20 and 25, respectively. The parameters of these populations are: 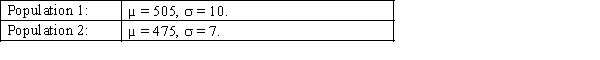 Find the probability that the difference between the two sample means
  is between 25 and 35.
Find the probability that the difference between the two sample means is between 25 and 35. Question
If two populations are not known to be normally distributed, the sampling distribution of the sample mean difference,  , will be:
A)normally distributed only if both population sizes are greater than 30.
B)normally distributed.
C)normally distributed only if at least one of the sample sizes is greater than 30.
D)approximately normally distributed.
, will be:A)normally distributed only if both population sizes are greater than 30.
B)normally distributed.
C)normally distributed only if at least one of the sample sizes is greater than 30.
D)approximately normally distributed.
Question
Question
If two random samples of sizes  and
and  are selected independently from two non-normally distributed populations, then the sampling distribution of the sample mean difference,
  , is:
, is:
A)always non-normal.
B)always normal.
C)approximately normal only if and
and  are both larger than 30.
D)approximately normal regardless of and
and  .
.
and are selected independently from two non-normally distributed populations, then the sampling distribution of the sample mean difference, , is:A)always non-normal.
B)always normal.
C)approximately normal only if
and are both larger than 30.D)approximately normal regardless of
and . Question
Question
If two random samples, each of size 36, are selected independently from two populations with variances of 42 and 50, then the standard error of the sampling distribution of the sample mean difference,  , equals 2.5556.
, equals 2.5556. Question
Question
Two samples are selected at random from two independent normally distributed populations. Sample 1 has 49 observations and has a mean of 10 and a standard deviation of 5. Sample 2 has 36 observations and has a mean of 12 and a standard deviation of 3. The standard error of the sampling distribution of the sample mean difference,  , is:
, is:
A)0.1853.
B)0.7602.
C)0.7331.
D)0.8719.
, is:A)0.1853.
B)0.7602.
C)0.7331.
D)0.8719.
Question
In constructing a 99% confidence interval estimate for the difference between the means of two normally distributed populations, where the unknown population variances are assumed not to be equal, summary statistics computed from two independent samples are as follows: n1 = 28  = 123
= 123
S1 = 8.5
N2 = 45 = 105
= 105
S2 = 12.4
The lower confidence limit is:
A)24.485.
B)11.515.
C)13.116.
D)22.884.
= 123S1 = 8.5
N2 = 45
= 105S2 = 12.4
The lower confidence limit is:
A)24.485.
B)11.515.
C)13.116.
D)22.884.
Question
Suppose that the starting salaries of male workers are normally distributed with a mean of $56 000 and a standard deviation of $12 000. The starting salaries of female workers are normally distributed with a mean of $50 000 and a standard deviation of $10 000. A random sample of 50 male workers and a random sample of 40 female workers are selected.
a. What is the sampling distribution of the sample mean difference ? Explain.
b. Find the expected value and the standard error of the sample mean difference.
c. What is the probability that the sample mean salary of female workers will not exceed that of the male workers?
a. What is the sampling distribution of the sample mean difference
? Explain.b. Find the expected value and the standard error of the sample mean difference.
c. What is the probability that the sample mean salary of female workers will not exceed that of the male workers?
Question
Two random samples from two normal populations produced the following statistics:
n1 = 51, = 35, s1 = 28.
n2 = 40, = 28, s2 = 10.
Assume that the two population variances are different. Estimate with 95% confidence the difference between the two population means.
n1 = 51,
= 35, s1 = 28.n2 = 40,
= 28, s2 = 10.Assume that the two population variances are different. Estimate with 95% confidence the difference between the two population means.
Question
A simple random sample of ten firms was asked how much money (in thousands of dollars) they spent on employee training programs this year and how much they plan to spend on these programs next year. The data are shown below.  Assume that the populations of amount spent on employee training programs are normally distributed.
a. Estimate with 95% confidence the mean difference.
b. Briefly explain what the interval estimate in part a. tells you.
Assume that the populations of amount spent on employee training programs are normally distributed.a. Estimate with 95% confidence the mean difference.
b. Briefly explain what the interval estimate in part a. tells you.
Question
A quality control inspector keeps a tally sheet of the numbers of acceptable and unacceptable products that come off two different production lines. The completed sheet is shown below.  Estimate with 95% confidence the difference in population proportions.
Estimate with 95% confidence the difference in population proportions. Question
Question
The marketing manager of a pharmaceutical company believes that more females than males use its acne medicine. In a recent survey, 2500 teenagers were asked whether or not they use that particular product. The responses, categorised by gender, are summarised below. 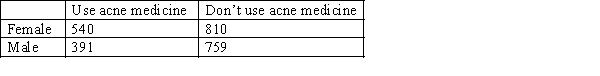 a. Estimate with 90% confidence the difference in the proportions of male and female users of the acne medicine.
b. Describe what the interval estimate in part a. tells you.
a. Estimate with 90% confidence the difference in the proportions of male and female users of the acne medicine.b. Describe what the interval estimate in part a. tells you.
Question
Question
Ten functionally illiterate adults were given an experimental one-week crash course in reading. Each of the 10 was given a reading test prior to the course and another test after the course. The results are shown below. 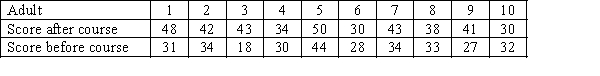 a. Estimate the mean improvement with 95% confidence.
b. Briefly describe what the interval estimate in part a. tells you.
a. Estimate the mean improvement with 95% confidence.b. Briefly describe what the interval estimate in part a. tells you.
Question
The following data were generated from a matched pairs experiment: 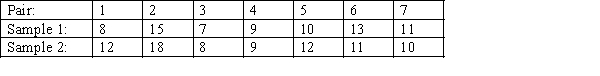 Estimate with 90% confidence the mean difference.
Estimate with 90% confidence the mean difference. Question
In random samples of 25 and 22 from each of two normal populations, we find the following statistics:  = 56, s1 = 8.
  = 62, s2 = 8.5.
Assume that the population variances are equal. Estimate with 95% confidence the difference between the two population means.
= 56, s1 = 8. = 62, s2 = 8.5.Assume that the population variances are equal. Estimate with 95% confidence the difference between the two population means.
Question
Question
Question
Question
Question
Question
Question
Given the following statistics:
n1 = 10, = 58.6, s1 = 13.45.
n2 = 10, = 64.6, s2 = 11.15.
Estimate with 95% confidence the difference between the two population means.
n1 = 10,
= 58.6, s1 = 13.45.n2 = 10,
= 64.6, s2 = 11.15.Estimate with 95% confidence the difference between the two population means.

Unlock Deck
Sign up to unlock the cards in this deck!
Unlock Deck
Unlock Deck
1/36
Play
Full screen (f)
Deck 11: Estimation: Comparing Two Populations
1
The expected value of the difference of two sample means equals the difference of the corresponding population means:
A)only if the populations are normally distributed.
B)only if the samples are independent.
C)only if the populations are approximately normal and the sample sizes are large.
D)is always correct.
A)only if the populations are normally distributed.
B)only if the samples are independent.
C)only if the populations are approximately normal and the sample sizes are large.
D)is always correct.
is always correct.
2
Two independent random samples of 25 observations each are drawn from two normal populations. The parameters of these populations are: Find the probability that the mean of sample 1 will exceed the mean of sample 2.
Find the probability that the mean of sample 1 will exceed the mean of sample 2.0.9319.
3
If two random samples of sizes and are selected independently from two populations with means and , then the mean of the sampling distribution of the sample mean difference, , equals:
A) + .
B) - .
C) / .
D) .:
and are selected independently from two populations with means and , then the mean of the sampling distribution of the sample mean difference, , equals:A)
+ .B)
- .C)
/ .D)
.: - . 4
In constructing a confidence interval estimate for the difference between two population proportions, we:
A)pool the population proportions when the populations are normally distributed.
B)pool the population proportions when the population means are equal.
C)pool the population proportions when they are equal.
D)never pool the population proportions.
A)pool the population proportions when the populations are normally distributed.
B)pool the population proportions when the population means are equal.
C)pool the population proportions when they are equal.
D)never pool the population proportions.
Unlock Deck
Unlock for access to all 36 flashcards in this deck.
Unlock Deck
k this deck
5
If two random samples of sizes and are selected independently from two populations with variances and , then the standard error of the sampling distribution of the sample mean difference, , equals:
A) .
B) .
C) .
D) .
and are selected independently from two populations with variances and , then the standard error of the sampling distribution of the sample mean difference, , equals:A)
.B)
.C)
.D)
. Unlock Deck
Unlock for access to all 36 flashcards in this deck.
Unlock Deck
k this deck
6
We cannot estimate the difference between population means by estimating the mean difference μD,
when the data are produced by a matched pairs experiment.
when the data are produced by a matched pairs experiment.
Unlock Deck
Unlock for access to all 36 flashcards in this deck.
Unlock Deck
k this deck
7
If two random samples of sizes 30 and 45 are selected independently from two non-normal populations with means of 53 and 57, then the mean of the sampling distribution of the sample mean difference, , equals -4.
, equals -4. Unlock Deck
Unlock for access to all 36 flashcards in this deck.
Unlock Deck
k this deck
8
Which of the following statements is correct when estimating the difference between two population proportions p1 − p2?
A)We must take two independent samples.
B)We count the number of successes in each sample.
C)The sampling distribution of the difference of sample proportions is approximately normally distributed for large sample sizes.
D)All of these choices are correct.
A)We must take two independent samples.
B)We count the number of successes in each sample.
C)The sampling distribution of the difference of sample proportions is approximately normally distributed for large sample sizes.
D)All of these choices are correct.
Unlock Deck
Unlock for access to all 36 flashcards in this deck.
Unlock Deck
k this deck
9
Suppose that the starting salaries of finance graduates from university A are normally distributed with a mean of $36 750 and a standard deviation of $5320. The starting salaries of finance graduates from university B are normally distributed with a mean of $34 625 and a standard deviation of $6540. If simple random samples of 50 finance graduates are selected from each university, what is the probability that the sample mean of university A graduates will exceed that of university B graduates?
Unlock Deck
Unlock for access to all 36 flashcards in this deck.
Unlock Deck
k this deck
10
In order to draw inferences about p1 − p2, we take two independent samples − a sample of size n1 from population 1 and a sample of size n2 from population 2.
Unlock Deck
Unlock for access to all 36 flashcards in this deck.
Unlock Deck
k this deck
11
Two independent random samples are drawn from two normal populations. The sample sizes are 20 and 25, respectively. The parameters of these populations are: Find the probability that the difference between the two sample means is between 25 and 35.
Find the probability that the difference between the two sample means is between 25 and 35. Unlock Deck
Unlock for access to all 36 flashcards in this deck.
Unlock Deck
k this deck
12
If two populations are not known to be normally distributed, the sampling distribution of the sample mean difference, , will be:
A)normally distributed only if both population sizes are greater than 30.
B)normally distributed.
C)normally distributed only if at least one of the sample sizes is greater than 30.
D)approximately normally distributed.
, will be:A)normally distributed only if both population sizes are greater than 30.
B)normally distributed.
C)normally distributed only if at least one of the sample sizes is greater than 30.
D)approximately normally distributed.
Unlock Deck
Unlock for access to all 36 flashcards in this deck.
Unlock Deck
k this deck
13
When the two population variances are unequal, we cannot pool the data and produce a
common estimator. We must calculate s12 or s22 and use them to estimate σ12 and σ22 respectively.
common estimator. We must calculate s12 or s22 and use them to estimate σ12 and σ22 respectively.
Unlock Deck
Unlock for access to all 36 flashcards in this deck.
Unlock Deck
k this deck
14
If two random samples of sizes and are selected independently from two non-normally distributed populations, then the sampling distribution of the sample mean difference, , is:
A)always non-normal.
B)always normal.
C)approximately normal only if and are both larger than 30.
D)approximately normal regardless of and .
and are selected independently from two non-normally distributed populations, then the sampling distribution of the sample mean difference, , is:A)always non-normal.
B)always normal.
C)approximately normal only if
and are both larger than 30.D)approximately normal regardless of
and . Unlock Deck
Unlock for access to all 36 flashcards in this deck.
Unlock Deck
k this deck
15
Which of the following best describes a matched pairs experiment?
A)An experiment in which each observation in one sample can be matched with an observation in another sample.
B)A matched pairs experiments means that the samples are not independent.
C)We estimate the difference between population means by estimating the mean difference when the data are produced by a matched pairs experiment.
D)All of these choices are correct.
Unlock Deck
Unlock for access to all 36 flashcards in this deck.
Unlock Deck
k this deck
16
If two random samples, each of size 36, are selected independently from two populations with variances of 42 and 50, then the standard error of the sampling distribution of the sample mean difference, , equals 2.5556.
, equals 2.5556. Unlock Deck
Unlock for access to all 36 flashcards in this deck.
Unlock Deck
k this deck
17
In constructing a confidence interval estimate for the difference between the means of two normally distributed populations, using two independent samples, we:
A)pool the sample variances when the unknown population variances are equal.
B)pool the sample variances when the population variances are known and equal.
C)pool the sample variances when the population means are equal.
D)never pool the sample variances.
A)pool the sample variances when the unknown population variances are equal.
B)pool the sample variances when the population variances are known and equal.
C)pool the sample variances when the population means are equal.
D)never pool the sample variances.
Unlock Deck
Unlock for access to all 36 flashcards in this deck.
Unlock Deck
k this deck
18
Two samples are selected at random from two independent normally distributed populations. Sample 1 has 49 observations and has a mean of 10 and a standard deviation of 5. Sample 2 has 36 observations and has a mean of 12 and a standard deviation of 3. The standard error of the sampling distribution of the sample mean difference, , is:
A)0.1853.
B)0.7602.
C)0.7331.
D)0.8719.
, is:A)0.1853.
B)0.7602.
C)0.7331.
D)0.8719.
Unlock Deck
Unlock for access to all 36 flashcards in this deck.
Unlock Deck
k this deck
19
In constructing a 99% confidence interval estimate for the difference between the means of two normally distributed populations, where the unknown population variances are assumed not to be equal, summary statistics computed from two independent samples are as follows: n1 = 28 = 123
S1 = 8.5
N2 = 45 = 105
S2 = 12.4
The lower confidence limit is:
A)24.485.
B)11.515.
C)13.116.
D)22.884.
= 123S1 = 8.5
N2 = 45
= 105S2 = 12.4
The lower confidence limit is:
A)24.485.
B)11.515.
C)13.116.
D)22.884.
Unlock Deck
Unlock for access to all 36 flashcards in this deck.
Unlock Deck
k this deck
20
Suppose that the starting salaries of male workers are normally distributed with a mean of $56 000 and a standard deviation of $12 000. The starting salaries of female workers are normally distributed with a mean of $50 000 and a standard deviation of $10 000. A random sample of 50 male workers and a random sample of 40 female workers are selected.
a. What is the sampling distribution of the sample mean difference ? Explain.
b. Find the expected value and the standard error of the sample mean difference.
c. What is the probability that the sample mean salary of female workers will not exceed that of the male workers?
a. What is the sampling distribution of the sample mean difference
? Explain.b. Find the expected value and the standard error of the sample mean difference.
c. What is the probability that the sample mean salary of female workers will not exceed that of the male workers?
Unlock Deck
Unlock for access to all 36 flashcards in this deck.
Unlock Deck
k this deck
21
Two random samples from two normal populations produced the following statistics:
n1 = 51, = 35, s1 = 28.
n2 = 40, = 28, s2 = 10.
Assume that the two population variances are different. Estimate with 95% confidence the difference between the two population means.
n1 = 51,
= 35, s1 = 28.n2 = 40,
= 28, s2 = 10.Assume that the two population variances are different. Estimate with 95% confidence the difference between the two population means.
Unlock Deck
Unlock for access to all 36 flashcards in this deck.
Unlock Deck
k this deck
22
A simple random sample of ten firms was asked how much money (in thousands of dollars) they spent on employee training programs this year and how much they plan to spend on these programs next year. The data are shown below. Assume that the populations of amount spent on employee training programs are normally distributed.
a. Estimate with 95% confidence the mean difference.
b. Briefly explain what the interval estimate in part a. tells you.
Assume that the populations of amount spent on employee training programs are normally distributed.a. Estimate with 95% confidence the mean difference.
b. Briefly explain what the interval estimate in part a. tells you.
Unlock Deck
Unlock for access to all 36 flashcards in this deck.
Unlock Deck
k this deck
23
A quality control inspector keeps a tally sheet of the numbers of acceptable and unacceptable products that come off two different production lines. The completed sheet is shown below. Estimate with 95% confidence the difference in population proportions.
Estimate with 95% confidence the difference in population proportions. Unlock Deck
Unlock for access to all 36 flashcards in this deck.
Unlock Deck
k this deck
24
Thirty-five employees who completed two years of tertiary education were asked to take a basic mathematics test. The mean and standard deviation of their marks were 75.1 and 12.8, respectively. In a random sample of 50 employees who only completed high school, the mean and standard deviation of the test marks were 72.1 and 14.6, respectively. Estimate with 90% confidence the difference in mean scores between the two groups of employees.
Unlock Deck
Unlock for access to all 36 flashcards in this deck.
Unlock Deck
k this deck
25
The marketing manager of a pharmaceutical company believes that more females than males use its acne medicine. In a recent survey, 2500 teenagers were asked whether or not they use that particular product. The responses, categorised by gender, are summarised below. a. Estimate with 90% confidence the difference in the proportions of male and female users of the acne medicine.
b. Describe what the interval estimate in part a. tells you.
a. Estimate with 90% confidence the difference in the proportions of male and female users of the acne medicine.b. Describe what the interval estimate in part a. tells you.
Unlock Deck
Unlock for access to all 36 flashcards in this deck.
Unlock Deck
k this deck
26
A political poll taken immediately prior to a state election reveals that 158 out of 250 male voters and 105 out of 200 female voters intend to vote for the Independent candidate. Estimate with 95% confidence the difference between the proportions of male and female voters who intend to vote for the Independent candidate.
Unlock Deck
Unlock for access to all 36 flashcards in this deck.
Unlock Deck
k this deck
27
Ten functionally illiterate adults were given an experimental one-week crash course in reading. Each of the 10 was given a reading test prior to the course and another test after the course. The results are shown below. a. Estimate the mean improvement with 95% confidence.
b. Briefly describe what the interval estimate in part a. tells you.
a. Estimate the mean improvement with 95% confidence.b. Briefly describe what the interval estimate in part a. tells you.
Unlock Deck
Unlock for access to all 36 flashcards in this deck.
Unlock Deck
k this deck
28
The following data were generated from a matched pairs experiment: Estimate with 90% confidence the mean difference.
Estimate with 90% confidence the mean difference. Unlock Deck
Unlock for access to all 36 flashcards in this deck.
Unlock Deck
k this deck
29
In random samples of 25 and 22 from each of two normal populations, we find the following statistics: = 56, s1 = 8. = 62, s2 = 8.5.
Assume that the population variances are equal. Estimate with 95% confidence the difference between the two population means.
= 56, s1 = 8. = 62, s2 = 8.5.Assume that the population variances are equal. Estimate with 95% confidence the difference between the two population means.
Unlock Deck
Unlock for access to all 36 flashcards in this deck.
Unlock Deck
k this deck
30
A study is trying to estimate the difference between the annual salaries paid to female and male employees working for the same large company. They take a random sample of 50 females and find that their average a
nnual salary is $75 600 with a variance of $21 250. They take a random sample of 50 males and find that their average annual salary is $78 500 with a variance of $22 500. Find and interpret a 95% confidence interval for the difference in annual salaries for female and male employees of this large company.
nnual salary is $75 600 with a variance of $21 250. They take a random sample of 50 males and find that their average annual salary is $78 500 with a variance of $22 500. Find and interpret a 95% confidence interval for the difference in annual salaries for female and male employees of this large company.
Unlock Deck
Unlock for access to all 36 flashcards in this deck.
Unlock Deck
k this deck
31
In an experiment comparing two populations, we find the following statistics:
n1 = 150, x1 = 72.
n2 = 175, x2 = 70.
Estimate with 95% confidence the difference between the two population proportions.
n1 = 150, x1 = 72.
n2 = 175, x2 = 70.
Estimate with 95% confidence the difference between the two population proportions.
Unlock Deck
Unlock for access to all 36 flashcards in this deck.
Unlock Deck
k this deck
32
For a matched pairs experiment, find a 90% confidence interval for µD given that sample mean differences is 5, the standard deviation of differences is 3 and the sample sizes are 30.
Unlock Deck
Unlock for access to all 36 flashcards in this deck.
Unlock Deck
k this deck
33
We find the following statistics:
n1 = 400, x1 = 105.
n2 = 500, x2 = 140.
Estimate with 90% confidence the difference between the two population proportions.
n1 = 400, x1 = 105.
n2 = 500, x2 = 140.
Estimate with 90% confidence the difference between the two population proportions.
Unlock Deck
Unlock for access to all 36 flashcards in this deck.
Unlock Deck
k this deck
34
In an experiment comparing two populations, we find the following statistics:
n1 = 200, x1 = 80.
n2 = 400, x2 = 140.
Estimate with 95% confidence the difference between the two population proportions.
n1 = 200, x1 = 80.
n2 = 400, x2 = 140.
Estimate with 95% confidence the difference between the two population proportions.
Unlock Deck
Unlock for access to all 36 flashcards in this deck.
Unlock Deck
k this deck
35
Estimate p1 − p2 with 99% confidence, given that n1 = 50 and n2 = 50 and the first sample has a proportion of 0.50 and the second sample has a proportion of 0.20
Unlock Deck
Unlock for access to all 36 flashcards in this deck.
Unlock Deck
k this deck
36
Given the following statistics:
n1 = 10, = 58.6, s1 = 13.45.
n2 = 10, = 64.6, s2 = 11.15.
Estimate with 95% confidence the difference between the two population means.
n1 = 10,
= 58.6, s1 = 13.45.n2 = 10,
= 64.6, s2 = 11.15.Estimate with 95% confidence the difference between the two population means.
Unlock Deck
Unlock for access to all 36 flashcards in this deck.
Unlock Deck
k this deck
Unlock Deck
Unlock for access to all 36 flashcards in this deck.


