Deck 18: Price Setting in the Business World
Full screen (f)
Question
Question
Question
Question
Question
Question
Question
Question
Question
Question
Question
Question
Question
Question

Unlock Deck
Sign up to unlock the cards in this deck!
Unlock Deck
Unlock Deck
1/14
Play
Full screen (f)
Deck 18: Price Setting in the Business World
1
If total fixed costs are $200,000 and total variable costs are $100,000 at the output of 20,000 units, what are the probable total fixed costs and total variable costs at an output of 10,000 units? What are the average fixed costs, average variable costs, and average costs at these two output levels? Explain what additional information you would want to determine what price should be charged.
Problem has total fixed cost at an output of 20,000 units is $2, 00,000 and total variable cost at an output of 20,000 units is $100,000. Firm calculates the fixed average variable cost, fixed cost, total costs, and then defines average cost at varying output.
Below steps involves calculation of the fixed average variable cost, fixed cost, total costs, and finding average cost at varying output.
Step 1: Calculate average variable costs at an output of 20,000 units.
 =
=
 = $5
= $5
So, Average variable cost is $5 at an output of 20,000 units.
Usually, average variable cost of the firm remains fixed at an output of 10,000.
Therefore, Average variable cost is also $5 at an output of 10,000 units.
Similarly, Total fixed costs at an output of 10,000 units are same for 20,000 units.
So, Total fixed costs at an output of 10,000 units = $200,000
Step 2: Calculate total variable costs at an output of 10,000 units.
Total variable costs = Average variable cost x Quantity of units
= 5 x 10,000
= 50,000
So, variable costs at an output of 10,000 units is $50,000
Step 3: Calculate average fixed costs at an output of 10,000 units.
 =
=
 = $20
= $20
Therefore, an average fixed cost at an output of 10,000 units is $20.
Step 4: Calculate the total cost the output of 10,000 unit.
Total cost = Total Fixed cost + Total variable cost.
= 2, 00,000 + 50,000
= 2, 50,000
Step 5: Calculate the total cost at an output of 20,000 unit.
Total cost = Total Fixed cost + Total variable cost.
= 2, 00,000 + 1, 00,000
= 3, 00,000
Step 6: Calculate an average cost at an output of 10,000 unit.
Average cost =
 =
=
 = $25
= $25
Therefore, an average cost at an output of 10,000 units is $25.
Step 7: Calculate an average cost at an output of 20,000 units.
Average cost =
 =
=
 = $15
= $15
Therefore, an average cost at an output of 20,000 units is $15.
Below steps involves calculation of the fixed average variable cost, fixed cost, total costs, and finding average cost at varying output.
Step 1: Calculate average variable costs at an output of 20,000 units.
= = $5So, Average variable cost is $5 at an output of 20,000 units.
Usually, average variable cost of the firm remains fixed at an output of 10,000.
Therefore, Average variable cost is also $5 at an output of 10,000 units.
Similarly, Total fixed costs at an output of 10,000 units are same for 20,000 units.
So, Total fixed costs at an output of 10,000 units = $200,000
Step 2: Calculate total variable costs at an output of 10,000 units.
Total variable costs = Average variable cost x Quantity of units
= 5 x 10,000
= 50,000
So, variable costs at an output of 10,000 units is $50,000
Step 3: Calculate average fixed costs at an output of 10,000 units.
= = $20Therefore, an average fixed cost at an output of 10,000 units is $20.
Step 4: Calculate the total cost the output of 10,000 unit.
Total cost = Total Fixed cost + Total variable cost.
= 2, 00,000 + 50,000
= 2, 50,000
Step 5: Calculate the total cost at an output of 20,000 unit.
Total cost = Total Fixed cost + Total variable cost.
= 2, 00,000 + 1, 00,000
= 3, 00,000
Step 6: Calculate an average cost at an output of 10,000 unit.
Average cost =
= = $25Therefore, an average cost at an output of 10,000 units is $25.
Step 7: Calculate an average cost at an output of 20,000 units.
Average cost =
= = $15Therefore, an average cost at an output of 20,000 units is $15.
2
Construct an example showing that mechanical use of a very large or a very small markup might still lead to unprofitable operation while some intermediate price would be profitable. Draw a graph and show the break-even point(s).
Markup is a typical parameter. Markup depends on the variable cost, and selling price of the product. Breakeven points shows break even quantity for the revenue of the business. Goods sold at a profit can have less markup percent of the business and goods sold at less can have more markup percent of the business.
The events of loss are possible when markups and profit margins are increasing. Break even quantity increases when sales revenue of the goods increases. Markup of the good is reducing when the total variable cost of the product, and break up quantity is increases. As the breakeven quantity are increases, business losses also increases.
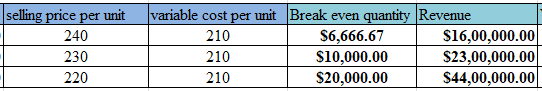
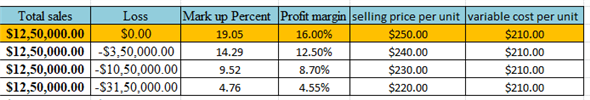
Consider a firm having fixed costs for the years at $200,000. Products are sold at $250, $240, $230, and $220 per unit and the variable cost per unit is $210. Total Sales of the business reaches $1,250,000. The management team drafts a breakeven point at various mark up, and profit margin. Below illustration shows the loss of sales through the profits in markup, and profit margin.
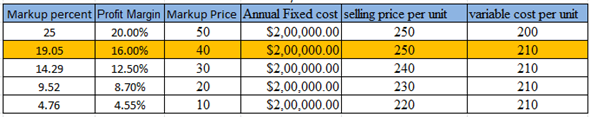
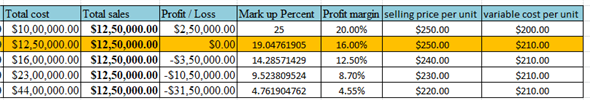 The highlighting details in yellow shows the zero profit in sales at 19 % markup, and 16% profit margin in single unit of product. The total sales in the table show the loss at various profit margins, markup of the business.
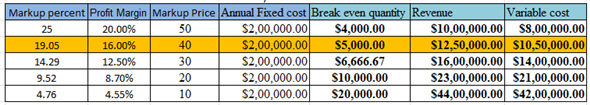
Below table shows breakeven quantity, and revenue details.
 Below are the steps of calculation of the breakeven point from the selling price of $ 250 and fixed variable cost of $210 per unit.
First, calculate the markup price. Markup percent is the ratio of difference of selling price and variable cost to the selling price
 Markup percent =
 = 19.048 %
So, Markup percent is 19.048 %.
Similarly, Markup percent from the selling price of $240, $230, and $210 is 14.29, 9.52, and 4.76.
Step 1: Calculate the break even quantity.
Break even quantity is the division of annual fixed cost to the difference of selling price per unit and variable cost per unit.
Break even quantity =
 =
=
 = 5,000
So, Break even quantity (BEQ) is $5,000.
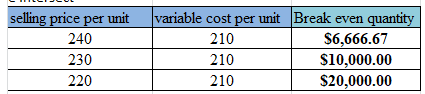
Similarly, BEQ at various selling price are shown below:
 Step 2: Calculate the revenue from the BEQ of step 1.
Revenue is the product of break-even quantity and selling price per unit.
Revenue = Break even quantity x selling price per unit
= 5,000 x 250
= 12, 50,000
So, revenue from the BEQ is $ 12, 50,000.
Similarly, other revenue at various BOQ is:
 Step 3: Calculate the variable cost from the BEQ in step 2.
Variable cost is the product of break-even quantity and variable cost per unit.
Variable cost = Break even quantity x variable cost per unit
= 5,000 x 210
= 10, 50,000
So, variable cost from the BEQ is $ 10, 50,000.
Similarly, other variable cost is:
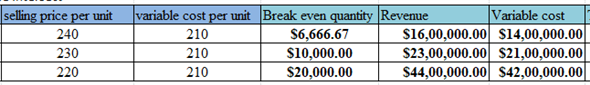 Step 4: Calculate the total cost from the variable cost obtained in step 3.
Total cost = Annual Fixed cost + Variable cost in step 3
= 2, 00,000 + 10, 50,000
= 12, 50,000
So, total cost is $ 12, 50,000.
Similarly, other total cost is:
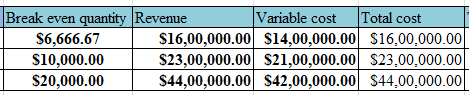 Step 5: Calculate the profit from the total cost obtained in step 4. From the problem, annual sales are $ 12, 50,000.
So, Profit = Total sales - Total cost in step 3
= 12, 50,000 - 12, 50,000
= 0
Hence, business has no profit from the total costs of $12, 50,000.
Similarly, business losses from the step 4 are:
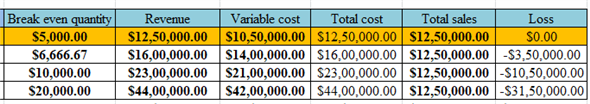
 Therefore, from the above calculation of table shows the losses from the markup percent, and profit margin.
Break Even Point:
Break-even point is the represents the total cost and total revenue meets with the point of intersection. The break-even point will examine the quantity and revenue to capture the total cost of the product. Here, the total cost includes fixed and variable costs. Below figure shows the graph having break even quantity at x-axis, and cost at y-axis. The graph includes the lines of total cost (T1, T2, T3), fixed cost (FC1, FC2, FC3), and revenue (R1, R2, R3).
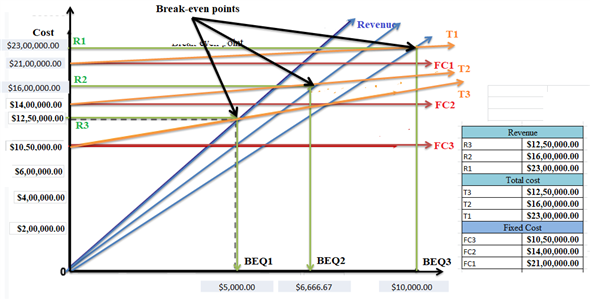 Here, blue line indicates the revenue; yellow line indicates the total cost, red line indicates fixed cost, green line from the point of intersection indicates break-even quantity (BEQ1, BEQ2, and BEQ3) at x-axis, and revenue at y-axis.
The events of loss are possible when markups and profit margins are increasing. Break even quantity increases when sales revenue of the goods increases. Markup of the good is reducing when the total variable cost of the product, and break up quantity is increases. As the breakeven quantity are increases, business losses also increases.
Consider a firm having fixed costs for the years at $200,000. Products are sold at $250, $240, $230, and $220 per unit and the variable cost per unit is $210. Total Sales of the business reaches $1,250,000. The management team drafts a breakeven point at various mark up, and profit margin. Below illustration shows the loss of sales through the profits in markup, and profit margin.
The highlighting details in yellow shows the zero profit in sales at 19 % markup, and 16% profit margin in single unit of product. The total sales in the table show the loss at various profit margins, markup of the business.Below table shows breakeven quantity, and revenue details.
Below are the steps of calculation of the breakeven point from the selling price of $ 250 and fixed variable cost of $210 per unit.First, calculate the markup price. Markup percent is the ratio of difference of selling price and variable cost to the selling price
Markup percent = = 19.048 %So, Markup percent is 19.048 %.
Similarly, Markup percent from the selling price of $240, $230, and $210 is 14.29, 9.52, and 4.76.
Step 1: Calculate the break even quantity.
Break even quantity is the division of annual fixed cost to the difference of selling price per unit and variable cost per unit.
Break even quantity =
= = 5,000So, Break even quantity (BEQ) is $5,000.
Similarly, BEQ at various selling price are shown below:
Step 2: Calculate the revenue from the BEQ of step 1. Revenue is the product of break-even quantity and selling price per unit.
Revenue = Break even quantity x selling price per unit
= 5,000 x 250
= 12, 50,000
So, revenue from the BEQ is $ 12, 50,000.
Similarly, other revenue at various BOQ is:
Step 3: Calculate the variable cost from the BEQ in step 2. Variable cost is the product of break-even quantity and variable cost per unit.
Variable cost = Break even quantity x variable cost per unit
= 5,000 x 210
= 10, 50,000
So, variable cost from the BEQ is $ 10, 50,000.
Similarly, other variable cost is:
Step 4: Calculate the total cost from the variable cost obtained in step 3. Total cost = Annual Fixed cost + Variable cost in step 3
= 2, 00,000 + 10, 50,000
= 12, 50,000
So, total cost is $ 12, 50,000.
Similarly, other total cost is:
Step 5: Calculate the profit from the total cost obtained in step 4. From the problem, annual sales are $ 12, 50,000. So, Profit = Total sales - Total cost in step 3
= 12, 50,000 - 12, 50,000
= 0
Hence, business has no profit from the total costs of $12, 50,000.
Similarly, business losses from the step 4 are:
Therefore, from the above calculation of table shows the losses from the markup percent, and profit margin.Break Even Point:
Break-even point is the represents the total cost and total revenue meets with the point of intersection. The break-even point will examine the quantity and revenue to capture the total cost of the product. Here, the total cost includes fixed and variable costs. Below figure shows the graph having break even quantity at x-axis, and cost at y-axis. The graph includes the lines of total cost (T1, T2, T3), fixed cost (FC1, FC2, FC3), and revenue (R1, R2, R3).
Here, blue line indicates the revenue; yellow line indicates the total cost, red line indicates fixed cost, green line from the point of intersection indicates break-even quantity (BEQ1, BEQ2, and BEQ3) at x-axis, and revenue at y-axis. 3
The Davis Company's fixed costs for the year are estimated at $200,000. Its product sells for $250. The variable cost per unit is $200. Sales for the coming year are expected to reach $1,250,000. What is the break-even point? Expected profit? If sales are forecast at only $875,000, should the Davis Company shut down operations? Why?
As per the Problem:
Total fixed cost per year is $2, 00,000. Selling value of Product is $ 250, and total variable cost per unit is $200. Sales of upcoming year = $ 12, 50,000.
Step 1: Calculate the break even quantity.
Break even quantity is the division of annual fixed cost to the difference of selling price per unit and variable cost per unit.
Break even quantity =
 =
=
 = 4,000
So, Break even quantity (BEQ) is $4,000.
Step 2: Calculate the revenue from the BEQ of step 1.
Revenue is the product of break-even quantity and selling price per unit.
Revenue = Break even quantity x selling price per unit
= 4,000 x 250
= 10, 00,000
So, revenue from the BEQ is $ 10, 00,000.
Step 3: Calculate the variable cost from the BEQ in step 2.
Variable cost is the product of break-even quantity and variable cost per unit.
Variable cost = Break even quantity x variable cost per unit
= 4,000 x 200
= 8, 00,000
So, variable cost from the BEQ is $ 8, 00,000.
Step 4: Calculate the total cost from the variable cost obtained in step 3.
Total cost = Annual Fixed cost + Variable cost in step 2
= 2, 00,000 + 8, 00,000
= 10, 00,000
So, total cost is $ 10, 00,000.
Step 5: Calculate the profit from the total cost obtained in step 4. From the problem, annual sales are $ 12, 50,000.
So, Profit = Total sales - Total cost in step 3
= 12, 50,000 - 10, 00,000
= 2, 50,000
Hence, company has expected profit of $2, 50,000 from the total costs of $10, 00,000.
Break Even Point:
Break-even point is the represents the total cost and total revenue meets with the point of intersection. The break-even point will examine the quantity and revenue to capture the total cost of the product. Here, the total cost includes fixed and variable costs. Below figure shows the graph having quantity at x-axis, and cost at y-axis. The graph includes the lines of total cost, fixed cost, and revenue.
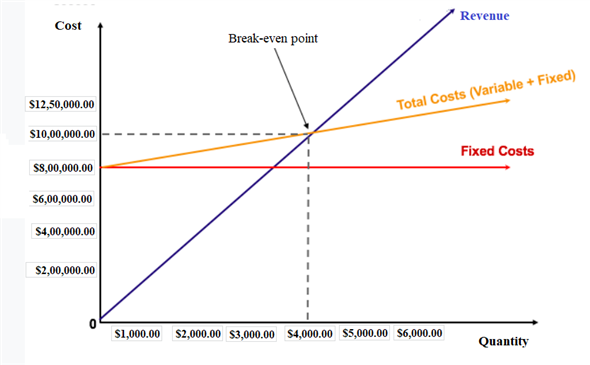 Here, blue line indicates the revenue; yellow line indicates the total cost, red line indicates fixed cost, dotted line from the point of intersection indicates break-even quantity at x-axis, and revenue at y-axis.
Calculating the profit from the total cost obtained in step 4.
From the problem, annual sales are $ 8, 75,000.
So, Profit = Total sales - Total cost in step 3
= 8, 75,000 - 10, 00,000
= -1, 25,000
Here, company has a loss of $1, 25,000 from the sales forecast of $8, 75,000.
The company will not shut down when the total cost of the operation is less than total sales of the product. So, total sales must be less than $8, 75,000 for the company to earn the profit.
For an example, if the organization reduces the variable cost to 5, 00,000.
Then, Total cost = Annual Fixed cost + Variable cost
= 2, 00,000 + 5, 00,000
= $7, 00,000
So, Profit = Total sales - Total cost
= 8, 75,000 - 7, 00,000
= $1, 25,000
So, the company will maintain total cost of $7, 00,000 to earn the profit of $1, 25,000.
Without reducing the total cost, company cannot generate the profit and pay the administrative cost, utility, salary to the workers and rents.
Moreover, without reducing the above operating expenses, the company may not sustain the sales operations and forecast the profitable sales for the upcoming periods.
Total fixed cost per year is $2, 00,000. Selling value of Product is $ 250, and total variable cost per unit is $200. Sales of upcoming year = $ 12, 50,000.
Step 1: Calculate the break even quantity.
Break even quantity is the division of annual fixed cost to the difference of selling price per unit and variable cost per unit.
Break even quantity =
= = 4,000So, Break even quantity (BEQ) is $4,000.
Step 2: Calculate the revenue from the BEQ of step 1.
Revenue is the product of break-even quantity and selling price per unit.
Revenue = Break even quantity x selling price per unit
= 4,000 x 250
= 10, 00,000
So, revenue from the BEQ is $ 10, 00,000.
Step 3: Calculate the variable cost from the BEQ in step 2.
Variable cost is the product of break-even quantity and variable cost per unit.
Variable cost = Break even quantity x variable cost per unit
= 4,000 x 200
= 8, 00,000
So, variable cost from the BEQ is $ 8, 00,000.
Step 4: Calculate the total cost from the variable cost obtained in step 3.
Total cost = Annual Fixed cost + Variable cost in step 2
= 2, 00,000 + 8, 00,000
= 10, 00,000
So, total cost is $ 10, 00,000.
Step 5: Calculate the profit from the total cost obtained in step 4. From the problem, annual sales are $ 12, 50,000.
So, Profit = Total sales - Total cost in step 3
= 12, 50,000 - 10, 00,000
= 2, 50,000
Hence, company has expected profit of $2, 50,000 from the total costs of $10, 00,000.
Break Even Point:
Break-even point is the represents the total cost and total revenue meets with the point of intersection. The break-even point will examine the quantity and revenue to capture the total cost of the product. Here, the total cost includes fixed and variable costs. Below figure shows the graph having quantity at x-axis, and cost at y-axis. The graph includes the lines of total cost, fixed cost, and revenue.
Here, blue line indicates the revenue; yellow line indicates the total cost, red line indicates fixed cost, dotted line from the point of intersection indicates break-even quantity at x-axis, and revenue at y-axis.Calculating the profit from the total cost obtained in step 4.
From the problem, annual sales are $ 8, 75,000.
So, Profit = Total sales - Total cost in step 3
= 8, 75,000 - 10, 00,000
= -1, 25,000
Here, company has a loss of $1, 25,000 from the sales forecast of $8, 75,000.
The company will not shut down when the total cost of the operation is less than total sales of the product. So, total sales must be less than $8, 75,000 for the company to earn the profit.
For an example, if the organization reduces the variable cost to 5, 00,000.
Then, Total cost = Annual Fixed cost + Variable cost
= 2, 00,000 + 5, 00,000
= $7, 00,000
So, Profit = Total sales - Total cost
= 8, 75,000 - 7, 00,000
= $1, 25,000
So, the company will maintain total cost of $7, 00,000 to earn the profit of $1, 25,000.
Without reducing the total cost, company cannot generate the profit and pay the administrative cost, utility, salary to the workers and rents.
Moreover, without reducing the above operating expenses, the company may not sustain the sales operations and forecast the profitable sales for the upcoming periods.
4
Discuss the idea of drawing separate demand curves for different market segments. It seems logical because each target market should have its own marketing mix. But won't this lead to many demand curves and possible prices? And what will this mean with respect to functional discounts and varying prices in the marketplace? Will it be legal? Will it be practical?
Unlock Deck
Unlock for access to all 14 flashcards in this deck.
Unlock Deck
k this deck
5
Distinguish between leader pricing and bait pricing. What do they have in common? How can their use affect a marketing mix?
Unlock Deck
Unlock for access to all 14 flashcards in this deck.
Unlock Deck
k this deck
6
Cite a local example of psychological pricing and evaluate whether it makes sense.
Unlock Deck
Unlock for access to all 14 flashcards in this deck.
Unlock Deck
k this deck
7
Cite a local example of odd-even pricing and evaluate whether it makes sense.
Unlock Deck
Unlock for access to all 14 flashcards in this deck.
Unlock Deck
k this deck
8
How does a prestige pricing policy fit into a marketing mix? Would exclusive distribution be necessary?
Unlock Deck
Unlock for access to all 14 flashcards in this deck.
Unlock Deck
k this deck
9
Is a full-line pricing policy available only to producers? Cite local examples of full-line pricing. Why is full-line pricing important?
Unlock Deck
Unlock for access to all 14 flashcards in this deck.
Unlock Deck
k this deck
10
This problem lets you see the dynamics of break-even analysis. The starting values (costs, revenues, etc.) for this problem are from the break-even analysis example in this chapter (see Exhibit 17-8).
The first column computes a break-even point. You can change costs and prices to figure new break-even points (in units and dollars). The second column goes further. There you can specify target profit level, and the unit and dollar sales needed to achieve your target profit level will be computed. You can also estimate possible sales quantities, and the program will compute costs, sales, and profits. Use this spreadsheet to address the following issues.
a. Vary the selling price between $1.00 and $1.40. Prepare a table showing how the break-even point (in units and dollars) changes at the different price levels.
b. If you hope to earn a target profit of $15,000, how many units would you have to sell? What would total cost be? Total sales dollars? (Note: Use the right-hand ["profit analysis"] column in the spreadsheet.)
c. Using the "profit analysis" column (column 2), allow your estimate of the sales quantity to vary between 64,000 and 96,000. Prepare a table that shows, for each quantity level, what happens to average cost per unit and profit. Explain why average cost changes as it does over the different quantity values.
Unlock Deck
Unlock for access to all 14 flashcards in this deck.
Unlock Deck
k this deck
11
The Marketing Plan Coach software on the text Web site includes a sample marketing plan for Hillside Veterinary Clinic. Look through the "Marketing Strategy" section.
a. A veterinary clinic must have some system for dealing with emergencies that occur on weekends and at night when the clinic is closed. Individual vets usually rotate so that someone is always on call to handle emergencies. The price for emergency care is usually 50 percent higher than the price for care during normal hours. Do you think that Hillside should charge higher prices for emergency care? Does it fit with Hillside's strategy?
b. Some customers have expensive pedigree dogs and cats and are less price sensitive than others about fees for veterinary care. Do you think that it would be possible for Hillside to charge higher prices in caring for expensive pets? Why or why not?
Unlock Deck
Unlock for access to all 14 flashcards in this deck.
Unlock Deck
k this deck
12
Why do many department stores seek a markup of about 30 percent when some discount houses operate on a 20 percent markup?
Unlock Deck
Unlock for access to all 14 flashcards in this deck.
Unlock Deck
k this deck
13
A producer distributed its riding lawn mowers through wholesalers and retailers. The retail selling price was $800, and the manufacturing cost to the company was $312. The retail markup was 35 percent and the wholesale markup 20 percent. ( a ) What was the cost to the wholesaler? To the retailer? ( b ) What percentage markup did the producer take?
Unlock Deck
Unlock for access to all 14 flashcards in this deck.
Unlock Deck
k this deck
14
Relate the concept of stock turnover to the growth of mass-merchandising. Use a simple example in your answer.
Unlock Deck
Unlock for access to all 14 flashcards in this deck.
Unlock Deck
k this deck
Unlock Deck
Unlock for access to all 14 flashcards in this deck.


