Deck 11: Other Chi-Square Tests
Full screen (f)
Question
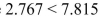
The critical chi-square value for 15 degrees of freedom when  and the test is right-tailed is 19.675.
and the test is right-tailed is 19.675. Question
Question
For two degrees of freedom, the value of a shown in the figure below is 0.05. 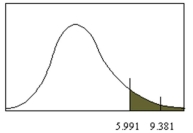
Question
An anatomy teacher hypothesizes that the final grades in her class are distributed as 10% A's, 23% B's, 45% C's, 14% D's, and 8% F's.What is the critical value if at the end of the semester she has the
Following grades? Use .
. 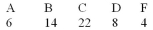
A)9.236
B)7.779
C)11.070
D)9.488
Following grades? Use
. A)9.236
B)7.779
C)11.070
D)9.488
Question
Question
The null hypothesis should not be rejected for the data given in the figure
below.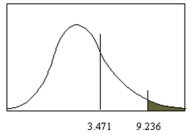
below.
Question
Question
Question
Question
Question
Question
Question
Question
Question
Question
Question
A contingency table is designated as  (columns times rows) table.
(columns times rows) table. Question
The degrees of freedom for a  contingency table would be 24.
contingency table would be 24. Question
Question
The computational procedure for homogeneity of proportions differs from that of the test of independence
in that it takes into account the standard deviation.
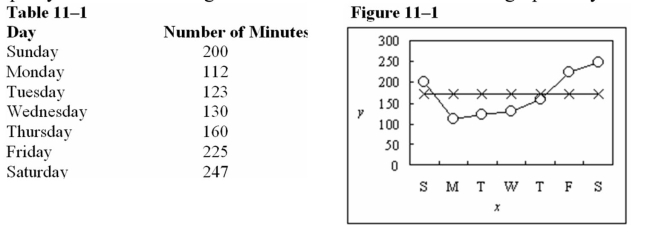
A sociologist wanted to determine whether there was a difference in the amount of time children aged 5-
7 spent watching television each day.Check the following data for evidence that the number of minutes
spent watching television is equally distributed throughout the week.The data is shown graphically in
Figure 11-1.Use
in that it takes into account the standard deviation.
A sociologist wanted to determine whether there was a difference in the amount of time children aged 5-
7 spent watching television each day.Check the following data for evidence that the number of minutes
spent watching television is equally distributed throughout the week.The data is shown graphically in
Figure 11-1.Use
Question
A four-year university has decided to implement a new approach to teaching statistics.Full-time and
adjunct professors were surveyed to determine whether they preferred the traditional lecture approach or
a computer approach for teaching statistics.Use hypothesis testing to test the independence of opinion
between the two groups.Table 11-3

What is the expected value of an adjunct professor who prefers to lecture?
A)7.33
B)11.67
C)21.50
D)9.83
adjunct professors were surveyed to determine whether they preferred the traditional lecture approach or
a computer approach for teaching statistics.Use hypothesis testing to test the independence of opinion
between the two groups.Table 11-3
What is the expected value of an adjunct professor who prefers to lecture?
A)7.33
B)11.67
C)21.50
D)9.83
Question
A four-year university has decided to implement a new approach to teaching statistics.Full-time and
adjunct professors were surveyed to determine whether they preferred the traditional lecture approach or
a computer approach for teaching statistics.Use hypothesis testing to test the independence of opinion
between the two groups.Table 11-3
What is the expected value of an adjunct professor who prefers computer instruction?
A)21.50
B)13.50
C)11.67
D)9.83
Question
A random group of used books was selected from a book warehouse to analyze the books' condition. The book store believes that 26% of the books are in excellent condition, 36% are in very good condition,
21% are in fair condition, and 17% are in poor condition.Is there evidence to reject this hypothesis at = .05?
A)There is not evidence to reject the claim that the books are distributed as claimed because the test value

B)There is evidence to reject the claim that the books are distributed as claimed because the test value

C)There is not evidence to reject the claim that the books are distributed as claimed because the test value
D)There is evidence to reject the claim that the books are distributed as claimed because the test value
21% are in fair condition, and 17% are in poor condition.Is there evidence to reject this hypothesis at = .05?
A)There is not evidence to reject the claim that the books are distributed as claimed because the test value
B)There is evidence to reject the claim that the books are distributed as claimed because the test value
C)There is not evidence to reject the claim that the books are distributed as claimed because the test value
D)There is evidence to reject the claim that the books are distributed as claimed because the test value
Question
A shoe salesman wants to see if his female customers have a preference in the colour of shoe purchased. What is the test statistici for the following data? 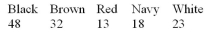
A)28.31
B)16.77
C)26.80
D)21.50
A)28.31
B)16.77
C)26.80
D)21.50
Question
A random group of apartments was selected from a city to analyze the number of bedrooms they have.Is there evidence to reject the hypothesis that the apartments are equally
Distributed between 1-bedroom, 2-bedroom, and 3-bedroom apartments, at ?
?

A) There is evidence to reject the claim that the apartments are equally distributed between the three sizes because the test value
B) There is not evidence to reject the claim that the apartments are equally distributed between the three sizes because the test value
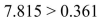
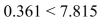
C) There is evidence to reject the claim that the apartments are equally distributed between the three sizes because the test value 11.506 > 7.815
D) There is not evidence to reject the claim that the apartments are equally distributed between the three sizes because the test value 7.815 < 11.506
Distributed between 1-bedroom, 2-bedroom, and 3-bedroom apartments, at
?A) There is evidence to reject the claim that the apartments are equally distributed between the three sizes because the test value
B) There is not evidence to reject the claim that the apartments are equally distributed between the three sizes because the test value
C) There is evidence to reject the claim that the apartments are equally distributed between the three sizes because the test value 11.506 > 7.815
D) There is not evidence to reject the claim that the apartments are equally distributed between the three sizes because the test value 7.815 < 11.506
Question
A random group of students was selected from a large student conference to analyze their class in school. Is there evidence to reject the hypothesis that the number of students is equally distributed between the
Four classes, at = .05?
A) There is evidence to reject the claim that students are equally distributed between the four classes because the test value
B) There is not evidence to reject the claim that students are equally distributed between the four classes because the test value
C) There is evidence to reject the claim that students are equally distributed between the four classes because the test value
D) There is not evidence to reject the claim that students are equally distributed between the four classes because the test value
Question
A health club has six tennis courts.The owner hypothesizes that his patrons have no preference for a particular court.He observes how many people play on each court on a particular day.What is the
Expected value for the data shown below?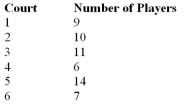
A)9.5
B)4.37
C)5.72
D)10.3
Expected value for the data shown below?
A)9.5
B)4.37
C)5.72
D)10.3
Question
Monica, a chef at a 5-star restaurant, makes eight different desserts.She wants to see if the customers
prefer any specific dessert over another.She keeps a record of desserts ordered over the course of several
weeks.At
 , check to see if the desserts being ordered are equally distributed.Table 11-2
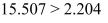
What is the critical value?
A)20.090
B)13.362
C)14.067
D)15.507
prefer any specific dessert over another.She keeps a record of desserts ordered over the course of several
weeks.At
, check to see if the desserts being ordered are equally distributed.Table 11-2What is the critical value?
A)20.090
B)13.362
C)14.067
D)15.507
Question
A random group of seniors was selected from a university and asked about their plans for the following year.The school advising office claims that 50% of the students plan to work, 30% of the students plan
To continue in school, and 20% of the students plan to take some time off.Is there evidence to reject this
Hypothesis at = .05?
A)There is not evidence to reject the claim that the students' plans are distributed as claimed because the test valu

B)There is evidence to reject the claim that the students' plans are distributed as claimed because the test value
C)There is not evidence to reject the claim that the students' plans are distributed as claimed because the test value
D)There is evidence to reject the claim that the students' plans are distributed as claimed because the test value

To continue in school, and 20% of the students plan to take some time off.Is there evidence to reject this
Hypothesis at = .05?
A)There is not evidence to reject the claim that the students' plans are distributed as claimed because the test valu
B)There is evidence to reject the claim that the students' plans are distributed as claimed because the test value
C)There is not evidence to reject the claim that the students' plans are distributed as claimed because the test value
D)There is evidence to reject the claim that the students' plans are distributed as claimed because the test value
Question
Question
Monica, a chef at a 5-star restaurant, makes eight different desserts.She wants to see if the customers
prefer any specific dessert over another.She keeps a record of desserts ordered over the course of several
weeks.At
, check to see if the desserts being ordered are equally distributed.Table 11-2
What is the expected value?
A)38
B)25
C)30
D)28
prefer any specific dessert over another.She keeps a record of desserts ordered over the course of several
weeks.At
, check to see if the desserts being ordered are equally distributed.Table 11-2What is the expected value?
A)38
B)25
C)30
D)28
Question
A random group of students was asked to name their favourite type of music.The campus radio station believes that 20% of the students prefer rap, 22% prefer rock, 21% prefer country,
11% prefer new age, and 26% prefer oldies.Is there evidence to reject this hypothesis at = .05?
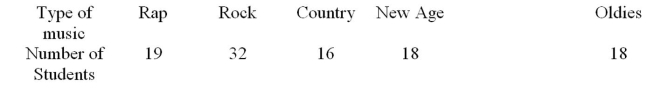
A)There is not evidence to reject the claim that the favourite music types are distributed as claimed
Because the test value
B)There is evidence to reject the claim that the favourite music types are distributed as claimed because the test value

C)There is not evidence to reject the claim that the favourite music types are distributed as claimed
Because the test valu

D)There is evidence to reject the claim that the favourite music types are distributed as claimed because
The test value
11% prefer new age, and 26% prefer oldies.Is there evidence to reject this hypothesis at = .05?
A)There is not evidence to reject the claim that the favourite music types are distributed as claimed
Because the test value
B)There is evidence to reject the claim that the favourite music types are distributed as claimed because the test value
C)There is not evidence to reject the claim that the favourite music types are distributed as claimed
Because the test valu
D)There is evidence to reject the claim that the favourite music types are distributed as claimed because
The test value
Question
Given that a contingency table has dimensions of 5 X 5 , what is the critical value of chi-square at  = 0.05?
A)37.652
B)26.296
C)31.410
D)36.415
= 0.05?A)37.652
B)26.296
C)31.410
D)36.415
Question
A four-year university has decided to implement a new approach to teaching statistics.Full-time and
adjunct professors were surveyed to determine whether they preferred the traditional lecture approach or
a computer approach for teaching statistics.Use hypothesis testing to test the independence of opinion
between the two groups.Table 11-3
What is the expected value of a full-time professor who has no preference?
A)13.50
B)9.83
C)6.17
D)7.33
Question
Monica, a chef at a 5-star restaurant, makes eight different desserts.She wants to see if the customers
prefer any specific dessert over another.She keeps a record of desserts ordered over the course of several
weeks.At
, check to see if the desserts being ordered are equally distributed.Table 11-2
What is the test statistic?
A)9.14
B)23.21
C)17.86
D)16.36
prefer any specific dessert over another.She keeps a record of desserts ordered over the course of several
weeks.At
, check to see if the desserts being ordered are equally distributed.Table 11-2What is the test statistic?
A)9.14
B)23.21
C)17.86
D)16.36
Question
Monica, a chef at a 5-star restaurant, makes eight different desserts.She wants to see if the customers
prefer any specific dessert over another.She keeps a record of desserts ordered over the course of several
weeks.At
, check to see if the desserts being ordered are equally distributed.Table 11-2
State what the alternative hypothesis would be.
A) Customers show a preference for a specific dessert.
B) Customers show no preference for a specific dessert.
C) Customers show a preference for four desserts.
D) Customers do not order dessert.
prefer any specific dessert over another.She keeps a record of desserts ordered over the course of several
weeks.At
, check to see if the desserts being ordered are equally distributed.Table 11-2State what the alternative hypothesis would be.
A)
Customers show a preference for a specific dessert.B)
Customers show no preference for a specific dessert.C)
Customers show a preference for four desserts.D)
Customers do not order dessert. Question
A random sample of oranges was selected from an orchard to analyze the oranges' ripeness.Based on the time of year, the orchard owner believes that 20% of the oranges are ready for picking now, 40%
Will be ready in three days, 20% will be ready in one week, and 20% will be ready in two weeks.Is there
Evidence to reject this hypothesis at = .05?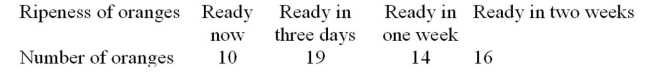
A)There is not evidence to reject the claim that the oranges are distributed as claimed because the test value

B)There is evidence to reject the claim that the oranges are distributed as claimed because the test value
C)There is not evidence to reject the claim that the oranges are distributed as claimed because the test value

D)There is evidence to reject the claim that the oranges are distributed as claimed because the test value

Will be ready in three days, 20% will be ready in one week, and 20% will be ready in two weeks.Is there
Evidence to reject this hypothesis at = .05?
A)There is not evidence to reject the claim that the oranges are distributed as claimed because the test value
B)There is evidence to reject the claim that the oranges are distributed as claimed because the test value
C)There is not evidence to reject the claim that the oranges are distributed as claimed because the test value
D)There is evidence to reject the claim that the oranges are distributed as claimed because the test value
Question
A random group of desktop computer sales was selected from an electronic discount chain to analyze the size of monitor purchased with the computer.Is there evidence to reject the
Hypothesis that the number of monitors is equally distributed between the five types, at = .05?

A) There is evidence to reject the claim that the monitors are equally distributed between the five classes because the test value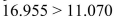
B) There is not evidence to reject the claim that the monitors are equally distributed between the five classes because the test value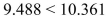
C) There is evidence to reject the claim that the monitors are equally distributed between the five classes because the test value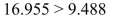
D) There is not evidence to reject the claim that the monitors are equally distributed between the five classes because the test value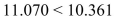
Hypothesis that the number of monitors is equally distributed between the five types, at = .05?
A) There is evidence to reject the claim that the monitors are equally distributed between the five classes because the test value
B) There is not evidence to reject the claim that the monitors are equally distributed between the five classes because the test value
C) There is evidence to reject the claim that the monitors are equally distributed between the five classes because the test value
D) There is not evidence to reject the claim that the monitors are equally distributed between the five classes because the test value
Question
A chewing gum manufacturer wishes to determine if his customers prefer one flavour of gum to any other flavour.He selects a random sample of customers and records the flavour of gum that is purchased.What
Is the test statistic for the data given?
A)6.18
B)29.5
C)11.56
D)18.0
Is the test statistic for the data given?
A)6.18
B)29.5
C)11.56
D)18.0
Question
A random group of customers at a fast food chain was asked whether they preferred hamburgers, chicken sandwiches, or fish sandwiches.The restaurant's marketing department claims that 50%
Of customers prefer hamburgers, 32% of the customers prefer chicken sandwiches, and 18%
Of the customers prefer fish sandwiches.Is there evidence to reject this hypothesis at = .05?

A) There is evidence to reject the claim that the customers' preferences are distributed as claimed because the test value
B) There is not evidence to reject the claim that the customers' preferences are distributed as claimed because the test value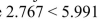
C)There is evidence to reject the claim that the customers' preferences are distributed as claimed because the test value

D) There is not evidence to reject the claim that the customers' preferences are distributed as claimed because the test value
Of customers prefer hamburgers, 32% of the customers prefer chicken sandwiches, and 18%
Of the customers prefer fish sandwiches.Is there evidence to reject this hypothesis at = .05?
A) There is evidence to reject the claim that the customers' preferences are distributed as claimed because the test value
B) There is not evidence to reject the claim that the customers' preferences are distributed as claimed because the test value
C)There is evidence to reject the claim that the customers' preferences are distributed as claimed because the test value
D) There is not evidence to reject the claim that the customers' preferences are distributed as claimed because the test value
Question
Two allergists recorded the main area of allergy for new patients during one month.At = .05, test the claim that the allergy diagnosis and the doctor that treated the patients are
Independent.
A)There is not evidence to reject the claim that the allergy diagnosis and the doctor are not related
Because the test value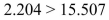
B)There is not evidence to reject the claim that the allergy diagnosis and the doctor are not related
Because the test value
C)There is evidence to reject the claim that the allergy diagnosis and the doctor are not related because the test value

D)There is evidence to reject the claim that the allergy diagnosis and the doctor are not related because the test value
Independent.
A)There is not evidence to reject the claim that the allergy diagnosis and the doctor are not related
Because the test value
B)There is not evidence to reject the claim that the allergy diagnosis and the doctor are not related
Because the test value
C)There is evidence to reject the claim that the allergy diagnosis and the doctor are not related because the test value
D)There is evidence to reject the claim that the allergy diagnosis and the doctor are not related because the test value
Question
Question
Two computer stores recorded the number of computers sold in a week along with the sizes of their hard drives.At = .05, test the claim that the distribution of hard drives and the store where the computers were
Bought are not related.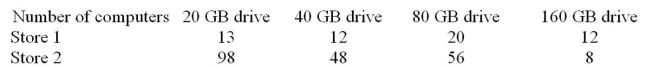
A)There is evidence to reject the claim that the size of hard drive sold and the store number are not related
Because the test value
B)There is evidence to reject the claim that the size of hard drive sold and the store number are not related
Because the test value
C)There is not evidence to reject the claim that the size of hard drive sold and the store number are not
Related because the test value
D)There is not evidence to reject the claim that the size of hard drive sold and the store number are not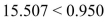
Question
A software company wants to determine whether there is a relationship between their three sales offices and the sales of their software products.The actual sales results
Are: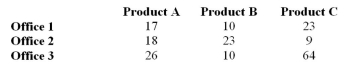 Under the null hypothesis, what is the expected amount of Product A that would be sold by Office 2?
A)12.20
B)15.25
C)20.33
D)30.50
Are:
Under the null hypothesis, what is the expected amount of Product A that would be sold by Office 2?A)12.20
B)15.25
C)20.33
D)30.50
Question
A biologist had mice and rats run through a maze and recorded the number that finished the maze successfully and the number that did not.This table lists the results of the study.
At = .05, test the claim that the rodent type and the success of finishing the maze are not
Related.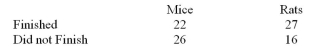
A)There is evidence to reject the claim that the rodent type and the success of finishing the maze are not
Related because the test value
B)There is evidence to reject the claim that the rodent type and the success of finishing the maze are not
Related because the test value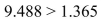
C)There is not evidence to reject the claim that the rodent type and the success of finishing the maze are
Not related because the test value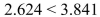
D)There is not evidence to reject the claim that the rodent type and the success of finishing the maze are
Not related because the test value
Question
Question
An insurance representative wants to determine if the proportions of women and men who buy different policy types are the same.The actual sales results for 50 women and 50 men
Are: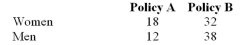
Under the null hypothesis, what is the expected number of men who would buy Policy B?
A)25
B)30
C)35
D)50
Are:
Under the null hypothesis, what is the expected number of men who would buy Policy B?
A)25
B)30
C)35
D)50
Question
This table lists the number of students from three different high schools participating in the mathematics and physics sections of a science fair.At = .05, test the claim that
The section of participation and the high school where the students were from are
Independent.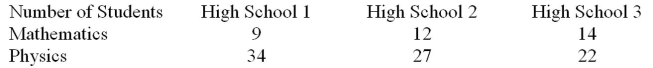
A)There is evidence to reject the claim that the high school and the section of participation are
Independent because the test value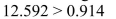
B)There is not evidence to reject the claim that the high school and the section of participation are
Independent because the test valu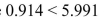
C)There is evidence to reject the claim that the high school and the section of participation are
Independent because the test value
D)There is not evidence to reject the claim that the high school and the section of participation are
Independent because the test value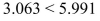
Question
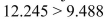
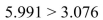
A marketing company selected a sample of 25 lawyers and 25 doctors to determine if they had voted in the last election.At = .05, test the claim that the proportions of lawyers and doctors who voted are
Equal.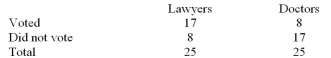
A)There is not evidence to reject the claim that the proportions are equal because the test value 3.841 <1.440
B)There is evidence to reject the claim that the proportions are equal because the test value 6.480 > 3.841
C)There is evidence to reject the claim that the proportions are equal because the test value 6.480 > 9.488
D)There is not evidence to reject the claim that the proportions are equal because the test value 9.488 <1.440
Question
Cattle are classified according to age (young, medium, and old) and carcass quality (grades A, B, and C).In one study, the animals were classified
As: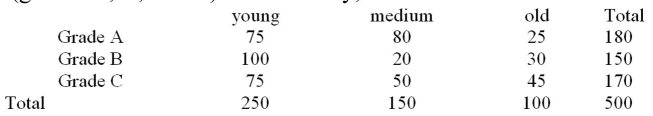 The chi-square statistic for testing if there is an association between age and carcass quality was
Calculated.What is the expected frequency for the (2,2) cell?
A)26
B)45
C)60
D)90
As:
The chi-square statistic for testing if there is an association between age and carcass quality wasCalculated.What is the expected frequency for the (2,2) cell?
A)26
B)45
C)60
D)90
Question
Cattle are classified according to age (young, medium, and old) and as to carcass quality (grades A, B, and C).In one study, the animals were classified
As: The chi-square statistic for testing if there is an association between age and grade was calculated.The
Null hypothesis being tested is:
A)P(grade and age) = P(grade) P(age)
B)
C)Grade and age classifications are dependent
D)Age depends on grade
As:
The chi-square statistic for testing if there is an association between age and grade was calculated.TheNull hypothesis being tested is:
A)P(grade and age) = P(grade) P(age)
B)
C)Grade and age classifications are dependent
D)Age depends on grade
Question
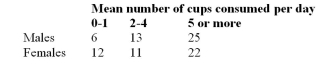
A researcher wishes to determine if there is a relationship between the age of working individuals and the amount of coffee consumed.The following data were obtained for the number of cups of coffee
Consumed per day: Choose the best option from the choices below:
A)A z-test statistic could be used to test the null hypothesis.
B)A chi-square test statistic could be used to test the null hypothesis.
C)Either a z-test or a chi-square test could be used to test the null hypothesis.
D)A t-test statistic could be used to test the null hypothesis.
Consumed per day:
Choose the best option from the choices below:A)A z-test statistic could be used to test the null hypothesis.
B)A chi-square test statistic could be used to test the null hypothesis.
C)Either a z-test or a chi-square test could be used to test the null hypothesis.
D)A t-test statistic could be used to test the null hypothesis.
Question
A researcher selected a sample of 50 residents from each of three different cities to determine if citizens were willing to participate in a medical experiment.At = .05, test the claim that the proportions who will
Participate are equal.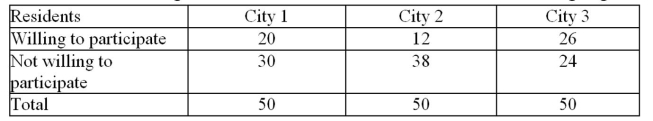
A)There is not evidence to reject the claim that the proportions are equal because the test value 12.592 1.237
1.237
B)There is not evidence to reject the claim that the proportions are equal because the test value 8.321 5.991
5.991
C)There is not evidence to reject the claim that the proportions are equal because the test value 1.237 5.99
5.99
D)There is evidence to reject the claim that the proportions are equal because the test value 8.32 5.991
5.991
Participate are equal.
A)There is not evidence to reject the claim that the proportions are equal because the test value 12.592
1.237B)There is not evidence to reject the claim that the proportions are equal because the test value 8.321
5.991C)There is not evidence to reject the claim that the proportions are equal because the test value 1.237
5.99D)There is evidence to reject the claim that the proportions are equal because the test value 8.32
5.991 Question
A quality control supervisor selected a sample of 100 electronic components from each of three different production chains to determine if the production chains had the same
Rates of meeting their quality standards.At = .05, test the claim that the proportions are
Equal.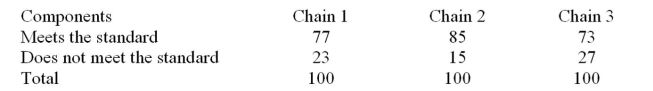
A)There is evidence to reject the claim that the proportions are equal because the test value 12.592 0.786
0.786
B)There is not evidence to reject the claim that the proportions are equal because the test value 4.399 5.991
5.991
C)There is evidence to reject the claim that the proportions are equal because the test value 5.991 0.786
0.786
D)There is evidence to reject the claim that the proportions are equal because the test value 4.399 5.991
5.991
Rates of meeting their quality standards.At = .05, test the claim that the proportions are
Equal.
A)There is evidence to reject the claim that the proportions are equal because the test value 12.592
0.786B)There is not evidence to reject the claim that the proportions are equal because the test value 4.399
5.991C)There is evidence to reject the claim that the proportions are equal because the test value 5.991
0.786D)There is evidence to reject the claim that the proportions are equal because the test value 4.399
5.991 Question
Cattle are classified according to age (young, medium, and old) and carcass quality (grades A, B, and C).In one study, the animals were classified
As: The chi-square statistic for testing if there is an association between age and grade was calculated.The
Rejection region for this test is
A)
B)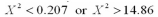
C)
D)
As:
The chi-square statistic for testing if there is an association between age and grade was calculated.TheRejection region for this test is
A)
B)
C)
D)
Question
A four-year university has decided to implement a new approach to teaching statistics.Full-time and
adjunct professors were surveyed to determine whether they preferred the traditional lecture approach or
a computer approach for teaching statistics.Use hypothesis testing to test the independence of opinion
between the two groups.Table 11-3
What is the test value?
A)0.36
B)0.97
C)0.14
D)1.24
adjunct professors were surveyed to determine whether they preferred the traditional lecture approach or
a computer approach for teaching statistics.Use hypothesis testing to test the independence of opinion
between the two groups.Table 11-3
What is the test value?
A)0.36
B)0.97
C)0.14
D)1.24
Question
Chicken, hot dogs, and hamburgers were served during a recent barbecue.The host assumed that there would be no difference between what the women chose to eat and what the men chose to eat.What is the
Test value for the following data?
A)1.596
B)4.140
C)1.686
D)5.769
Test value for the following data?
A)1.596
B)4.140
C)1.686
D)5.769
Question
A study was performed at a university to analyze whether the preference for hamburgers or fried chicken is related to the gender of the student.This table lists the results of the
Study.At = .05, test the claim that the meal preference and the gender of the student are not
Related.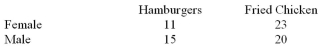
A)There is evidence to reject the claim that the meal preference and the gender of the student are not
Related because the test value
B)There is evidence to reject the claim that the meal preference and the gender of the student are not
Related because the test value
C)There is not evidence to reject the claim that the meal preference and the gender of the student are not
Related because the test value
D)There is not evidence to reject the claim that the meal preference and the gender of the student are not
Related because the test value
Question
A product testing laboratory selected a sample of 20 printers from two different manufacturers to determine if they could print more than 100,000 pages without breaking down.At = .05, test the claim
That the proportions of printers from Manufacturer 1 and Manufacturer 2 that lasted for more than
100,000 pages are equal.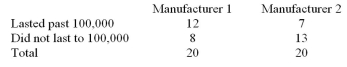
A)There is not evidence to reject the claim that the proportions are equal because the test value 2.506 3.841
3.841
B)There is evidence to reject the claim that the proportions are equal because the test value 3.841 1.003
1.003
C)There is not evidence to reject the claim that the proportions are equal because the test value 2.506 9.488
9.488
D)There is not evidence to reject the claim that the proportions are equal because the test value 9.488 1.003
1.003
That the proportions of printers from Manufacturer 1 and Manufacturer 2 that lasted for more than
100,000 pages are equal.
A)There is not evidence to reject the claim that the proportions are equal because the test value 2.506
3.841B)There is evidence to reject the claim that the proportions are equal because the test value 3.841
1.003C)There is not evidence to reject the claim that the proportions are equal because the test value 2.506
9.488D)There is not evidence to reject the claim that the proportions are equal because the test value 9.488
1.003 Question
The following table lists the sugar content of two types of apples from three different orchards.At = .05, test the claim that the sugar content of the apples and the orchard where they were grown are not
Related.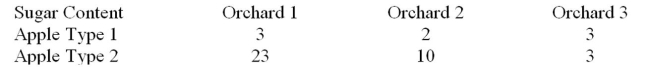
A)There is evidence to reject the claim that the sugar content of the apple type and the orchard number are
Not related because the test value
B)There is not evidence to reject the claim that the sugar content of the apple type and the orchard number
Are not related because the test valu
C)There is evidence to reject the claim that the sugar content of the apple type and the orchard number are
Not related because the test value
D)There is not evidence to reject the claim that the sugar content of the apple type and the orchard number
Are not related because the test value
Question
A researcher wishes to determine if there is a relationship between the sex of an individual and
the amount of coffee consumed.The following data was obtained for the number of cups of coffee
consumed.What is the expected value of
the amount of coffee consumed.The following data was obtained for the number of cups of coffee
consumed.What is the expected value of
Question
Question
Question
Six different brands of popcorn were tested for popping.Two hundred kernels of each brand were
popped, and the number of kernels that did not pop was counted.Determine the expected value and then
plot it on a graph with the observed values.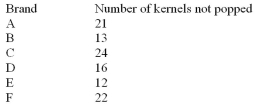
popped, and the number of kernels that did not pop was counted.Determine the expected value and then
plot it on a graph with the observed values.
Question
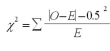 The method that uses the formula is called the __________ correction for
continuity.
Question
Question
The degrees of freedom for a  contingency table are __________.
________________________________________
contingency table are __________.________________________________________
Question
Question
The dean of a local school wants to determine if the grade distribution is independent of
the subject matter taught.How many degrees of freedom does this contingency table have?
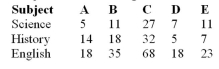
the subject matter taught.How many degrees of freedom does this contingency table have?

Unlock Deck
Sign up to unlock the cards in this deck!
Unlock Deck
Unlock Deck
1/69
Play
Full screen (f)
Deck 11: Other Chi-Square Tests
1
The critical chi-square value for 15 degrees of freedom when and the test is right-tailed is 19.675.
and the test is right-tailed is 19.675.False
2
Before computing the test value, one must state the hypothesis.
True
3
For two degrees of freedom, the value of a shown in the figure below is 0.05.
True
4
An anatomy teacher hypothesizes that the final grades in her class are distributed as 10% A's, 23% B's, 45% C's, 14% D's, and 8% F's.What is the critical value if at the end of the semester she has the
Following grades? Use .
A)9.236
B)7.779
C)11.070
D)9.488
Following grades? Use
. A)9.236
B)7.779
C)11.070
D)9.488
Unlock Deck
Unlock for access to all 69 flashcards in this deck.
Unlock Deck
k this deck
5
What is the null hypothesis?
A)Children spend the same amount of time watching TV each day.
B)Children spend different amounts of time watching TV each day.
C)Children spend more time watching TV on weekends.
D)Children spend less than 2.6 hours a day watching TV.
A)Children spend the same amount of time watching TV each day.
B)Children spend different amounts of time watching TV each day.
C)Children spend more time watching TV on weekends.
D)Children spend less than 2.6 hours a day watching TV.
Unlock Deck
Unlock for access to all 69 flashcards in this deck.
Unlock Deck
k this deck
6
The null hypothesis should not be rejected for the data given in the figure
below.
below.
Unlock Deck
Unlock for access to all 69 flashcards in this deck.
Unlock Deck
k this deck
7
The test of homogeneity of proportions is used to determine whether the proportions for a variable are
unequal when several samples are selected from different populations.
unequal when several samples are selected from different populations.
Unlock Deck
Unlock for access to all 69 flashcards in this deck.
Unlock Deck
k this deck
8
The test of independence of variables is used to determine whether two variables are independent of or
related to each other when a single sample is selected.
related to each other when a single sample is selected.
Unlock Deck
Unlock for access to all 69 flashcards in this deck.
Unlock Deck
k this deck
9
What is the expected value?
A)112
B)247
C)120
D)171
A)112
B)247
C)120
D)171
Unlock Deck
Unlock for access to all 69 flashcards in this deck.
Unlock Deck
k this deck
10
The chi-square goodness-of-fit test is always one-tailed left.
Unlock Deck
Unlock for access to all 69 flashcards in this deck.
Unlock Deck
k this deck
11
Frequencies obtained by calculation are called expected frequencies.
Unlock Deck
Unlock for access to all 69 flashcards in this deck.
Unlock Deck
k this deck
12
The chi-square independence test can be used to test the independence of two variables.
Unlock Deck
Unlock for access to all 69 flashcards in this deck.
Unlock Deck
k this deck
13
What is the test value?
A)2.82
B)100
C)72.12
D)33.78
A)2.82
B)100
C)72.12
D)33.78
Unlock Deck
Unlock for access to all 69 flashcards in this deck.
Unlock Deck
k this deck
14
What is the critical value?
A)18.475
B)16.812
C)12.592
D)14.067
A)18.475
B)16.812
C)12.592
D)14.067
Unlock Deck
Unlock for access to all 69 flashcards in this deck.
Unlock Deck
k this deck
15
In a chi-square goodness-of-fit test, when there is close agreement between the observed frequency and
the expected frequency, the chi-square test value will be small.
the expected frequency, the chi-square test value will be small.
Unlock Deck
Unlock for access to all 69 flashcards in this deck.
Unlock Deck
k this deck
16
A manager of a health club believes that 32% of the members joined his club in the winter, 24% joined in
the spring, 20% joined in the summer, and 24% joined in the fall.The number of memberships this year
shows that 110 joined in the winter, 70 joined in the spring, 60 in the summer, and 68 in the fall.The test
value for this scenario would be 2.05.
the spring, 20% joined in the summer, and 24% joined in the fall.The number of memberships this year
shows that 110 joined in the winter, 70 joined in the spring, 60 in the summer, and 68 in the fall.The test
value for this scenario would be 2.05.
Unlock Deck
Unlock for access to all 69 flashcards in this deck.
Unlock Deck
k this deck
17
A contingency table is designated as (columns times rows) table.
(columns times rows) table. Unlock Deck
Unlock for access to all 69 flashcards in this deck.
Unlock Deck
k this deck
18
The degrees of freedom for a contingency table would be 24.
contingency table would be 24. Unlock Deck
Unlock for access to all 69 flashcards in this deck.
Unlock Deck
k this deck
19
In a goodness-of-fit test, the degrees of freedom are equal to the number of categories minus two.
Unlock Deck
Unlock for access to all 69 flashcards in this deck.
Unlock Deck
k this deck
20
The computational procedure for homogeneity of proportions differs from that of the test of independence
in that it takes into account the standard deviation.
A sociologist wanted to determine whether there was a difference in the amount of time children aged 5-
7 spent watching television each day.Check the following data for evidence that the number of minutes
spent watching television is equally distributed throughout the week.The data is shown graphically in
Figure 11-1.Use
Unlock Deck
Unlock for access to all 69 flashcards in this deck.
Unlock Deck
k this deck
21
A four-year university has decided to implement a new approach to teaching statistics.Full-time and
adjunct professors were surveyed to determine whether they preferred the traditional lecture approach or
a computer approach for teaching statistics.Use hypothesis testing to test the independence of opinion
between the two groups.Table 11-3
What is the expected value of an adjunct professor who prefers to lecture?
A)7.33
B)11.67
C)21.50
D)9.83
Unlock Deck
Unlock for access to all 69 flashcards in this deck.
Unlock Deck
k this deck
22
A four-year university has decided to implement a new approach to teaching statistics.Full-time and
adjunct professors were surveyed to determine whether they preferred the traditional lecture approach or
a computer approach for teaching statistics.Use hypothesis testing to test the independence of opinion
between the two groups.Table 11-3
What is the expected value of an adjunct professor who prefers computer instruction?
A)21.50
B)13.50
C)11.67
D)9.83
Unlock Deck
Unlock for access to all 69 flashcards in this deck.
Unlock Deck
k this deck
23
A random group of used books was selected from a book warehouse to analyze the books' condition. The book store believes that 26% of the books are in excellent condition, 36% are in very good condition,
21% are in fair condition, and 17% are in poor condition.Is there evidence to reject this hypothesis at = .05?
A)There is not evidence to reject the claim that the books are distributed as claimed because the test value
B)There is evidence to reject the claim that the books are distributed as claimed because the test value
C)There is not evidence to reject the claim that the books are distributed as claimed because the test value
D)There is evidence to reject the claim that the books are distributed as claimed because the test value
Unlock Deck
Unlock for access to all 69 flashcards in this deck.
Unlock Deck
k this deck
24
A shoe salesman wants to see if his female customers have a preference in the colour of shoe purchased. What is the test statistici for the following data?
A)28.31
B)16.77
C)26.80
D)21.50
A)28.31
B)16.77
C)26.80
D)21.50
Unlock Deck
Unlock for access to all 69 flashcards in this deck.
Unlock Deck
k this deck
25
A random group of apartments was selected from a city to analyze the number of bedrooms they have.Is there evidence to reject the hypothesis that the apartments are equally
Distributed between 1-bedroom, 2-bedroom, and 3-bedroom apartments, at ?
A) There is evidence to reject the claim that the apartments are equally distributed between the three sizes because the test value
B) There is not evidence to reject the claim that the apartments are equally distributed between the three sizes because the test value
C) There is evidence to reject the claim that the apartments are equally distributed between the three sizes because the test value 11.506 > 7.815
D) There is not evidence to reject the claim that the apartments are equally distributed between the three sizes because the test value 7.815 < 11.506
Distributed between 1-bedroom, 2-bedroom, and 3-bedroom apartments, at
?A) There is evidence to reject the claim that the apartments are equally distributed between the three sizes because the test value
B) There is not evidence to reject the claim that the apartments are equally distributed between the three sizes because the test value
C) There is evidence to reject the claim that the apartments are equally distributed between the three sizes because the test value 11.506 > 7.815
D) There is not evidence to reject the claim that the apartments are equally distributed between the three sizes because the test value 7.815 < 11.506
Unlock Deck
Unlock for access to all 69 flashcards in this deck.
Unlock Deck
k this deck
26
A random group of students was selected from a large student conference to analyze their class in school. Is there evidence to reject the hypothesis that the number of students is equally distributed between the
Four classes, at = .05?
A) There is evidence to reject the claim that students are equally distributed between the four classes because the test value
B) There is not evidence to reject the claim that students are equally distributed between the four classes because the test value
C) There is evidence to reject the claim that students are equally distributed between the four classes because the test value
D) There is not evidence to reject the claim that students are equally distributed between the four classes because the test value
Four classes, at = .05?
A) There is evidence to reject the claim that students are equally distributed between the four classes because the test value
B) There is not evidence to reject the claim that students are equally distributed between the four classes because the test value
C) There is evidence to reject the claim that students are equally distributed between the four classes because the test value
D) There is not evidence to reject the claim that students are equally distributed between the four classes because the test value
Unlock Deck
Unlock for access to all 69 flashcards in this deck.
Unlock Deck
k this deck
27
A health club has six tennis courts.The owner hypothesizes that his patrons have no preference for a particular court.He observes how many people play on each court on a particular day.What is the
Expected value for the data shown below?
A)9.5
B)4.37
C)5.72
D)10.3
Expected value for the data shown below?
A)9.5
B)4.37
C)5.72
D)10.3
Unlock Deck
Unlock for access to all 69 flashcards in this deck.
Unlock Deck
k this deck
28
Monica, a chef at a 5-star restaurant, makes eight different desserts.She wants to see if the customers
prefer any specific dessert over another.She keeps a record of desserts ordered over the course of several
weeks.At
, check to see if the desserts being ordered are equally distributed.Table 11-2
What is the critical value?
A)20.090
B)13.362
C)14.067
D)15.507
prefer any specific dessert over another.She keeps a record of desserts ordered over the course of several
weeks.At
, check to see if the desserts being ordered are equally distributed.Table 11-2What is the critical value?
A)20.090
B)13.362
C)14.067
D)15.507
Unlock Deck
Unlock for access to all 69 flashcards in this deck.
Unlock Deck
k this deck
29
A random group of seniors was selected from a university and asked about their plans for the following year.The school advising office claims that 50% of the students plan to work, 30% of the students plan
To continue in school, and 20% of the students plan to take some time off.Is there evidence to reject this
Hypothesis at = .05?
A)There is not evidence to reject the claim that the students' plans are distributed as claimed because the test valu
B)There is evidence to reject the claim that the students' plans are distributed as claimed because the test value
C)There is not evidence to reject the claim that the students' plans are distributed as claimed because the test value
D)There is evidence to reject the claim that the students' plans are distributed as claimed because the test value
Unlock Deck
Unlock for access to all 69 flashcards in this deck.
Unlock Deck
k this deck
30
A contingency table has 5 rows and 4 columns.What are the degrees of freedom?
A)20
B)12
C)16
D)15
A)20
B)12
C)16
D)15
Unlock Deck
Unlock for access to all 69 flashcards in this deck.
Unlock Deck
k this deck
31
Monica, a chef at a 5-star restaurant, makes eight different desserts.She wants to see if the customers
prefer any specific dessert over another.She keeps a record of desserts ordered over the course of several
weeks.At
, check to see if the desserts being ordered are equally distributed.Table 11-2
What is the expected value?
A)38
B)25
C)30
D)28
prefer any specific dessert over another.She keeps a record of desserts ordered over the course of several
weeks.At
, check to see if the desserts being ordered are equally distributed.Table 11-2What is the expected value?
A)38
B)25
C)30
D)28
Unlock Deck
Unlock for access to all 69 flashcards in this deck.
Unlock Deck
k this deck
32
A random group of students was asked to name their favourite type of music.The campus radio station believes that 20% of the students prefer rap, 22% prefer rock, 21% prefer country,
11% prefer new age, and 26% prefer oldies.Is there evidence to reject this hypothesis at = .05?
A)There is not evidence to reject the claim that the favourite music types are distributed as claimed
Because the test value
B)There is evidence to reject the claim that the favourite music types are distributed as claimed because the test value
C)There is not evidence to reject the claim that the favourite music types are distributed as claimed
Because the test valu
D)There is evidence to reject the claim that the favourite music types are distributed as claimed because
The test value
Unlock Deck
Unlock for access to all 69 flashcards in this deck.
Unlock Deck
k this deck
33
Given that a contingency table has dimensions of 5 X 5 , what is the critical value of chi-square at = 0.05?
A)37.652
B)26.296
C)31.410
D)36.415
= 0.05?A)37.652
B)26.296
C)31.410
D)36.415
Unlock Deck
Unlock for access to all 69 flashcards in this deck.
Unlock Deck
k this deck
34
A four-year university has decided to implement a new approach to teaching statistics.Full-time and
adjunct professors were surveyed to determine whether they preferred the traditional lecture approach or
a computer approach for teaching statistics.Use hypothesis testing to test the independence of opinion
between the two groups.Table 11-3
What is the expected value of a full-time professor who has no preference?
A)13.50
B)9.83
C)6.17
D)7.33
Unlock Deck
Unlock for access to all 69 flashcards in this deck.
Unlock Deck
k this deck
35
Monica, a chef at a 5-star restaurant, makes eight different desserts.She wants to see if the customers
prefer any specific dessert over another.She keeps a record of desserts ordered over the course of several
weeks.At
, check to see if the desserts being ordered are equally distributed.Table 11-2
What is the test statistic?
A)9.14
B)23.21
C)17.86
D)16.36
prefer any specific dessert over another.She keeps a record of desserts ordered over the course of several
weeks.At
, check to see if the desserts being ordered are equally distributed.Table 11-2What is the test statistic?
A)9.14
B)23.21
C)17.86
D)16.36
Unlock Deck
Unlock for access to all 69 flashcards in this deck.
Unlock Deck
k this deck
36
Monica, a chef at a 5-star restaurant, makes eight different desserts.She wants to see if the customers
prefer any specific dessert over another.She keeps a record of desserts ordered over the course of several
weeks.At
, check to see if the desserts being ordered are equally distributed.Table 11-2
State what the alternative hypothesis would be.
A) Customers show a preference for a specific dessert.
B) Customers show no preference for a specific dessert.
C) Customers show a preference for four desserts.
D) Customers do not order dessert.
prefer any specific dessert over another.She keeps a record of desserts ordered over the course of several
weeks.At
, check to see if the desserts being ordered are equally distributed.Table 11-2State what the alternative hypothesis would be.
A)
Customers show a preference for a specific dessert.B)
Customers show no preference for a specific dessert.C)
Customers show a preference for four desserts.D)
Customers do not order dessert. Unlock Deck
Unlock for access to all 69 flashcards in this deck.
Unlock Deck
k this deck
37
A random sample of oranges was selected from an orchard to analyze the oranges' ripeness.Based on the time of year, the orchard owner believes that 20% of the oranges are ready for picking now, 40%
Will be ready in three days, 20% will be ready in one week, and 20% will be ready in two weeks.Is there
Evidence to reject this hypothesis at = .05?
A)There is not evidence to reject the claim that the oranges are distributed as claimed because the test value
B)There is evidence to reject the claim that the oranges are distributed as claimed because the test value
C)There is not evidence to reject the claim that the oranges are distributed as claimed because the test value
D)There is evidence to reject the claim that the oranges are distributed as claimed because the test value
Unlock Deck
Unlock for access to all 69 flashcards in this deck.
Unlock Deck
k this deck
38
A random group of desktop computer sales was selected from an electronic discount chain to analyze the size of monitor purchased with the computer.Is there evidence to reject the
Hypothesis that the number of monitors is equally distributed between the five types, at = .05?
A) There is evidence to reject the claim that the monitors are equally distributed between the five classes because the test value
B) There is not evidence to reject the claim that the monitors are equally distributed between the five classes because the test value
C) There is evidence to reject the claim that the monitors are equally distributed between the five classes because the test value
D) There is not evidence to reject the claim that the monitors are equally distributed between the five classes because the test value
Unlock Deck
Unlock for access to all 69 flashcards in this deck.
Unlock Deck
k this deck
39
A chewing gum manufacturer wishes to determine if his customers prefer one flavour of gum to any other flavour.He selects a random sample of customers and records the flavour of gum that is purchased.What
Is the test statistic for the data given?
A)6.18
B)29.5
C)11.56
D)18.0
Is the test statistic for the data given?
A)6.18
B)29.5
C)11.56
D)18.0
Unlock Deck
Unlock for access to all 69 flashcards in this deck.
Unlock Deck
k this deck
40
A random group of customers at a fast food chain was asked whether they preferred hamburgers, chicken sandwiches, or fish sandwiches.The restaurant's marketing department claims that 50%
Of customers prefer hamburgers, 32% of the customers prefer chicken sandwiches, and 18%
Of the customers prefer fish sandwiches.Is there evidence to reject this hypothesis at = .05?
A) There is evidence to reject the claim that the customers' preferences are distributed as claimed because the test value
B) There is not evidence to reject the claim that the customers' preferences are distributed as claimed because the test value
C)There is evidence to reject the claim that the customers' preferences are distributed as claimed because the test value
D) There is not evidence to reject the claim that the customers' preferences are distributed as claimed because the test value
Unlock Deck
Unlock for access to all 69 flashcards in this deck.
Unlock Deck
k this deck
41
Two allergists recorded the main area of allergy for new patients during one month.At = .05, test the claim that the allergy diagnosis and the doctor that treated the patients are
Independent.
A)There is not evidence to reject the claim that the allergy diagnosis and the doctor are not related
Because the test value
B)There is not evidence to reject the claim that the allergy diagnosis and the doctor are not related
Because the test value
C)There is evidence to reject the claim that the allergy diagnosis and the doctor are not related because the test value
D)There is evidence to reject the claim that the allergy diagnosis and the doctor are not related because the test value
Unlock Deck
Unlock for access to all 69 flashcards in this deck.
Unlock Deck
k this deck
42
An assumption for the goodness-of-fit test is that the __________ frequency for each category must be
five or more.
________________________________________
five or more.
________________________________________
Unlock Deck
Unlock for access to all 69 flashcards in this deck.
Unlock Deck
k this deck
43
Two computer stores recorded the number of computers sold in a week along with the sizes of their hard drives.At = .05, test the claim that the distribution of hard drives and the store where the computers were
Bought are not related.
A)There is evidence to reject the claim that the size of hard drive sold and the store number are not related
Because the test value
B)There is evidence to reject the claim that the size of hard drive sold and the store number are not related
Because the test value
C)There is not evidence to reject the claim that the size of hard drive sold and the store number are not
Related because the test value
D)There is not evidence to reject the claim that the size of hard drive sold and the store number are not
Bought are not related.
A)There is evidence to reject the claim that the size of hard drive sold and the store number are not related
Because the test value
B)There is evidence to reject the claim that the size of hard drive sold and the store number are not related
Because the test value
C)There is not evidence to reject the claim that the size of hard drive sold and the store number are not
Related because the test value
D)There is not evidence to reject the claim that the size of hard drive sold and the store number are not
Unlock Deck
Unlock for access to all 69 flashcards in this deck.
Unlock Deck
k this deck
44
A software company wants to determine whether there is a relationship between their three sales offices and the sales of their software products.The actual sales results
Are: Under the null hypothesis, what is the expected amount of Product A that would be sold by Office 2?
A)12.20
B)15.25
C)20.33
D)30.50
Are:
Under the null hypothesis, what is the expected amount of Product A that would be sold by Office 2?A)12.20
B)15.25
C)20.33
D)30.50
Unlock Deck
Unlock for access to all 69 flashcards in this deck.
Unlock Deck
k this deck
45
A biologist had mice and rats run through a maze and recorded the number that finished the maze successfully and the number that did not.This table lists the results of the study.
At = .05, test the claim that the rodent type and the success of finishing the maze are not
Related.
A)There is evidence to reject the claim that the rodent type and the success of finishing the maze are not
Related because the test value
B)There is evidence to reject the claim that the rodent type and the success of finishing the maze are not
Related because the test value
C)There is not evidence to reject the claim that the rodent type and the success of finishing the maze are
Not related because the test value
D)There is not evidence to reject the claim that the rodent type and the success of finishing the maze are
Not related because the test value
At = .05, test the claim that the rodent type and the success of finishing the maze are not
Related.
A)There is evidence to reject the claim that the rodent type and the success of finishing the maze are not
Related because the test value
B)There is evidence to reject the claim that the rodent type and the success of finishing the maze are not
Related because the test value
C)There is not evidence to reject the claim that the rodent type and the success of finishing the maze are
Not related because the test value
D)There is not evidence to reject the claim that the rodent type and the success of finishing the maze are
Not related because the test value
Unlock Deck
Unlock for access to all 69 flashcards in this deck.
Unlock Deck
k this deck
46
The chi-square distribution is continuous, whereas the goodness-of-fit test is __________.
________________________________________
________________________________________
Unlock Deck
Unlock for access to all 69 flashcards in this deck.
Unlock Deck
k this deck
47
An insurance representative wants to determine if the proportions of women and men who buy different policy types are the same.The actual sales results for 50 women and 50 men
Are:
Under the null hypothesis, what is the expected number of men who would buy Policy B?
A)25
B)30
C)35
D)50
Are:
Under the null hypothesis, what is the expected number of men who would buy Policy B?
A)25
B)30
C)35
D)50
Unlock Deck
Unlock for access to all 69 flashcards in this deck.
Unlock Deck
k this deck
48
This table lists the number of students from three different high schools participating in the mathematics and physics sections of a science fair.At = .05, test the claim that
The section of participation and the high school where the students were from are
Independent.
A)There is evidence to reject the claim that the high school and the section of participation are
Independent because the test value
B)There is not evidence to reject the claim that the high school and the section of participation are
Independent because the test valu
C)There is evidence to reject the claim that the high school and the section of participation are
Independent because the test value
D)There is not evidence to reject the claim that the high school and the section of participation are
Independent because the test value
The section of participation and the high school where the students were from are
Independent.
A)There is evidence to reject the claim that the high school and the section of participation are
Independent because the test value
B)There is not evidence to reject the claim that the high school and the section of participation are
Independent because the test valu
C)There is evidence to reject the claim that the high school and the section of participation are
Independent because the test value
D)There is not evidence to reject the claim that the high school and the section of participation are
Independent because the test value
Unlock Deck
Unlock for access to all 69 flashcards in this deck.
Unlock Deck
k this deck
49
A marketing company selected a sample of 25 lawyers and 25 doctors to determine if they had voted in the last election.At = .05, test the claim that the proportions of lawyers and doctors who voted are
Equal.
A)There is not evidence to reject the claim that the proportions are equal because the test value 3.841 <1.440
B)There is evidence to reject the claim that the proportions are equal because the test value 6.480 > 3.841
C)There is evidence to reject the claim that the proportions are equal because the test value 6.480 > 9.488
D)There is not evidence to reject the claim that the proportions are equal because the test value 9.488 <1.440
Equal.
A)There is not evidence to reject the claim that the proportions are equal because the test value 3.841 <1.440
B)There is evidence to reject the claim that the proportions are equal because the test value 6.480 > 3.841
C)There is evidence to reject the claim that the proportions are equal because the test value 6.480 > 9.488
D)There is not evidence to reject the claim that the proportions are equal because the test value 9.488 <1.440
Unlock Deck
Unlock for access to all 69 flashcards in this deck.
Unlock Deck
k this deck
50
Cattle are classified according to age (young, medium, and old) and carcass quality (grades A, B, and C).In one study, the animals were classified
As: The chi-square statistic for testing if there is an association between age and carcass quality was
Calculated.What is the expected frequency for the (2,2) cell?
A)26
B)45
C)60
D)90
As:
The chi-square statistic for testing if there is an association between age and carcass quality wasCalculated.What is the expected frequency for the (2,2) cell?
A)26
B)45
C)60
D)90
Unlock Deck
Unlock for access to all 69 flashcards in this deck.
Unlock Deck
k this deck
51
Cattle are classified according to age (young, medium, and old) and as to carcass quality (grades A, B, and C).In one study, the animals were classified
As: The chi-square statistic for testing if there is an association between age and grade was calculated.The
Null hypothesis being tested is:
A)P(grade and age) = P(grade) P(age)
B)
C)Grade and age classifications are dependent
D)Age depends on grade
As:
The chi-square statistic for testing if there is an association between age and grade was calculated.TheNull hypothesis being tested is:
A)P(grade and age) = P(grade) P(age)
B)
C)Grade and age classifications are dependent
D)Age depends on grade
Unlock Deck
Unlock for access to all 69 flashcards in this deck.
Unlock Deck
k this deck
52
A researcher wishes to determine if there is a relationship between the age of working individuals and the amount of coffee consumed.The following data were obtained for the number of cups of coffee
Consumed per day: Choose the best option from the choices below:
A)A z-test statistic could be used to test the null hypothesis.
B)A chi-square test statistic could be used to test the null hypothesis.
C)Either a z-test or a chi-square test could be used to test the null hypothesis.
D)A t-test statistic could be used to test the null hypothesis.
Consumed per day:
Choose the best option from the choices below:A)A z-test statistic could be used to test the null hypothesis.
B)A chi-square test statistic could be used to test the null hypothesis.
C)Either a z-test or a chi-square test could be used to test the null hypothesis.
D)A t-test statistic could be used to test the null hypothesis.
Unlock Deck
Unlock for access to all 69 flashcards in this deck.
Unlock Deck
k this deck
53
A researcher selected a sample of 50 residents from each of three different cities to determine if citizens were willing to participate in a medical experiment.At = .05, test the claim that the proportions who will
Participate are equal.
A)There is not evidence to reject the claim that the proportions are equal because the test value 12.592 1.237
B)There is not evidence to reject the claim that the proportions are equal because the test value 8.321 5.991
C)There is not evidence to reject the claim that the proportions are equal because the test value 1.237 5.99
D)There is evidence to reject the claim that the proportions are equal because the test value 8.32 5.991
Participate are equal.
A)There is not evidence to reject the claim that the proportions are equal because the test value 12.592
1.237B)There is not evidence to reject the claim that the proportions are equal because the test value 8.321
5.991C)There is not evidence to reject the claim that the proportions are equal because the test value 1.237
5.99D)There is evidence to reject the claim that the proportions are equal because the test value 8.32
5.991 Unlock Deck
Unlock for access to all 69 flashcards in this deck.
Unlock Deck
k this deck
54
A quality control supervisor selected a sample of 100 electronic components from each of three different production chains to determine if the production chains had the same
Rates of meeting their quality standards.At = .05, test the claim that the proportions are
Equal.
A)There is evidence to reject the claim that the proportions are equal because the test value 12.592 0.786
B)There is not evidence to reject the claim that the proportions are equal because the test value 4.399 5.991
C)There is evidence to reject the claim that the proportions are equal because the test value 5.991 0.786
D)There is evidence to reject the claim that the proportions are equal because the test value 4.399 5.991
Rates of meeting their quality standards.At = .05, test the claim that the proportions are
Equal.
A)There is evidence to reject the claim that the proportions are equal because the test value 12.592
0.786B)There is not evidence to reject the claim that the proportions are equal because the test value 4.399
5.991C)There is evidence to reject the claim that the proportions are equal because the test value 5.991
0.786D)There is evidence to reject the claim that the proportions are equal because the test value 4.399
5.991 Unlock Deck
Unlock for access to all 69 flashcards in this deck.
Unlock Deck
k this deck
55
Cattle are classified according to age (young, medium, and old) and carcass quality (grades A, B, and C).In one study, the animals were classified
As: The chi-square statistic for testing if there is an association between age and grade was calculated.The
Rejection region for this test is
A)
B)
C)
D)
As:
The chi-square statistic for testing if there is an association between age and grade was calculated.TheRejection region for this test is
A)
B)
C)
D)
Unlock Deck
Unlock for access to all 69 flashcards in this deck.
Unlock Deck
k this deck
56
A four-year university has decided to implement a new approach to teaching statistics.Full-time and
adjunct professors were surveyed to determine whether they preferred the traditional lecture approach or
a computer approach for teaching statistics.Use hypothesis testing to test the independence of opinion
between the two groups.Table 11-3
What is the test value?
A)0.36
B)0.97
C)0.14
D)1.24
adjunct professors were surveyed to determine whether they preferred the traditional lecture approach or
a computer approach for teaching statistics.Use hypothesis testing to test the independence of opinion
between the two groups.Table 11-3
What is the test value?
A)0.36
B)0.97
C)0.14
D)1.24
Unlock Deck
Unlock for access to all 69 flashcards in this deck.
Unlock Deck
k this deck
57
Chicken, hot dogs, and hamburgers were served during a recent barbecue.The host assumed that there would be no difference between what the women chose to eat and what the men chose to eat.What is the
Test value for the following data?
A)1.596
B)4.140
C)1.686
D)5.769
Test value for the following data?
A)1.596
B)4.140
C)1.686
D)5.769
Unlock Deck
Unlock for access to all 69 flashcards in this deck.
Unlock Deck
k this deck
58
A study was performed at a university to analyze whether the preference for hamburgers or fried chicken is related to the gender of the student.This table lists the results of the
Study.At = .05, test the claim that the meal preference and the gender of the student are not
Related.
A)There is evidence to reject the claim that the meal preference and the gender of the student are not
Related because the test value
B)There is evidence to reject the claim that the meal preference and the gender of the student are not
Related because the test value
C)There is not evidence to reject the claim that the meal preference and the gender of the student are not
Related because the test value
D)There is not evidence to reject the claim that the meal preference and the gender of the student are not
Related because the test value
Study.At = .05, test the claim that the meal preference and the gender of the student are not
Related.
A)There is evidence to reject the claim that the meal preference and the gender of the student are not
Related because the test value
B)There is evidence to reject the claim that the meal preference and the gender of the student are not
Related because the test value
C)There is not evidence to reject the claim that the meal preference and the gender of the student are not
Related because the test value
D)There is not evidence to reject the claim that the meal preference and the gender of the student are not
Related because the test value
Unlock Deck
Unlock for access to all 69 flashcards in this deck.
Unlock Deck
k this deck
59
A product testing laboratory selected a sample of 20 printers from two different manufacturers to determine if they could print more than 100,000 pages without breaking down.At = .05, test the claim
That the proportions of printers from Manufacturer 1 and Manufacturer 2 that lasted for more than
100,000 pages are equal.
A)There is not evidence to reject the claim that the proportions are equal because the test value 2.506 3.841
B)There is evidence to reject the claim that the proportions are equal because the test value 3.841 1.003
C)There is not evidence to reject the claim that the proportions are equal because the test value 2.506 9.488
D)There is not evidence to reject the claim that the proportions are equal because the test value 9.488 1.003
That the proportions of printers from Manufacturer 1 and Manufacturer 2 that lasted for more than
100,000 pages are equal.
A)There is not evidence to reject the claim that the proportions are equal because the test value 2.506
3.841B)There is evidence to reject the claim that the proportions are equal because the test value 3.841
1.003C)There is not evidence to reject the claim that the proportions are equal because the test value 2.506
9.488D)There is not evidence to reject the claim that the proportions are equal because the test value 9.488
1.003 Unlock Deck
Unlock for access to all 69 flashcards in this deck.
Unlock Deck
k this deck
60
The following table lists the sugar content of two types of apples from three different orchards.At = .05, test the claim that the sugar content of the apples and the orchard where they were grown are not
Related.
A)There is evidence to reject the claim that the sugar content of the apple type and the orchard number are
Not related because the test value
B)There is not evidence to reject the claim that the sugar content of the apple type and the orchard number
Are not related because the test valu
C)There is evidence to reject the claim that the sugar content of the apple type and the orchard number are
Not related because the test value
D)There is not evidence to reject the claim that the sugar content of the apple type and the orchard number
Are not related because the test value
Related.
A)There is evidence to reject the claim that the sugar content of the apple type and the orchard number are
Not related because the test value
B)There is not evidence to reject the claim that the sugar content of the apple type and the orchard number
Are not related because the test valu
C)There is evidence to reject the claim that the sugar content of the apple type and the orchard number are
Not related because the test value
D)There is not evidence to reject the claim that the sugar content of the apple type and the orchard number
Are not related because the test value
Unlock Deck
Unlock for access to all 69 flashcards in this deck.
Unlock Deck
k this deck
61
A researcher wishes to determine if there is a relationship between the sex of an individual and
the amount of coffee consumed.The following data was obtained for the number of cups of coffee
consumed.What is the expected value of
the amount of coffee consumed.The following data was obtained for the number of cups of coffee
consumed.What is the expected value of
Unlock Deck
Unlock for access to all 69 flashcards in this deck.
Unlock Deck
k this deck
62
A research firm reported that 15% of those surveyed described their health as poor, 26% as good, 40% as
very good, and 19% as excellent.A health professional in Halifax wants to determine if people in Halifax
have similar feelings toward their health.In a sample of 610 people in Halifax, 70 described their health
as poor, 180 as good, 220 as very good, and 140 as excellent.Plot the observed and expected values and
calculate the test value.
Unlock Deck
Unlock for access to all 69 flashcards in this deck.
Unlock Deck
k this deck
63
If the null hypothesis is not rejected, it can be assumed the proportions are __________ and the
differences in them are due to chance.
________________________________________
differences in them are due to chance.
________________________________________
Unlock Deck
Unlock for access to all 69 flashcards in this deck.
Unlock Deck
k this deck
64
Six different brands of popcorn were tested for popping.Two hundred kernels of each brand were
popped, and the number of kernels that did not pop was counted.Determine the expected value and then
plot it on a graph with the observed values.
popped, and the number of kernels that did not pop was counted.Determine the expected value and then
plot it on a graph with the observed values.
Unlock Deck
Unlock for access to all 69 flashcards in this deck.
Unlock Deck
k this deck
65
The method that uses the formula is called the __________ correction forcontinuity.
Unlock Deck
Unlock for access to all 69 flashcards in this deck.
Unlock Deck
k this deck
66
When data are arranged in table form for the chi-square independence test, it is called a __________
table.
________________________________________
table.
________________________________________
Unlock Deck
Unlock for access to all 69 flashcards in this deck.
Unlock Deck
k this deck
67
The degrees of freedom for a contingency table are __________.
________________________________________
contingency table are __________.________________________________________
Unlock Deck
Unlock for access to all 69 flashcards in this deck.
Unlock Deck
k this deck
68
The two types of test that use a contingency table are the independence test and the __________ test.
Unlock Deck
Unlock for access to all 69 flashcards in this deck.
Unlock Deck
k this deck
69
The dean of a local school wants to determine if the grade distribution is independent of
the subject matter taught.How many degrees of freedom does this contingency table have?
the subject matter taught.How many degrees of freedom does this contingency table have?
Unlock Deck
Unlock for access to all 69 flashcards in this deck.
Unlock Deck
k this deck
Unlock Deck
Unlock for access to all 69 flashcards in this deck.


