Deck 18: Review of Statistical Inference
Full screen (f)
Question
Question
Question
Question
Question
When comparing two population variances, we use the ratio  rather than the difference
  .
.
rather than the difference . Question
Question
Question
Question
The statistic 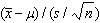 when the sampled population is normal is Student t -distributed with n degrees of freedom.
when the sampled population is normal is Student t -distributed with n degrees of freedom. Question
Question
Question
The sampling distribution of  is normal if the sampled populations are normal, and approximately normal if the populations are nonnormal and the sample sizes n 1 and n 2 are large.
is normal if the sampled populations are normal, and approximately normal if the populations are nonnormal and the sample sizes n 1 and n 2 are large. Question
Question
Question
Question
The expected value of  is
is 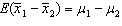 .
.
is . Question
Question
Question
Question
The test statistic employed to test  is
is  is F -distributed with v 1 = n 1 - 1 and v 2 = n 2 - 1 degrees of freedom if the two populations are F -distributed.
is is F -distributed with v 1 = n 1 - 1 and v 2 = n 2 - 1 degrees of freedom if the two populations are F -distributed. Question
Question
Question
Question
Question
Question
Question
Question
Question
Question
Question
Question
Question
Question
Question
Question
Question
Question
Question
Question
Question
Question
Question
Question
In reference to the equation 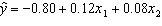 , the value 0.12 is the average change in y per unit change in x 1, when x 2 is held constant.
, the value 0.12 is the average change in y per unit change in x 1, when x 2 is held constant. Question
Question
Question
Question
Question
Question
Question
Question
A regression analysis between sales (in $)and advertising (in $)resulted in the following least squares line:  . This implies that an increase of $1 in advertising is associated with an increase of $60 in sales.
. This implies that an increase of $1 in advertising is associated with an increase of $60 in sales. Question
In testing the significance of a multiple regression model with three independent variables, the null hypothesis is 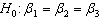 .
.
. Question
In simple linear regression, the denominator of the standard error of estimate s e is  .
.
. Question
Question
Question
Question
Question
The residual ri is defined as the difference between the actual value yi and the estimated value  .
.
. Question
Question
Question
Question
Question
Question
Question
Question
Question
Question
Question
In testing for differences between the means of two independent populations the null hypothesis is:
A)
B)
C)
D)
A)
B)
C)
D)
Question
Two independent samples of sizes 20 and 30 are randomly selected from two normally distributed populations. Assume that the population variances are unknown but equal. In order to test the difference between the population means,  , the sampling distribution of the sample mean difference,
  , is:
, is:
A)normal.
B)Student -t with 50 degrees of freedom.
C)Student -t with 48 degrees of freedom.
D)None of these choices.
, the sampling distribution of the sample mean difference, , is:A)normal.
B)Student -t with 50 degrees of freedom.
C)Student -t with 48 degrees of freedom.
D)None of these choices.
Question
When testing  vs.
vs.  , the observed value of the z -score was found to be - 2.15. Then, the p -value for this test would be
A).0158
B).0316
C).9842
D).9684
vs. , the observed value of the z -score was found to be - 2.15. Then, the p -value for this test would beA).0158
B).0316
C).9842
D).9684
Question
In calculating the standard error of the estimate,  , there are ( n - k - 1)degrees of freedom, where n is the sample size and k is the number of independent variables in the model.
, there are ( n - k - 1)degrees of freedom, where n is the sample size and k is the number of independent variables in the model. Question
Question
Question
Question
Question
Question
Question

Unlock Deck
Sign up to unlock the cards in this deck!
Unlock Deck
Unlock Deck
1/189
Play
Full screen (f)
Deck 18: Review of Statistical Inference
1
The t- distribution is used in a confidence interval for a mean when the actual standard error is not known.
True
2
The F -test used for testing the difference in 2 population variances is always a one-tailed test.
False
3
The test statistic used to test hypotheses about the population variance is given by c 2 = ( n - 1)s 2 \ s 2, which is chi-squared distributed with n - 1 degrees of freedom when the population is normally distributed with variance equal to s 2 .
True
4
In estimating the population mean with the population standard deviation unknown, if the sample size is 16, there are 8 degrees of freedom.
Unlock Deck
Unlock for access to all 189 flashcards in this deck.
Unlock Deck
k this deck
5
When comparing two population variances, we use the ratio rather than the difference .
rather than the difference . Unlock Deck
Unlock for access to all 189 flashcards in this deck.
Unlock Deck
k this deck
6
Two uses for the population variance are to measure risk and consistency.
Unlock Deck
Unlock for access to all 189 flashcards in this deck.
Unlock Deck
k this deck
7
We use a t -test to determine whether two population variances are equal.
Unlock Deck
Unlock for access to all 189 flashcards in this deck.
Unlock Deck
k this deck
8
A condition of using the chi-squared test statistic for testing the variance is that the population random variable have a normal distribution.
Unlock Deck
Unlock for access to all 189 flashcards in this deck.
Unlock Deck
k this deck
9
The statistic when the sampled population is normal is Student t -distributed with n degrees of freedom.
when the sampled population is normal is Student t -distributed with n degrees of freedom. Unlock Deck
Unlock for access to all 189 flashcards in this deck.
Unlock Deck
k this deck
10
The F -test used in one-way ANOVA is an extension of the t -test of m 1 - m 2.
Unlock Deck
Unlock for access to all 189 flashcards in this deck.
Unlock Deck
k this deck
11
In order to determine the p -value associated with hypothesis testing about the population mean m , it is necessary to know the value of the test statistic.
Unlock Deck
Unlock for access to all 189 flashcards in this deck.
Unlock Deck
k this deck
12
The sampling distribution of is normal if the sampled populations are normal, and approximately normal if the populations are nonnormal and the sample sizes n 1 and n 2 are large.
is normal if the sampled populations are normal, and approximately normal if the populations are nonnormal and the sample sizes n 1 and n 2 are large. Unlock Deck
Unlock for access to all 189 flashcards in this deck.
Unlock Deck
k this deck
13
The pooled-variances t -test requires that the two population variances need not be the same.
Unlock Deck
Unlock for access to all 189 flashcards in this deck.
Unlock Deck
k this deck
14
The F -distribution is symmetric.
Unlock Deck
Unlock for access to all 189 flashcards in this deck.
Unlock Deck
k this deck
15
The sum of squares for treatments, SST, achieves its smallest value (zero)when all the sample means are equal.
Unlock Deck
Unlock for access to all 189 flashcards in this deck.
Unlock Deck
k this deck
16
The expected value of is .
is . Unlock Deck
Unlock for access to all 189 flashcards in this deck.
Unlock Deck
k this deck
17
If the sampled population is nonnormal, the t -test of the population mean m is still valid, provided that the condition is not extreme.
Unlock Deck
Unlock for access to all 189 flashcards in this deck.
Unlock Deck
k this deck
18
We use the analysis of variance (ANOVA)technique to compare two or more population means.
Unlock Deck
Unlock for access to all 189 flashcards in this deck.
Unlock Deck
k this deck
19
Independent samples are those for which the selection process for one is not related to the selection process for the other.
Unlock Deck
Unlock for access to all 189 flashcards in this deck.
Unlock Deck
k this deck
20
The test statistic employed to test is is F -distributed with v 1 = n 1 - 1 and v 2 = n 2 - 1 degrees of freedom if the two populations are F -distributed.
is is F -distributed with v 1 = n 1 - 1 and v 2 = n 2 - 1 degrees of freedom if the two populations are F -distributed. Unlock Deck
Unlock for access to all 189 flashcards in this deck.
Unlock Deck
k this deck
21
The Bonferroni adjustment to Fisher's Least Significant Difference (LSD)multiple comparison method is made by dividing the specified experimentwise Type I error rate by the number of pairs of population means.
Unlock Deck
Unlock for access to all 189 flashcards in this deck.
Unlock Deck
k this deck
22
A chi-squared goodness-of-fit test is always a two-tailed test.
Unlock Deck
Unlock for access to all 189 flashcards in this deck.
Unlock Deck
k this deck
23
One example of a blocking variable is the dosage level that each subject is assigned to in a randomized experiment.
Unlock Deck
Unlock for access to all 189 flashcards in this deck.
Unlock Deck
k this deck
24
In a chi-squared test of a contingency table, the value of the test statistic was c 2 = 15.652, and the critical value at a = 0.025 was 11.1433. Thus, we must reject the null hypothesis at a = 0.025.
Unlock Deck
Unlock for access to all 189 flashcards in this deck.
Unlock Deck
k this deck
25
The degrees of freedom for the test statistic in a test of a contingency table is ( r - 1 )( c - 1 )where r is the number of rows in the table, and c is the number of columns.
Unlock Deck
Unlock for access to all 189 flashcards in this deck.
Unlock Deck
k this deck
26
In one-way ANOVA, the test statistic is defined as the ratio of the mean square for error (MSE)and the mean square for treatments (MST), namely, F = MSE \ MST.
Unlock Deck
Unlock for access to all 189 flashcards in this deck.
Unlock Deck
k this deck
27
The degrees of freedom for the test statistic in a test of a contingency table is ( r - 1 )( c - 1 )where r is the number of rows in the table, and c is the number of columns.
Unlock Deck
Unlock for access to all 189 flashcards in this deck.
Unlock Deck
k this deck
28
In employing the randomized block design, the primary interest lies in reducing sum of squares for blocks (SSB).
Unlock Deck
Unlock for access to all 189 flashcards in this deck.
Unlock Deck
k this deck
29
Multiple comparison methods are used to determine whether or not any differences occur amongst a group of population means.
Unlock Deck
Unlock for access to all 189 flashcards in this deck.
Unlock Deck
k this deck
30
If the expected frequency of a cell is less than 5, you should combine cells of the table.
Unlock Deck
Unlock for access to all 189 flashcards in this deck.
Unlock Deck
k this deck
31
If the numerator (MST)degrees of freedom is 3 and the denominator (MSE)degrees of freedom is 18, the total number of observations must equal 21.
Unlock Deck
Unlock for access to all 189 flashcards in this deck.
Unlock Deck
k this deck
32
Tukey's multiple comparison method is more powerful than Fisher's LSD Method at finding differences in pairwise population means.
Unlock Deck
Unlock for access to all 189 flashcards in this deck.
Unlock Deck
k this deck
33
In conducting a chi-squared goodness-of-fit test, an essential condition is that all expected frequencies are at least five.
Unlock Deck
Unlock for access to all 189 flashcards in this deck.
Unlock Deck
k this deck
34
In a test of a contingency table, rejecting the null hypothesis concludes the variables are not independent.
Unlock Deck
Unlock for access to all 189 flashcards in this deck.
Unlock Deck
k this deck
35
The alternative hypothesis in a goodness-of-fit test is that none of the pi values are equal to their values specified in H 0.
Unlock Deck
Unlock for access to all 189 flashcards in this deck.
Unlock Deck
k this deck
36
Conducting t -tests for each pair or population means is statistically equivalent to conducting one F -test comparing all the population means.
Unlock Deck
Unlock for access to all 189 flashcards in this deck.
Unlock Deck
k this deck
37
If two events A and B are independent, the P ( A and B )= P ( A )+ P ( B ).
Unlock Deck
Unlock for access to all 189 flashcards in this deck.
Unlock Deck
k this deck
38
A multinomial experiment with two categories is identical to a binomial experiment.
Unlock Deck
Unlock for access to all 189 flashcards in this deck.
Unlock Deck
k this deck
39
The test statistic for the chi-squared test of a contingency table is the same as the test statistic for the goodness-of-fit test.
Unlock Deck
Unlock for access to all 189 flashcards in this deck.
Unlock Deck
k this deck
40
A chi-squared test is used to describe a population of nominal data.
Unlock Deck
Unlock for access to all 189 flashcards in this deck.
Unlock Deck
k this deck
41
The coefficient of determination R 2 measures the proportion of variation in y that is explained by the explanatory variables included in the model.
Unlock Deck
Unlock for access to all 189 flashcards in this deck.
Unlock Deck
k this deck
42
Most statistical software print a second R 2 statistic, called the coefficient of determination adjusted for degrees of freedom, which has been adjusted to take into account the sample size and the number of independent variables.
Unlock Deck
Unlock for access to all 189 flashcards in this deck.
Unlock Deck
k this deck
43
If all the points in a scatter diagram lie on the least squares regression line, then the coefficient of correlation must be 1.0.
Unlock Deck
Unlock for access to all 189 flashcards in this deck.
Unlock Deck
k this deck
44
In reference to the equation , the value 0.12 is the average change in y per unit change in x 1, when x 2 is held constant.
, the value 0.12 is the average change in y per unit change in x 1, when x 2 is held constant. Unlock Deck
Unlock for access to all 189 flashcards in this deck.
Unlock Deck
k this deck
45
A zero population correlation coefficient for x and y means that there is no type of relationship whatsoever between x and y.
Unlock Deck
Unlock for access to all 189 flashcards in this deck.
Unlock Deck
k this deck
46
Statisticians have shown that sample y -intercept b 0 and sample slope coefficient b 1 are unbiased estimators of the population regression parameters b 0 and b 1, respectively.
Unlock Deck
Unlock for access to all 189 flashcards in this deck.
Unlock Deck
k this deck
47
A prediction interval is used when we want to predict a one-time occurrence for a particular value of y when the independent variable is a given x value.
Unlock Deck
Unlock for access to all 189 flashcards in this deck.
Unlock Deck
k this deck
48
An inverse relationship between an independent variable x and a dependent variably y means that as x increases, y decreases, and vice versa.
Unlock Deck
Unlock for access to all 189 flashcards in this deck.
Unlock Deck
k this deck
49
Another name for the residual term in a regression equation is random error.
Unlock Deck
Unlock for access to all 189 flashcards in this deck.
Unlock Deck
k this deck
50
The coefficient of determination is equal to the coefficient of correlation squared.
Unlock Deck
Unlock for access to all 189 flashcards in this deck.
Unlock Deck
k this deck
51
The value of the sum of squares for regression SSR can never be smaller than 0.0.
Unlock Deck
Unlock for access to all 189 flashcards in this deck.
Unlock Deck
k this deck
52
A regression analysis between sales (in $)and advertising (in $)resulted in the following least squares line: . This implies that an increase of $1 in advertising is associated with an increase of $60 in sales.
. This implies that an increase of $1 in advertising is associated with an increase of $60 in sales. Unlock Deck
Unlock for access to all 189 flashcards in this deck.
Unlock Deck
k this deck
53
In testing the significance of a multiple regression model with three independent variables, the null hypothesis is .
. Unlock Deck
Unlock for access to all 189 flashcards in this deck.
Unlock Deck
k this deck
54
In simple linear regression, the denominator of the standard error of estimate s e is .
. Unlock Deck
Unlock for access to all 189 flashcards in this deck.
Unlock Deck
k this deck
55
If the coefficient of correlation is 1.0, then the coefficient of determination must be 1.0.
Unlock Deck
Unlock for access to all 189 flashcards in this deck.
Unlock Deck
k this deck
56
Correlation analysis is used to determine whether there is a linear relationship between an independent variable x and a dependent variable y .
Unlock Deck
Unlock for access to all 189 flashcards in this deck.
Unlock Deck
k this deck
57
In multiple regression analysis, the adjusted coefficient of determination is adjusted for the number of independent variables and the sample size.
Unlock Deck
Unlock for access to all 189 flashcards in this deck.
Unlock Deck
k this deck
58
One method of diagnosing heteroscedasticity is to plot the residuals against the predicted values of y , then look for a change in the spread of the plotted values.
Unlock Deck
Unlock for access to all 189 flashcards in this deck.
Unlock Deck
k this deck
59
The residual ri is defined as the difference between the actual value yi and the estimated value .
. Unlock Deck
Unlock for access to all 189 flashcards in this deck.
Unlock Deck
k this deck
60
A confidence interval (as opposed to a prediction interval)is used to estimate the long-run average value of y .
Unlock Deck
Unlock for access to all 189 flashcards in this deck.
Unlock Deck
k this deck
61
The t -test for the difference between the means of two independent populations assumes that the respective:
A)sample sizes are equal.
B)populations are normal.
C)means are equal.
D)All of these choices are true.
A)sample sizes are equal.
B)populations are normal.
C)means are equal.
D)All of these choices are true.
Unlock Deck
Unlock for access to all 189 flashcards in this deck.
Unlock Deck
k this deck
62
For statistical inference about the mean of a single population when the population standard deviation is unknown, the degrees for freedom for the t- distribution equal n - 1 because we lose one degree of freedom by using the:
A)sample mean as an estimate of the population mean.
B)sample standard deviation as an estimate of the population standard deviation.
C)sample proportion as an estimate of the population proportion.
D)sample size as an estimate of the population size.
A)sample mean as an estimate of the population mean.
B)sample standard deviation as an estimate of the population standard deviation.
C)sample proportion as an estimate of the population proportion.
D)sample size as an estimate of the population size.
Unlock Deck
Unlock for access to all 189 flashcards in this deck.
Unlock Deck
k this deck
63
Based on sample data, the 90% confidence interval limits for the population mean are LCL = 170.86 and UCL = 195.42. If the 10% level of significance were used in testing the hypotheses H 0: m = 201 vs. H 1: m ¹ 201, the null hypothesis:
A)would be rejected.
B)would be accepted.
C)would fail to be rejected.
D)would become H 0: m ¹ 201
A)would be rejected.
B)would be accepted.
C)would fail to be rejected.
D)would become H 0: m ¹ 201
Unlock Deck
Unlock for access to all 189 flashcards in this deck.
Unlock Deck
k this deck
64
Multicollinearity is present if the dependent variable is linearly related to one of the explanatory variables.
Unlock Deck
Unlock for access to all 189 flashcards in this deck.
Unlock Deck
k this deck
65
The statistic ( n - 1)s 2 \ s 2 has a chi-squared distribution with n - 1 degrees of freedom if:
A)the sample has a Student t -distribution with degrees of freedom equal to n - 1.
B)the sample is normally distributed with variance equal to s 2.
C)the population is normally distributed with variance equal to s 2.
D)All of these choices are true.
A)the sample has a Student t -distribution with degrees of freedom equal to n - 1.
B)the sample is normally distributed with variance equal to s 2.
C)the population is normally distributed with variance equal to s 2.
D)All of these choices are true.
Unlock Deck
Unlock for access to all 189 flashcards in this deck.
Unlock Deck
k this deck
66
A test is being conducted to test the difference between two population means using data that are gathered from a matched pairs experiment. If the paired differences are normal, then the distribution used for testing is the:
A)normal distribution.
B)binomial distribution.
C)Student t -distribution.
D)F -distribution.
A)normal distribution.
B)binomial distribution.
C)Student t -distribution.
D)F -distribution.
Unlock Deck
Unlock for access to all 189 flashcards in this deck.
Unlock Deck
k this deck
67
In testing for the differences between the means of two independent populations where the variances in each population are unknown but assumed equal, the degrees of freedom is:
A)n 1 + n 2
B)n 1 + n 2 - 2
C)n 1 + n 2 - 1
D)None of these choices
A)n 1 + n 2
B)n 1 + n 2 - 2
C)n 1 + n 2 - 1
D)None of these choices
Unlock Deck
Unlock for access to all 189 flashcards in this deck.
Unlock Deck
k this deck
68
Multicollinearity is a situation in which two or more of the independent variables are highly correlated with each other.
Unlock Deck
Unlock for access to all 189 flashcards in this deck.
Unlock Deck
k this deck
69
The expected value of the difference of two sample means equals the difference of the corresponding population means when:
A)the populations are normally distributed.
B)the samples are independent.
C)the populations are approximately normal and the sample sizes are large.
D)All of these choices are true.
A)the populations are normally distributed.
B)the samples are independent.
C)the populations are approximately normal and the sample sizes are large.
D)All of these choices are true.
Unlock Deck
Unlock for access to all 189 flashcards in this deck.
Unlock Deck
k this deck
70
In testing for differences between the means of two independent populations the null hypothesis is:
A)
B)
C)
D)
A)
B)
C)
D)
Unlock Deck
Unlock for access to all 189 flashcards in this deck.
Unlock Deck
k this deck
71
Two independent samples of sizes 20 and 30 are randomly selected from two normally distributed populations. Assume that the population variances are unknown but equal. In order to test the difference between the population means, , the sampling distribution of the sample mean difference, , is:
A)normal.
B)Student -t with 50 degrees of freedom.
C)Student -t with 48 degrees of freedom.
D)None of these choices.
, the sampling distribution of the sample mean difference, , is:A)normal.
B)Student -t with 50 degrees of freedom.
C)Student -t with 48 degrees of freedom.
D)None of these choices.
Unlock Deck
Unlock for access to all 189 flashcards in this deck.
Unlock Deck
k this deck
72
When testing vs. , the observed value of the z -score was found to be - 2.15. Then, the p -value for this test would be
A).0158
B).0316
C).9842
D).9684
vs. , the observed value of the z -score was found to be - 2.15. Then, the p -value for this test would beA).0158
B).0316
C).9842
D).9684
Unlock Deck
Unlock for access to all 189 flashcards in this deck.
Unlock Deck
k this deck
73
In calculating the standard error of the estimate, , there are ( n - k - 1)degrees of freedom, where n is the sample size and k is the number of independent variables in the model.
, there are ( n - k - 1)degrees of freedom, where n is the sample size and k is the number of independent variables in the model. Unlock Deck
Unlock for access to all 189 flashcards in this deck.
Unlock Deck
k this deck
74
Multicollinearity affects the t -tests of the individual coefficients as well as the F -test in the analysis of variance for regression because the F -test combines the t -tests into a single test.
Unlock Deck
Unlock for access to all 189 flashcards in this deck.
Unlock Deck
k this deck
75
A random sample of size 15 taken from a normally distributed population revealed a sample mean of 75 and a sample variance of 25. The upper limit of a 95% confidence interval for the population mean would equal:
A)77.77
B)72.23
C)88.85
D)77.27
A)77.77
B)72.23
C)88.85
D)77.27
Unlock Deck
Unlock for access to all 189 flashcards in this deck.
Unlock Deck
k this deck
76
Which of the following conditions is needed regarding the chi-squared test statistic for the test of variance?
A)The population random variable must be normal.
B)The test statistic must be a non-negative number.
C)The test statistic must have a chi-squared distribution with n - 1 degrees of freedom.
D)All of these choices are true.
A)The population random variable must be normal.
B)The test statistic must be a non-negative number.
C)The test statistic must have a chi-squared distribution with n - 1 degrees of freedom.
D)All of these choices are true.
Unlock Deck
Unlock for access to all 189 flashcards in this deck.
Unlock Deck
k this deck
77
For a 99% confidence interval of the population mean based on a sample of n = 25 with s = 0.05, the critical value of t is:
A)2.7969
B)2.7874
C)2.4922
D)2.4851
A)2.7969
B)2.7874
C)2.4922
D)2.4851
Unlock Deck
Unlock for access to all 189 flashcards in this deck.
Unlock Deck
k this deck
78
A random sample of 25 observations is selected from a normally distributed population. The sample variance is 10. In the 95% confidence interval for the population variance, the upper limit is:
A)19.353
B)17.331
C)17.110
D)6.097
A)19.353
B)17.331
C)17.110
D)6.097
Unlock Deck
Unlock for access to all 189 flashcards in this deck.
Unlock Deck
k this deck
79
From the coefficient of determination, we cannot detect the strength of the relationship between the dependent variable y and any individual independent variable.
Unlock Deck
Unlock for access to all 189 flashcards in this deck.
Unlock Deck
k this deck
80
Which of the following is not an example illustrating the use of variance?
A)As a measure of risk.
B)As a judge of consistency.
C)To search for and reduce variability in a process.
D)All of these choices are true.
A)As a measure of risk.
B)As a judge of consistency.
C)To search for and reduce variability in a process.
D)All of these choices are true.
Unlock Deck
Unlock for access to all 189 flashcards in this deck.
Unlock Deck
k this deck
Unlock Deck
Unlock for access to all 189 flashcards in this deck.


