Deck 17: Optimization Models with Uncertainty
Full screen (f)
Question
Use the table below to answer the following question(s).
The Atlas Movies Theater has repriced their ticket rates to maximize revenues.They have three classes of tickets: Classic, Silver, and Gold.The table below provides information on the average ticket sales, revenue and price elasticity on demand.They have a total seating capacity of 300.The table also provides the new price for the three classes obtained using Solver.
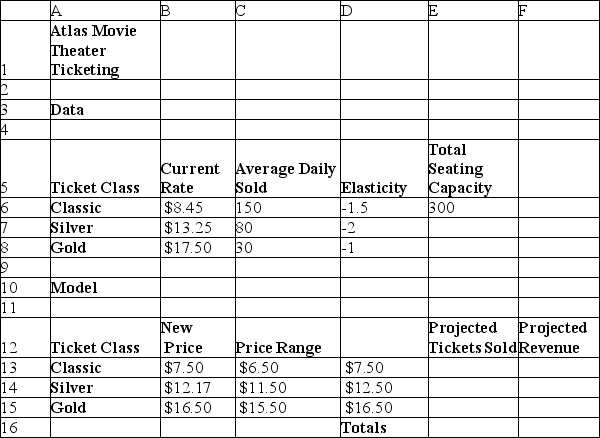
Assume the distributions of elasticities for three classes of tickets are uniform with minimum and maximum values equal to 75% and 125% of their estimated values, respectively.Under this assumption, use Monte Carlo simulation to answer the following questions.The model is simulated for 10,000 trials.
Which of the following cells is defined as the output cell?
A)E16
B)E18
C)F17
D)F18
The Atlas Movies Theater has repriced their ticket rates to maximize revenues.They have three classes of tickets: Classic, Silver, and Gold.The table below provides information on the average ticket sales, revenue and price elasticity on demand.They have a total seating capacity of 300.The table also provides the new price for the three classes obtained using Solver.
Assume the distributions of elasticities for three classes of tickets are uniform with minimum and maximum values equal to 75% and 125% of their estimated values, respectively.Under this assumption, use Monte Carlo simulation to answer the following questions.The model is simulated for 10,000 trials.
Which of the following cells is defined as the output cell?
A)E16
B)E18
C)F17
D)F18
Question
Use the table below to answer the following question(s).
Below is a spreadsheet for Stone Age Surfboards.
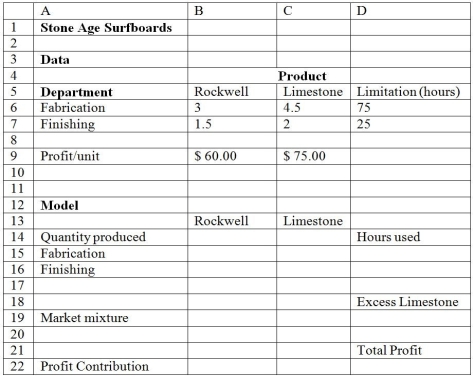
Assume that the finishing time for a pair of Rockwell surfboards is triangular with a minimum value of 1.4, a most likely value of 1.5, and a maximum value of 1.8 and that finishing time for a pair of Limestone surfboards is also triangular with a minimum value of 1.8, a most likely value of 2.0, and a maximum value of 2.4.The number of trials per simulation is equal to 5000.
What is the mean absolute deviation obtained from the simulation results?
A)1)25
B)0)65
C)0)24
D)0)99
Below is a spreadsheet for Stone Age Surfboards.
Assume that the finishing time for a pair of Rockwell surfboards is triangular with a minimum value of 1.4, a most likely value of 1.5, and a maximum value of 1.8 and that finishing time for a pair of Limestone surfboards is also triangular with a minimum value of 1.8, a most likely value of 2.0, and a maximum value of 2.4.The number of trials per simulation is equal to 5000.
What is the mean absolute deviation obtained from the simulation results?
A)1)25
B)0)65
C)0)24
D)0)99
Question
Use the table below to answer the following question(s).
The Atlas Movies Theater has repriced their ticket rates to maximize revenues.They have three classes of tickets: Classic, Silver, and Gold.The table below provides information on the average ticket sales, revenue and price elasticity on demand.They have a total seating capacity of 300.The table also provides the new price for the three classes obtained using Solver.
Assume the distributions of elasticities for three classes of tickets are uniform with minimum and maximum values equal to 75% and 125% of their estimated values, respectively.Under this assumption, use Monte Carlo simulation to answer the following questions.The model is simulated for 10,000 trials.
What is the value of mean obtained from the simulation results?
A)450
B)300
C)400
D)250
Question
Use the table below to answer the following question(s).
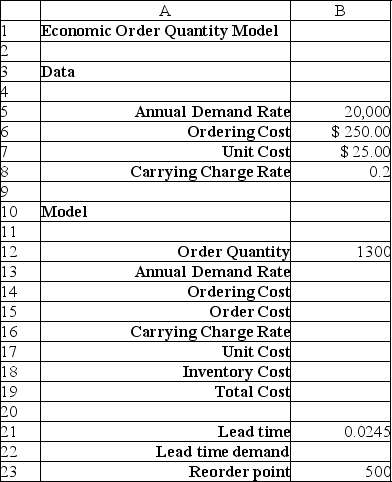
Below is the spreadsheet for an economic order quantity model.
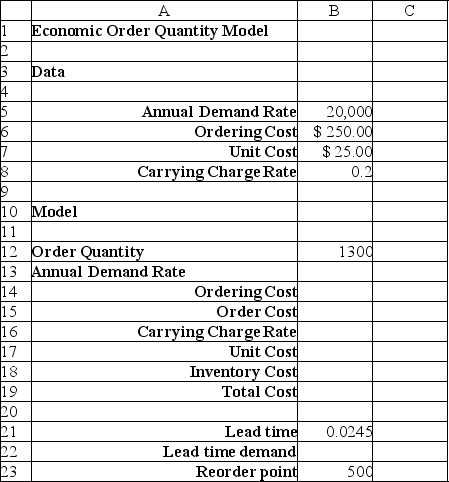
Assume that the distribution of demand is normal with a mean of 20,000 and standard deviation of 2,000.
What is the coefficient of variation obtained from the simulation results?
A)0)28
B)0)10
C)0)45
D)0)60
Below is the spreadsheet for an economic order quantity model.
Assume that the distribution of demand is normal with a mean of 20,000 and standard deviation of 2,000.
What is the coefficient of variation obtained from the simulation results?
A)0)28
B)0)10
C)0)45
D)0)60
Question
Use the table below to answer the following question(s).
Below is a spreadsheet for Stone Age Surfboards.
Assume that the finishing time for a pair of Rockwell surfboards is triangular with a minimum value of 1.4, a most likely value of 1.5, and a maximum value of 1.8 and that finishing time for a pair of Limestone surfboards is also triangular with a minimum value of 1.8, a most likely value of 2.0, and a maximum value of 2.4.The number of trials per simulation is equal to 5000.
What is the coefficient of variation obtained from the simulation results?
A)0)098
B)0)134
C)0)047
D)0)020
Question
Use the table below to answer the following question(s).
The Atlas Movies Theater has repriced their ticket rates to maximize revenues.They have three classes of tickets: Classic, Silver, and Gold.The table below provides information on the average ticket sales, revenue and price elasticity on demand.They have a total seating capacity of 300.The table also provides the new price for the three classes obtained using Solver.
Assume the distributions of elasticities for three classes of tickets are uniform with minimum and maximum values equal to 75% and 125% of their estimated values, respectively.Under this assumption, use Monte Carlo simulation to answer the following questions.The model is simulated for 10,000 trials.
Which of the following cells are defined to be uniformly distributed?
A)B7:B9
B)C7:C9
C)D7:D9
D)B15:B17
Question
Use the table below to answer the following question(s).
Below is the spreadsheet for an economic order quantity model.
Assume that the distribution of demand is normal with a mean of 20,000 and standard deviation of 2,000.
What is the value of standard deviation obtained from the simulation results?
A)35.01
B)49.01
C)56.01
D)41.01
Below is the spreadsheet for an economic order quantity model.
Assume that the distribution of demand is normal with a mean of 20,000 and standard deviation of 2,000.
What is the value of standard deviation obtained from the simulation results?
A)35.01
B)49.01
C)56.01
D)41.01
Question
Use the table below to answer the following question(s).
Below is a spreadsheet for Stone Age Surfboards.
Assume that the finishing time for a pair of Rockwell surfboards is triangular with a minimum value of 1.4, a most likely value of 1.5, and a maximum value of 1.8 and that finishing time for a pair of Limestone surfboards is also triangular with a minimum value of 1.8, a most likely value of 2.0, and a maximum value of 2.4.The number of trials per simulation is equal to 5000.
Which of the following cells is defined as the uncertain output cell?
A)D15
B)D16
C)D19
D)D22
Question
Use the table below to answer the following question(s).
Below is the spreadsheet for an economic order quantity model.
Assume that the distribution of demand is normal with a mean of 20,000 and standard deviation of 2,000.
What is the increase in total cost?
A)$ 280
B)$ 590
C)$ 355
D)$ 450
Below is the spreadsheet for an economic order quantity model.
Assume that the distribution of demand is normal with a mean of 20,000 and standard deviation of 2,000.
What is the increase in total cost?
A)$ 280
B)$ 590
C)$ 355
D)$ 450
Question
Use the table below to answer the following question(s).
Below is the spreadsheet for an economic order quantity model.
Assume that the distribution of demand is normal with a mean of 20,000 and standard deviation of 2,000.
What is the mean absolute deviation obtained from the simulation results?
A)39.10
B)24.56
C)58.75
D)46.36
Below is the spreadsheet for an economic order quantity model.
Assume that the distribution of demand is normal with a mean of 20,000 and standard deviation of 2,000.
What is the mean absolute deviation obtained from the simulation results?
A)39.10
B)24.56
C)58.75
D)46.36
Question
Use the table below to answer the following question(s).
Below is the spreadsheet for an economic order quantity model.
Assume that the distribution of demand is normal with a mean of 20,000 and standard deviation of 2,000.
What is the value of mean obtained from the simulation results?
A)473.0
B)520.0
C)456.0
D)490.0
Below is the spreadsheet for an economic order quantity model.
Assume that the distribution of demand is normal with a mean of 20,000 and standard deviation of 2,000.
What is the value of mean obtained from the simulation results?
A)473.0
B)520.0
C)456.0
D)490.0
Question
Use the table below to answer the following question(s).
Below is the spreadsheet for an economic order quantity model.
Assume that the distribution of demand is normal with a mean of 20,000 and standard deviation of 2,000.
What is the reorder point required to attain a 95% service level?
A)460.0
B)750.5
C)571.0
D)640.5
Below is the spreadsheet for an economic order quantity model.
Assume that the distribution of demand is normal with a mean of 20,000 and standard deviation of 2,000.
What is the reorder point required to attain a 95% service level?
A)460.0
B)750.5
C)571.0
D)640.5
Question
Use the table below to answer the following question(s).
Below is a spreadsheet for Stone Age Surfboards.
Assume that the finishing time for a pair of Rockwell surfboards is triangular with a minimum value of 1.4, a most likely value of 1.5, and a maximum value of 1.8 and that finishing time for a pair of Limestone surfboards is also triangular with a minimum value of 1.8, a most likely value of 2.0, and a maximum value of 2.4.The number of trials per simulation is equal to 5000.
How often will overtime be needed if 4.5 Rockwell and 9.0 Limestone surfboards, the optimal solution, are scheduled each day?
A)more than 60%
B)more than 87%
C)more than 75%
D)more than 52%
Question
Use the table below to answer the following question(s).
Below is the spreadsheet for an economic order quantity model.
Assume that the distribution of demand is normal with a mean of 20,000 and standard deviation of 2,000.
Which of the following cells is defined as the uncertain output cell?
A)B13
B)C15
C)C19
D)B22
Below is the spreadsheet for an economic order quantity model.
Assume that the distribution of demand is normal with a mean of 20,000 and standard deviation of 2,000.
Which of the following cells is defined as the uncertain output cell?
A)B13
B)C15
C)C19
D)B22
Question
Use the table below to answer the following question(s).
Below is a spreadsheet for Stone Age Surfboards.
Assume that the finishing time for a pair of Rockwell surfboards is triangular with a minimum value of 1.4, a most likely value of 1.5, and a maximum value of 1.8 and that finishing time for a pair of Limestone surfboards is also triangular with a minimum value of 1.8, a most likely value of 2.0, and a maximum value of 2.4.The number of trials per simulation is equal to 5000.
What is the value of standard deviation obtained from the simulation results?
A)1)21
B)2)50
C)3)80
D)5)00
Question
Use the table below to answer the following question(s).
The Atlas Movies Theater has repriced their ticket rates to maximize revenues.They have three classes of tickets: Classic, Silver, and Gold.The table below provides information on the average ticket sales, revenue and price elasticity on demand.They have a total seating capacity of 300.The table also provides the new price for the three classes obtained using Solver.
Assume the distributions of elasticities for three classes of tickets are uniform with minimum and maximum values equal to 75% and 125% of their estimated values, respectively.Under this assumption, use Monte Carlo simulation to answer the following questions.The model is simulated for 10,000 trials.
What is the value of standard deviation obtained from the simulation results?
A)5
B)4
C)8
D)10
Question
Use the table below to answer the following question(s).
Below is a spreadsheet for Stone Age Surfboards.
Assume that the finishing time for a pair of Rockwell surfboards is triangular with a minimum value of 1.4, a most likely value of 1.5, and a maximum value of 1.8 and that finishing time for a pair of Limestone surfboards is also triangular with a minimum value of 1.8, a most likely value of 2.0, and a maximum value of 2.4.The number of trials per simulation is equal to 5000.
Which of the following cells is defined with a triangular distribution?
A)B6
B)D6
C)B7
D)D7
Question
Use the table below to answer the following question(s).
Below is the spreadsheet for an economic order quantity model.
Assume that the distribution of demand is normal with a mean of 20,000 and standard deviation of 2,000.
Which of the following cells is defined to be normally distributed using the function = PsiNormal(20000,2000)?
A)B5
B)B6
C)B7
D)B12
Below is the spreadsheet for an economic order quantity model.
Assume that the distribution of demand is normal with a mean of 20,000 and standard deviation of 2,000.
Which of the following cells is defined to be normally distributed using the function = PsiNormal(20000,2000)?
A)B5
B)B6
C)B7
D)B12
Question
Use the table below to answer the following question(s).
Below is a spreadsheet for Stone Age Surfboards.
Assume that the finishing time for a pair of Rockwell surfboards is triangular with a minimum value of 1.4, a most likely value of 1.5, and a maximum value of 1.8 and that finishing time for a pair of Limestone surfboards is also triangular with a minimum value of 1.8, a most likely value of 2.0, and a maximum value of 2.4.The number of trials per simulation is equal to 5000.
What is the value of mean obtained from the simulation results?
A)15.65
B)25.91
C)20.78
D)30.42
Question
Use the table below to answer the following question(s).
Below is the spreadsheet for an economic order quantity model.
Assume that the distribution of demand is normal with a mean of 20,000 and standard deviation of 2,000.
What is the value of safety stock?
A)45
B)71
C)120
D)95
Below is the spreadsheet for an economic order quantity model.
Assume that the distribution of demand is normal with a mean of 20,000 and standard deviation of 2,000.
What is the value of safety stock?
A)45
B)71
C)120
D)95
Question
Use the table below to answer the following question(s).
Below is the spreadsheet for a newsvendor model.
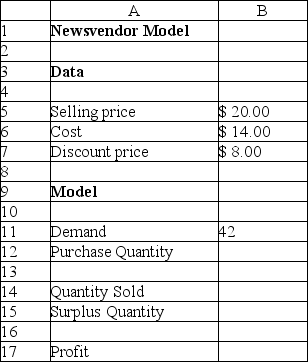
Answer the following question(s)using multiple parameterized simulations.The range of the historical data is 40 to 51.
Which of the following is the best purchase quantity to maximize the expected profit?
A)42
B)45
C)48
D)51
Below is the spreadsheet for a newsvendor model.
Answer the following question(s)using multiple parameterized simulations.The range of the historical data is 40 to 51.
Which of the following is the best purchase quantity to maximize the expected profit?
A)42
B)45
C)48
D)51
Question
Use the table below to answer the following question(s).
Below is the spreadsheet for a portfolio allocation model.
![<strong>Use the table below to answer the following question(s). Below is the spreadsheet for a portfolio allocation model. Assume that the distributions of life insurance annual return is uniform distribution with minimum 4% and maximum 6%, bond mutual funds annual return is normal with mean 7% and standard deviation 1%, stock mutual funds annual return is lognormal with mean 11% and standard deviation 4%. What is the value of the mean obtained from the simulation results for maximizing the total expected return? [Hint: Choose the approximate value.]</strong> A)$ 5,876.28 B)$ 6,570.42 C)$ 7,257.45 D)$ 5,178.84 <div style=padding-top: 35px>](https://storage.examlex.com/TB3611/11ea30b2_921f_544c_b0fd_25a805260963_TB3611_00_TB3611_00_TB3611_00_TB3611_00_TB3611_00.jpg)
Assume that the distributions of life insurance annual return is uniform distribution with minimum 4% and maximum 6%, bond mutual funds annual return is normal with mean 7% and standard deviation 1%, stock mutual funds annual return is lognormal with mean 11% and standard deviation 4%.
What is the value of the mean obtained from the simulation results for maximizing the total expected return? [Hint: Choose the approximate value.]
A)$ 5,876.28
B)$ 6,570.42
C)$ 7,257.45
D)$ 5,178.84
Below is the spreadsheet for a portfolio allocation model.
Assume that the distributions of life insurance annual return is uniform distribution with minimum 4% and maximum 6%, bond mutual funds annual return is normal with mean 7% and standard deviation 1%, stock mutual funds annual return is lognormal with mean 11% and standard deviation 4%.
What is the value of the mean obtained from the simulation results for maximizing the total expected return? [Hint: Choose the approximate value.]
A)$ 5,876.28
B)$ 6,570.42
C)$ 7,257.45
D)$ 5,178.84
Question
Use the table below to answer the following question(s).
Below is a spreadsheet for a hotel overbooking model.
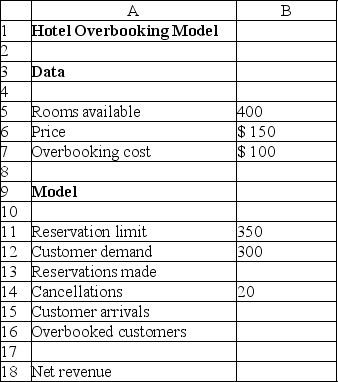
Answer the following question(s)using multiple parameterized simulations.The range of the historical data is 400-430.
What is the number of reservations that will generate a net revenue of $59,000?
A)400
B)410
C)420
D)430
Below is a spreadsheet for a hotel overbooking model.
Answer the following question(s)using multiple parameterized simulations.The range of the historical data is 400-430.
What is the number of reservations that will generate a net revenue of $59,000?
A)400
B)410
C)420
D)430
Question
Use the table below to answer the following question(s).
Below is the spreadsheet for a portfolio allocation model.
Assume that the distributions of life insurance annual return is uniform distribution with minimum 4% and maximum 6%, bond mutual funds annual return is normal with mean 7% and standard deviation 1%, stock mutual funds annual return is lognormal with mean 11% and standard deviation 4%.
What is the coefficient of variation obtained from the simulation results for maximizing the total expected return? [Hint: Choose the approximate value.]
A)1)2451
B)0)4865
C)0)8917
D)0)1268
Question
Use the table below to answer the following question(s).
Below is the spreadsheet for a portfolio allocation model.
Assume that the distributions of life insurance annual return is uniform distribution with minimum 4% and maximum 6%, bond mutual funds annual return is normal with mean 7% and standard deviation 1%, stock mutual funds annual return is lognormal with mean 11% and standard deviation 4%.
What is the value of mode obtained from the simulation results for maximizing the total expected return? [Hint: Choose the approximate value.]
A)$ 6,553.02
B)$ 5,848.24
C)$ 5,281.79
D)$ 7,025.86
Question
Use the table below to answer the following question(s).
Below is the spreadsheet for a project selection model.
![<strong>Use the table below to answer the following question(s). Below is the spreadsheet for a project selection model. What is the mean absolute deviation obtained from the simulation results? [Hint: Choose the approximate value.]</strong> A)$ 141,901 B)$ 104,786 C)$ 188,995 D)$ 232,673 <div style=padding-top: 35px>](https://storage.examlex.com/TB3611/11ea30b2_921f_a26d_b0fd_c9594deae547_TB3611_00_TB3611_00_TB3611_00_TB3611_00_TB3611_00_TB3611_00_TB3611_00_TB3611_00_TB3611_00.jpg)
What is the mean absolute deviation obtained from the simulation results? [Hint: Choose the approximate value.]
A)$ 141,901
B)$ 104,786
C)$ 188,995
D)$ 232,673
Below is the spreadsheet for a project selection model.
What is the mean absolute deviation obtained from the simulation results? [Hint: Choose the approximate value.]
A)$ 141,901
B)$ 104,786
C)$ 188,995
D)$ 232,673
Question
Use the table below to answer the following question(s).
Below is the spreadsheet for a newsvendor model.
Answer the following question(s)using multiple parameterized simulations.The range of the historical data is 40 to 51.
Which of the following values of purchase quantity shows the least mean profit?
A)42
B)45
C)48
D)51
Below is the spreadsheet for a newsvendor model.
Answer the following question(s)using multiple parameterized simulations.The range of the historical data is 40 to 51.
Which of the following values of purchase quantity shows the least mean profit?
A)42
B)45
C)48
D)51
Question
Use the table below to answer the following question(s).
The Atlas Movies Theater has repriced their ticket rates to maximize revenues.They have three classes of tickets: Classic, Silver, and Gold.The table below provides information on the average ticket sales, revenue and price elasticity on demand.They have a total seating capacity of 300.The table also provides the new price for the three classes obtained using Solver.
Assume the distributions of elasticities for three classes of tickets are uniform with minimum and maximum values equal to 75% and 125% of their estimated values, respectively.Under this assumption, use Monte Carlo simulation to answer the following questions.The model is simulated for 10,000 trials.
What is the mean absolute deviation obtained from the simulation results?
A)3
B)6
C)8
D)10
Question
Use the table below to answer the following question(s).
The Atlas Movies Theater has repriced their ticket rates to maximize revenues.They have three classes of tickets: Classic, Silver, and Gold.The table below provides information on the average ticket sales, revenue and price elasticity on demand.They have a total seating capacity of 300.The table also provides the new price for the three classes obtained using Solver.
Assume the distributions of elasticities for three classes of tickets are uniform with minimum and maximum values equal to 75% and 125% of their estimated values, respectively.Under this assumption, use Monte Carlo simulation to answer the following questions.The model is simulated for 10,000 trials.
What is the probability that more than 300 tickets will be sold?
A)approximately 0.75
B)approximately 0.40
C)approximately 0.60
D)approximately 0.50
Question
Use the table below to answer the following question(s).
Below is a spreadsheet for a hotel overbooking model.
Answer the following question(s)using multiple parameterized simulations.The range of the historical data is 400-430.
If there are 425 reservations and 5 overbooked customers, what is the net revenue generated?
A)$ 58,000
B)$ 58,500
C)$ 59,000
D)$ 59,500
Question
Use the table below to answer the following question(s).
Below is the spreadsheet for a project selection model.
What is the coefficient of variation obtained from the simulation results? [Hint: Choose the approximate value.]
A)0)386
B)0)589
C)0)415
D)0)665
Below is the spreadsheet for a project selection model.
What is the coefficient of variation obtained from the simulation results? [Hint: Choose the approximate value.]
A)0)386
B)0)589
C)0)415
D)0)665
Question
Use the table below to answer the following question(s).
Below is the spreadsheet for a portfolio allocation model.
Assume that the distributions of life insurance annual return is uniform distribution with minimum 4% and maximum 6%, bond mutual funds annual return is normal with mean 7% and standard deviation 1%, stock mutual funds annual return is lognormal with mean 11% and standard deviation 4%.
What is the value of standard deviation obtained from the simulation results for maximizing the total expected return? [Hint: Choose the approximate value.]
A)$ 1,346.78
B)$ 1,890.25
C)$833.19
D)$ 1,578.64
Question
Use the table below to answer the following question(s).
Below is the spreadsheet for a project selection model.
What is the value of mean obtained from the simulation results? [Hint: Choose the approximate value.]
A)$ 405,897
B)$ 358,138
C)$ 266,603
D)$ 452,785
Below is the spreadsheet for a project selection model.
What is the value of mean obtained from the simulation results? [Hint: Choose the approximate value.]
A)$ 405,897
B)$ 358,138
C)$ 266,603
D)$ 452,785
Question
Use the table below to answer the following question(s).
Below is the spreadsheet for a newsvendor model.
Answer the following question(s)using multiple parameterized simulations.The range of the historical data is 40 to 51.
What is the value of mean profit if the purchase quantity is equal to 45?
A)$ 252.0
B)$ 234.0
C)$ 216.0
D)$ 222.0
Below is the spreadsheet for a newsvendor model.
Answer the following question(s)using multiple parameterized simulations.The range of the historical data is 40 to 51.
What is the value of mean profit if the purchase quantity is equal to 45?
A)$ 252.0
B)$ 234.0
C)$ 216.0
D)$ 222.0
Question
Use the table below to answer the following question(s).
Below is the spreadsheet for a portfolio allocation model.
Assume that the distributions of life insurance annual return is uniform distribution with minimum 4% and maximum 6%, bond mutual funds annual return is normal with mean 7% and standard deviation 1%, stock mutual funds annual return is lognormal with mean 11% and standard deviation 4%.
What is the mean absolute deviation obtained from the simulation results for maximizing the total expected return? [Hint: Choose the approximate value.]
A)$ 887.25
B)$ 735.86
C)$ 643.69
D)$ 967.36
Question
Use the table below to answer the following question(s).
Below is a spreadsheet for a hotel overbooking model.
Answer the following question(s)using multiple parameterized simulations.The range of the historical data is 400-430.
What is the number of reservations that will generate the least revenue?
A)400
B)410
C)420
D)430
Below is a spreadsheet for a hotel overbooking model.
Answer the following question(s)using multiple parameterized simulations.The range of the historical data is 400-430.
What is the number of reservations that will generate the least revenue?
A)400
B)410
C)420
D)430
Question
Use the table below to answer the following question(s).
The Atlas Movies Theater has repriced their ticket rates to maximize revenues.They have three classes of tickets: Classic, Silver, and Gold.The table below provides information on the average ticket sales, revenue and price elasticity on demand.They have a total seating capacity of 300.The table also provides the new price for the three classes obtained using Solver.
Assume the distributions of elasticities for three classes of tickets are uniform with minimum and maximum values equal to 75% and 125% of their estimated values, respectively.Under this assumption, use Monte Carlo simulation to answer the following questions.The model is simulated for 10,000 trials.
What is the coefficient of variation obtained from the simulation results?
A)0)086
B)0)120
C)0)014
D)0)048
Question
Use the table below to answer the following question(s).
Below is the spreadsheet for a project selection model.
Which of the following cells is defined as the output cell?
A)B16
B)G16
C)G17
D)G18
Below is the spreadsheet for a project selection model.
Which of the following cells is defined as the output cell?
A)B16
B)G16
C)G17
D)G18
Question
Use the table below to answer the following question(s).
Below is the spreadsheet for a project selection model.
What is the value of standard deviation obtained from the simulation results? [Hint: Choose the approximate value.]
A)$ 89,236
B)$ 177,334
C)$ 236,745
D)$ 107,892
Below is the spreadsheet for a project selection model.
What is the value of standard deviation obtained from the simulation results? [Hint: Choose the approximate value.]
A)$ 89,236
B)$ 177,334
C)$ 236,745
D)$ 107,892
Question
Use the table below to answer the following question(s).
Below is a spreadsheet for a hotel overbooking model.
Answer the following question(s)using multiple parameterized simulations.The range of the historical data is 400-430.
Which of the following is the best number of reservations to accept?
A)400
B)410
C)420
D)430
Below is a spreadsheet for a hotel overbooking model.
Answer the following question(s)using multiple parameterized simulations.The range of the historical data is 400-430.
Which of the following is the best number of reservations to accept?
A)400
B)410
C)420
D)430
Question
Question
Use the table below to answer the following question(s).
Below is the spreadsheet for a project selection model.
A service level is a constraint that represents the probability that demand can be satisfied.
Below is the spreadsheet for a project selection model.
A service level is a constraint that represents the probability that demand can be satisfied.
Question
Use the table below to answer the following question(s).
Below is the spreadsheet for a project selection model.
A value at risk measure is more conservative in nature than a conditional value at risk measure.
Below is the spreadsheet for a project selection model.
A value at risk measure is more conservative in nature than a conditional value at risk measure.
Question
Question
Use the table below to answer the following question(s).
Below is the spreadsheet for a project selection model.
A value at risk measure considers the magnitude of the violation when the constraint is not satisfied.
Below is the spreadsheet for a project selection model.
A value at risk measure considers the magnitude of the violation when the constraint is not satisfied.
Question
Below is the spreadsheet for an economic order quantity model.
Assume that the distribution of demand is normal with a mean of 20,000 and standard deviation of 2,000.The increase in total cost is calculated by adding the holding cost and the ordering cost.
Assume that the distribution of demand is normal with a mean of 20,000 and standard deviation of 2,000.The increase in total cost is calculated by adding the holding cost and the ordering cost.
Question
Question
Use the table below to answer the following question(s).
Below is the spreadsheet for a project selection model.
A chance constraint is one that specifies the fraction of trials in a simulation that must satisfy a constraint.
Below is the spreadsheet for a project selection model.
A chance constraint is one that specifies the fraction of trials in a simulation that must satisfy a constraint.
Question
Question

Unlock Deck
Sign up to unlock the cards in this deck!
Unlock Deck
Unlock Deck
1/50
Play
Full screen (f)
Deck 17: Optimization Models with Uncertainty
1
Use the table below to answer the following question(s).
The Atlas Movies Theater has repriced their ticket rates to maximize revenues.They have three classes of tickets: Classic, Silver, and Gold.The table below provides information on the average ticket sales, revenue and price elasticity on demand.They have a total seating capacity of 300.The table also provides the new price for the three classes obtained using Solver.
Assume the distributions of elasticities for three classes of tickets are uniform with minimum and maximum values equal to 75% and 125% of their estimated values, respectively.Under this assumption, use Monte Carlo simulation to answer the following questions.The model is simulated for 10,000 trials.
Which of the following cells is defined as the output cell?
A)E16
B)E18
C)F17
D)F18
B
2
Use the table below to answer the following question(s).
Below is a spreadsheet for Stone Age Surfboards.
Assume that the finishing time for a pair of Rockwell surfboards is triangular with a minimum value of 1.4, a most likely value of 1.5, and a maximum value of 1.8 and that finishing time for a pair of Limestone surfboards is also triangular with a minimum value of 1.8, a most likely value of 2.0, and a maximum value of 2.4.The number of trials per simulation is equal to 5000.
What is the mean absolute deviation obtained from the simulation results?
A)1)25
B)0)65
C)0)24
D)0)99
D
3
Use the table below to answer the following question(s).
The Atlas Movies Theater has repriced their ticket rates to maximize revenues.They have three classes of tickets: Classic, Silver, and Gold.The table below provides information on the average ticket sales, revenue and price elasticity on demand.They have a total seating capacity of 300.The table also provides the new price for the three classes obtained using Solver.
Assume the distributions of elasticities for three classes of tickets are uniform with minimum and maximum values equal to 75% and 125% of their estimated values, respectively.Under this assumption, use Monte Carlo simulation to answer the following questions.The model is simulated for 10,000 trials.
What is the value of mean obtained from the simulation results?
A)450
B)300
C)400
D)250
B
4
Use the table below to answer the following question(s).
Below is the spreadsheet for an economic order quantity model.
Assume that the distribution of demand is normal with a mean of 20,000 and standard deviation of 2,000.
What is the coefficient of variation obtained from the simulation results?
A)0)28
B)0)10
C)0)45
D)0)60
Below is the spreadsheet for an economic order quantity model.
Assume that the distribution of demand is normal with a mean of 20,000 and standard deviation of 2,000.
What is the coefficient of variation obtained from the simulation results?
A)0)28
B)0)10
C)0)45
D)0)60
Unlock Deck
Unlock for access to all 50 flashcards in this deck.
Unlock Deck
k this deck
5
Use the table below to answer the following question(s).
Below is a spreadsheet for Stone Age Surfboards.
Assume that the finishing time for a pair of Rockwell surfboards is triangular with a minimum value of 1.4, a most likely value of 1.5, and a maximum value of 1.8 and that finishing time for a pair of Limestone surfboards is also triangular with a minimum value of 1.8, a most likely value of 2.0, and a maximum value of 2.4.The number of trials per simulation is equal to 5000.
What is the coefficient of variation obtained from the simulation results?
A)0)098
B)0)134
C)0)047
D)0)020
Unlock Deck
Unlock for access to all 50 flashcards in this deck.
Unlock Deck
k this deck
6
Use the table below to answer the following question(s).
The Atlas Movies Theater has repriced their ticket rates to maximize revenues.They have three classes of tickets: Classic, Silver, and Gold.The table below provides information on the average ticket sales, revenue and price elasticity on demand.They have a total seating capacity of 300.The table also provides the new price for the three classes obtained using Solver.
Assume the distributions of elasticities for three classes of tickets are uniform with minimum and maximum values equal to 75% and 125% of their estimated values, respectively.Under this assumption, use Monte Carlo simulation to answer the following questions.The model is simulated for 10,000 trials.
Which of the following cells are defined to be uniformly distributed?
A)B7:B9
B)C7:C9
C)D7:D9
D)B15:B17
Unlock Deck
Unlock for access to all 50 flashcards in this deck.
Unlock Deck
k this deck
7
Use the table below to answer the following question(s).
Below is the spreadsheet for an economic order quantity model.
Assume that the distribution of demand is normal with a mean of 20,000 and standard deviation of 2,000.
What is the value of standard deviation obtained from the simulation results?
A)35.01
B)49.01
C)56.01
D)41.01
Below is the spreadsheet for an economic order quantity model.
Assume that the distribution of demand is normal with a mean of 20,000 and standard deviation of 2,000.
What is the value of standard deviation obtained from the simulation results?
A)35.01
B)49.01
C)56.01
D)41.01
Unlock Deck
Unlock for access to all 50 flashcards in this deck.
Unlock Deck
k this deck
8
Use the table below to answer the following question(s).
Below is a spreadsheet for Stone Age Surfboards.
Assume that the finishing time for a pair of Rockwell surfboards is triangular with a minimum value of 1.4, a most likely value of 1.5, and a maximum value of 1.8 and that finishing time for a pair of Limestone surfboards is also triangular with a minimum value of 1.8, a most likely value of 2.0, and a maximum value of 2.4.The number of trials per simulation is equal to 5000.
Which of the following cells is defined as the uncertain output cell?
A)D15
B)D16
C)D19
D)D22
Unlock Deck
Unlock for access to all 50 flashcards in this deck.
Unlock Deck
k this deck
9
Use the table below to answer the following question(s).
Below is the spreadsheet for an economic order quantity model.
Assume that the distribution of demand is normal with a mean of 20,000 and standard deviation of 2,000.
What is the increase in total cost?
A)$ 280
B)$ 590
C)$ 355
D)$ 450
Below is the spreadsheet for an economic order quantity model.
Assume that the distribution of demand is normal with a mean of 20,000 and standard deviation of 2,000.
What is the increase in total cost?
A)$ 280
B)$ 590
C)$ 355
D)$ 450
Unlock Deck
Unlock for access to all 50 flashcards in this deck.
Unlock Deck
k this deck
10
Use the table below to answer the following question(s).
Below is the spreadsheet for an economic order quantity model.
Assume that the distribution of demand is normal with a mean of 20,000 and standard deviation of 2,000.
What is the mean absolute deviation obtained from the simulation results?
A)39.10
B)24.56
C)58.75
D)46.36
Below is the spreadsheet for an economic order quantity model.
Assume that the distribution of demand is normal with a mean of 20,000 and standard deviation of 2,000.
What is the mean absolute deviation obtained from the simulation results?
A)39.10
B)24.56
C)58.75
D)46.36
Unlock Deck
Unlock for access to all 50 flashcards in this deck.
Unlock Deck
k this deck
11
Use the table below to answer the following question(s).
Below is the spreadsheet for an economic order quantity model.
Assume that the distribution of demand is normal with a mean of 20,000 and standard deviation of 2,000.
What is the value of mean obtained from the simulation results?
A)473.0
B)520.0
C)456.0
D)490.0
Below is the spreadsheet for an economic order quantity model.
Assume that the distribution of demand is normal with a mean of 20,000 and standard deviation of 2,000.
What is the value of mean obtained from the simulation results?
A)473.0
B)520.0
C)456.0
D)490.0
Unlock Deck
Unlock for access to all 50 flashcards in this deck.
Unlock Deck
k this deck
12
Use the table below to answer the following question(s).
Below is the spreadsheet for an economic order quantity model.
Assume that the distribution of demand is normal with a mean of 20,000 and standard deviation of 2,000.
What is the reorder point required to attain a 95% service level?
A)460.0
B)750.5
C)571.0
D)640.5
Below is the spreadsheet for an economic order quantity model.
Assume that the distribution of demand is normal with a mean of 20,000 and standard deviation of 2,000.
What is the reorder point required to attain a 95% service level?
A)460.0
B)750.5
C)571.0
D)640.5
Unlock Deck
Unlock for access to all 50 flashcards in this deck.
Unlock Deck
k this deck
13
Use the table below to answer the following question(s).
Below is a spreadsheet for Stone Age Surfboards.
Assume that the finishing time for a pair of Rockwell surfboards is triangular with a minimum value of 1.4, a most likely value of 1.5, and a maximum value of 1.8 and that finishing time for a pair of Limestone surfboards is also triangular with a minimum value of 1.8, a most likely value of 2.0, and a maximum value of 2.4.The number of trials per simulation is equal to 5000.
How often will overtime be needed if 4.5 Rockwell and 9.0 Limestone surfboards, the optimal solution, are scheduled each day?
A)more than 60%
B)more than 87%
C)more than 75%
D)more than 52%
Unlock Deck
Unlock for access to all 50 flashcards in this deck.
Unlock Deck
k this deck
14
Use the table below to answer the following question(s).
Below is the spreadsheet for an economic order quantity model.
Assume that the distribution of demand is normal with a mean of 20,000 and standard deviation of 2,000.
Which of the following cells is defined as the uncertain output cell?
A)B13
B)C15
C)C19
D)B22
Below is the spreadsheet for an economic order quantity model.
Assume that the distribution of demand is normal with a mean of 20,000 and standard deviation of 2,000.
Which of the following cells is defined as the uncertain output cell?
A)B13
B)C15
C)C19
D)B22
Unlock Deck
Unlock for access to all 50 flashcards in this deck.
Unlock Deck
k this deck
15
Use the table below to answer the following question(s).
Below is a spreadsheet for Stone Age Surfboards.
Assume that the finishing time for a pair of Rockwell surfboards is triangular with a minimum value of 1.4, a most likely value of 1.5, and a maximum value of 1.8 and that finishing time for a pair of Limestone surfboards is also triangular with a minimum value of 1.8, a most likely value of 2.0, and a maximum value of 2.4.The number of trials per simulation is equal to 5000.
What is the value of standard deviation obtained from the simulation results?
A)1)21
B)2)50
C)3)80
D)5)00
Unlock Deck
Unlock for access to all 50 flashcards in this deck.
Unlock Deck
k this deck
16
Use the table below to answer the following question(s).
The Atlas Movies Theater has repriced their ticket rates to maximize revenues.They have three classes of tickets: Classic, Silver, and Gold.The table below provides information on the average ticket sales, revenue and price elasticity on demand.They have a total seating capacity of 300.The table also provides the new price for the three classes obtained using Solver.
Assume the distributions of elasticities for three classes of tickets are uniform with minimum and maximum values equal to 75% and 125% of their estimated values, respectively.Under this assumption, use Monte Carlo simulation to answer the following questions.The model is simulated for 10,000 trials.
What is the value of standard deviation obtained from the simulation results?
A)5
B)4
C)8
D)10
Unlock Deck
Unlock for access to all 50 flashcards in this deck.
Unlock Deck
k this deck
17
Use the table below to answer the following question(s).
Below is a spreadsheet for Stone Age Surfboards.
Assume that the finishing time for a pair of Rockwell surfboards is triangular with a minimum value of 1.4, a most likely value of 1.5, and a maximum value of 1.8 and that finishing time for a pair of Limestone surfboards is also triangular with a minimum value of 1.8, a most likely value of 2.0, and a maximum value of 2.4.The number of trials per simulation is equal to 5000.
Which of the following cells is defined with a triangular distribution?
A)B6
B)D6
C)B7
D)D7
Unlock Deck
Unlock for access to all 50 flashcards in this deck.
Unlock Deck
k this deck
18
Use the table below to answer the following question(s).
Below is the spreadsheet for an economic order quantity model.
Assume that the distribution of demand is normal with a mean of 20,000 and standard deviation of 2,000.
Which of the following cells is defined to be normally distributed using the function = PsiNormal(20000,2000)?
A)B5
B)B6
C)B7
D)B12
Below is the spreadsheet for an economic order quantity model.
Assume that the distribution of demand is normal with a mean of 20,000 and standard deviation of 2,000.
Which of the following cells is defined to be normally distributed using the function = PsiNormal(20000,2000)?
A)B5
B)B6
C)B7
D)B12
Unlock Deck
Unlock for access to all 50 flashcards in this deck.
Unlock Deck
k this deck
19
Use the table below to answer the following question(s).
Below is a spreadsheet for Stone Age Surfboards.
Assume that the finishing time for a pair of Rockwell surfboards is triangular with a minimum value of 1.4, a most likely value of 1.5, and a maximum value of 1.8 and that finishing time for a pair of Limestone surfboards is also triangular with a minimum value of 1.8, a most likely value of 2.0, and a maximum value of 2.4.The number of trials per simulation is equal to 5000.
What is the value of mean obtained from the simulation results?
A)15.65
B)25.91
C)20.78
D)30.42
Unlock Deck
Unlock for access to all 50 flashcards in this deck.
Unlock Deck
k this deck
20
Use the table below to answer the following question(s).
Below is the spreadsheet for an economic order quantity model.
Assume that the distribution of demand is normal with a mean of 20,000 and standard deviation of 2,000.
What is the value of safety stock?
A)45
B)71
C)120
D)95
Below is the spreadsheet for an economic order quantity model.
Assume that the distribution of demand is normal with a mean of 20,000 and standard deviation of 2,000.
What is the value of safety stock?
A)45
B)71
C)120
D)95
Unlock Deck
Unlock for access to all 50 flashcards in this deck.
Unlock Deck
k this deck
21
Use the table below to answer the following question(s).
Below is the spreadsheet for a newsvendor model.
Answer the following question(s)using multiple parameterized simulations.The range of the historical data is 40 to 51.
Which of the following is the best purchase quantity to maximize the expected profit?
A)42
B)45
C)48
D)51
Below is the spreadsheet for a newsvendor model.
Answer the following question(s)using multiple parameterized simulations.The range of the historical data is 40 to 51.
Which of the following is the best purchase quantity to maximize the expected profit?
A)42
B)45
C)48
D)51
Unlock Deck
Unlock for access to all 50 flashcards in this deck.
Unlock Deck
k this deck
22
Use the table below to answer the following question(s).
Below is the spreadsheet for a portfolio allocation model.
Assume that the distributions of life insurance annual return is uniform distribution with minimum 4% and maximum 6%, bond mutual funds annual return is normal with mean 7% and standard deviation 1%, stock mutual funds annual return is lognormal with mean 11% and standard deviation 4%.
What is the value of the mean obtained from the simulation results for maximizing the total expected return? [Hint: Choose the approximate value.]
A)$ 5,876.28
B)$ 6,570.42
C)$ 7,257.45
D)$ 5,178.84
Unlock Deck
Unlock for access to all 50 flashcards in this deck.
Unlock Deck
k this deck
23
Use the table below to answer the following question(s).
Below is a spreadsheet for a hotel overbooking model.
Answer the following question(s)using multiple parameterized simulations.The range of the historical data is 400-430.
What is the number of reservations that will generate a net revenue of $59,000?
A)400
B)410
C)420
D)430
Below is a spreadsheet for a hotel overbooking model.
Answer the following question(s)using multiple parameterized simulations.The range of the historical data is 400-430.
What is the number of reservations that will generate a net revenue of $59,000?
A)400
B)410
C)420
D)430
Unlock Deck
Unlock for access to all 50 flashcards in this deck.
Unlock Deck
k this deck
24
Use the table below to answer the following question(s).
Below is the spreadsheet for a portfolio allocation model.
Assume that the distributions of life insurance annual return is uniform distribution with minimum 4% and maximum 6%, bond mutual funds annual return is normal with mean 7% and standard deviation 1%, stock mutual funds annual return is lognormal with mean 11% and standard deviation 4%.
What is the coefficient of variation obtained from the simulation results for maximizing the total expected return? [Hint: Choose the approximate value.]
A)1)2451
B)0)4865
C)0)8917
D)0)1268
Unlock Deck
Unlock for access to all 50 flashcards in this deck.
Unlock Deck
k this deck
25
Use the table below to answer the following question(s).
Below is the spreadsheet for a portfolio allocation model.
Assume that the distributions of life insurance annual return is uniform distribution with minimum 4% and maximum 6%, bond mutual funds annual return is normal with mean 7% and standard deviation 1%, stock mutual funds annual return is lognormal with mean 11% and standard deviation 4%.
What is the value of mode obtained from the simulation results for maximizing the total expected return? [Hint: Choose the approximate value.]
A)$ 6,553.02
B)$ 5,848.24
C)$ 5,281.79
D)$ 7,025.86
Unlock Deck
Unlock for access to all 50 flashcards in this deck.
Unlock Deck
k this deck
26
Use the table below to answer the following question(s).
Below is the spreadsheet for a project selection model.
What is the mean absolute deviation obtained from the simulation results? [Hint: Choose the approximate value.]
A)$ 141,901
B)$ 104,786
C)$ 188,995
D)$ 232,673
Below is the spreadsheet for a project selection model.
What is the mean absolute deviation obtained from the simulation results? [Hint: Choose the approximate value.]
A)$ 141,901
B)$ 104,786
C)$ 188,995
D)$ 232,673
Unlock Deck
Unlock for access to all 50 flashcards in this deck.
Unlock Deck
k this deck
27
Use the table below to answer the following question(s).
Below is the spreadsheet for a newsvendor model.
Answer the following question(s)using multiple parameterized simulations.The range of the historical data is 40 to 51.
Which of the following values of purchase quantity shows the least mean profit?
A)42
B)45
C)48
D)51
Below is the spreadsheet for a newsvendor model.
Answer the following question(s)using multiple parameterized simulations.The range of the historical data is 40 to 51.
Which of the following values of purchase quantity shows the least mean profit?
A)42
B)45
C)48
D)51
Unlock Deck
Unlock for access to all 50 flashcards in this deck.
Unlock Deck
k this deck
28
Use the table below to answer the following question(s).
The Atlas Movies Theater has repriced their ticket rates to maximize revenues.They have three classes of tickets: Classic, Silver, and Gold.The table below provides information on the average ticket sales, revenue and price elasticity on demand.They have a total seating capacity of 300.The table also provides the new price for the three classes obtained using Solver.
Assume the distributions of elasticities for three classes of tickets are uniform with minimum and maximum values equal to 75% and 125% of their estimated values, respectively.Under this assumption, use Monte Carlo simulation to answer the following questions.The model is simulated for 10,000 trials.
What is the mean absolute deviation obtained from the simulation results?
A)3
B)6
C)8
D)10
Unlock Deck
Unlock for access to all 50 flashcards in this deck.
Unlock Deck
k this deck
29
Use the table below to answer the following question(s).
The Atlas Movies Theater has repriced their ticket rates to maximize revenues.They have three classes of tickets: Classic, Silver, and Gold.The table below provides information on the average ticket sales, revenue and price elasticity on demand.They have a total seating capacity of 300.The table also provides the new price for the three classes obtained using Solver.
Assume the distributions of elasticities for three classes of tickets are uniform with minimum and maximum values equal to 75% and 125% of their estimated values, respectively.Under this assumption, use Monte Carlo simulation to answer the following questions.The model is simulated for 10,000 trials.
What is the probability that more than 300 tickets will be sold?
A)approximately 0.75
B)approximately 0.40
C)approximately 0.60
D)approximately 0.50
Unlock Deck
Unlock for access to all 50 flashcards in this deck.
Unlock Deck
k this deck
30
Use the table below to answer the following question(s).
Below is a spreadsheet for a hotel overbooking model.
Answer the following question(s)using multiple parameterized simulations.The range of the historical data is 400-430.
If there are 425 reservations and 5 overbooked customers, what is the net revenue generated?
A)$ 58,000
B)$ 58,500
C)$ 59,000
D)$ 59,500
Unlock Deck
Unlock for access to all 50 flashcards in this deck.
Unlock Deck
k this deck
31
Use the table below to answer the following question(s).
Below is the spreadsheet for a project selection model.
What is the coefficient of variation obtained from the simulation results? [Hint: Choose the approximate value.]
A)0)386
B)0)589
C)0)415
D)0)665
Below is the spreadsheet for a project selection model.
What is the coefficient of variation obtained from the simulation results? [Hint: Choose the approximate value.]
A)0)386
B)0)589
C)0)415
D)0)665
Unlock Deck
Unlock for access to all 50 flashcards in this deck.
Unlock Deck
k this deck
32
Use the table below to answer the following question(s).
Below is the spreadsheet for a portfolio allocation model.
Assume that the distributions of life insurance annual return is uniform distribution with minimum 4% and maximum 6%, bond mutual funds annual return is normal with mean 7% and standard deviation 1%, stock mutual funds annual return is lognormal with mean 11% and standard deviation 4%.
What is the value of standard deviation obtained from the simulation results for maximizing the total expected return? [Hint: Choose the approximate value.]
A)$ 1,346.78
B)$ 1,890.25
C)$833.19
D)$ 1,578.64
Unlock Deck
Unlock for access to all 50 flashcards in this deck.
Unlock Deck
k this deck
33
Use the table below to answer the following question(s).
Below is the spreadsheet for a project selection model.
What is the value of mean obtained from the simulation results? [Hint: Choose the approximate value.]
A)$ 405,897
B)$ 358,138
C)$ 266,603
D)$ 452,785
Below is the spreadsheet for a project selection model.
What is the value of mean obtained from the simulation results? [Hint: Choose the approximate value.]
A)$ 405,897
B)$ 358,138
C)$ 266,603
D)$ 452,785
Unlock Deck
Unlock for access to all 50 flashcards in this deck.
Unlock Deck
k this deck
34
Use the table below to answer the following question(s).
Below is the spreadsheet for a newsvendor model.
Answer the following question(s)using multiple parameterized simulations.The range of the historical data is 40 to 51.
What is the value of mean profit if the purchase quantity is equal to 45?
A)$ 252.0
B)$ 234.0
C)$ 216.0
D)$ 222.0
Below is the spreadsheet for a newsvendor model.
Answer the following question(s)using multiple parameterized simulations.The range of the historical data is 40 to 51.
What is the value of mean profit if the purchase quantity is equal to 45?
A)$ 252.0
B)$ 234.0
C)$ 216.0
D)$ 222.0
Unlock Deck
Unlock for access to all 50 flashcards in this deck.
Unlock Deck
k this deck
35
Use the table below to answer the following question(s).
Below is the spreadsheet for a portfolio allocation model.
Assume that the distributions of life insurance annual return is uniform distribution with minimum 4% and maximum 6%, bond mutual funds annual return is normal with mean 7% and standard deviation 1%, stock mutual funds annual return is lognormal with mean 11% and standard deviation 4%.
What is the mean absolute deviation obtained from the simulation results for maximizing the total expected return? [Hint: Choose the approximate value.]
A)$ 887.25
B)$ 735.86
C)$ 643.69
D)$ 967.36
Unlock Deck
Unlock for access to all 50 flashcards in this deck.
Unlock Deck
k this deck
36
Use the table below to answer the following question(s).
Below is a spreadsheet for a hotel overbooking model.
Answer the following question(s)using multiple parameterized simulations.The range of the historical data is 400-430.
What is the number of reservations that will generate the least revenue?
A)400
B)410
C)420
D)430
Below is a spreadsheet for a hotel overbooking model.
Answer the following question(s)using multiple parameterized simulations.The range of the historical data is 400-430.
What is the number of reservations that will generate the least revenue?
A)400
B)410
C)420
D)430
Unlock Deck
Unlock for access to all 50 flashcards in this deck.
Unlock Deck
k this deck
37
Use the table below to answer the following question(s).
The Atlas Movies Theater has repriced their ticket rates to maximize revenues.They have three classes of tickets: Classic, Silver, and Gold.The table below provides information on the average ticket sales, revenue and price elasticity on demand.They have a total seating capacity of 300.The table also provides the new price for the three classes obtained using Solver.
Assume the distributions of elasticities for three classes of tickets are uniform with minimum and maximum values equal to 75% and 125% of their estimated values, respectively.Under this assumption, use Monte Carlo simulation to answer the following questions.The model is simulated for 10,000 trials.
What is the coefficient of variation obtained from the simulation results?
A)0)086
B)0)120
C)0)014
D)0)048
Unlock Deck
Unlock for access to all 50 flashcards in this deck.
Unlock Deck
k this deck
38
Use the table below to answer the following question(s).
Below is the spreadsheet for a project selection model.
Which of the following cells is defined as the output cell?
A)B16
B)G16
C)G17
D)G18
Below is the spreadsheet for a project selection model.
Which of the following cells is defined as the output cell?
A)B16
B)G16
C)G17
D)G18
Unlock Deck
Unlock for access to all 50 flashcards in this deck.
Unlock Deck
k this deck
39
Use the table below to answer the following question(s).
Below is the spreadsheet for a project selection model.
What is the value of standard deviation obtained from the simulation results? [Hint: Choose the approximate value.]
A)$ 89,236
B)$ 177,334
C)$ 236,745
D)$ 107,892
Below is the spreadsheet for a project selection model.
What is the value of standard deviation obtained from the simulation results? [Hint: Choose the approximate value.]
A)$ 89,236
B)$ 177,334
C)$ 236,745
D)$ 107,892
Unlock Deck
Unlock for access to all 50 flashcards in this deck.
Unlock Deck
k this deck
40
Use the table below to answer the following question(s).
Below is a spreadsheet for a hotel overbooking model.
Answer the following question(s)using multiple parameterized simulations.The range of the historical data is 400-430.
Which of the following is the best number of reservations to accept?
A)400
B)410
C)420
D)430
Below is a spreadsheet for a hotel overbooking model.
Answer the following question(s)using multiple parameterized simulations.The range of the historical data is 400-430.
Which of the following is the best number of reservations to accept?
A)400
B)410
C)420
D)430
Unlock Deck
Unlock for access to all 50 flashcards in this deck.
Unlock Deck
k this deck
41
What is a value at risk constraint?
Unlock Deck
Unlock for access to all 50 flashcards in this deck.
Unlock Deck
k this deck
42
Use the table below to answer the following question(s).
Below is the spreadsheet for a project selection model.
A service level is a constraint that represents the probability that demand can be satisfied.
Below is the spreadsheet for a project selection model.
A service level is a constraint that represents the probability that demand can be satisfied.
Unlock Deck
Unlock for access to all 50 flashcards in this deck.
Unlock Deck
k this deck
43
Use the table below to answer the following question(s).
Below is the spreadsheet for a project selection model.
A value at risk measure is more conservative in nature than a conditional value at risk measure.
Below is the spreadsheet for a project selection model.
A value at risk measure is more conservative in nature than a conditional value at risk measure.
Unlock Deck
Unlock for access to all 50 flashcards in this deck.
Unlock Deck
k this deck
44
Define a chance constraint.
Unlock Deck
Unlock for access to all 50 flashcards in this deck.
Unlock Deck
k this deck
45
Use the table below to answer the following question(s).
Below is the spreadsheet for a project selection model.
A value at risk measure considers the magnitude of the violation when the constraint is not satisfied.
Below is the spreadsheet for a project selection model.
A value at risk measure considers the magnitude of the violation when the constraint is not satisfied.
Unlock Deck
Unlock for access to all 50 flashcards in this deck.
Unlock Deck
k this deck
46
Below is the spreadsheet for an economic order quantity model.
Assume that the distribution of demand is normal with a mean of 20,000 and standard deviation of 2,000.The increase in total cost is calculated by adding the holding cost and the ordering cost.
Assume that the distribution of demand is normal with a mean of 20,000 and standard deviation of 2,000.The increase in total cost is calculated by adding the holding cost and the ordering cost.
Unlock Deck
Unlock for access to all 50 flashcards in this deck.
Unlock Deck
k this deck
47
What is a conditional value at risk constraint?
Unlock Deck
Unlock for access to all 50 flashcards in this deck.
Unlock Deck
k this deck
48
Use the table below to answer the following question(s).
Below is the spreadsheet for a project selection model.
A chance constraint is one that specifies the fraction of trials in a simulation that must satisfy a constraint.
Below is the spreadsheet for a project selection model.
A chance constraint is one that specifies the fraction of trials in a simulation that must satisfy a constraint.
Unlock Deck
Unlock for access to all 50 flashcards in this deck.
Unlock Deck
k this deck
49
What is a service level?
Unlock Deck
Unlock for access to all 50 flashcards in this deck.
Unlock Deck
k this deck
50
What are multiple parameterized simulations?
Unlock Deck
Unlock for access to all 50 flashcards in this deck.
Unlock Deck
k this deck
Unlock Deck
Unlock for access to all 50 flashcards in this deck.


