Deck 12: Correlation R and Regression Y BX A
Full screen (f)
Question
Question
Question
Question
Question
Question
Question
Question
Question
Question
Question
Question
Question
Question
Question
Question
Question
Question
Question
Question
Question
Question
Question
Question
Question
Question
Question
Question
Question
Question
Question
Question
Question
Question
Question
Question
Question
Question
Question
Question
Question
Question
Question
Question
Question
Question
Question
Question
Question
Question
Question
Question
Question
Question
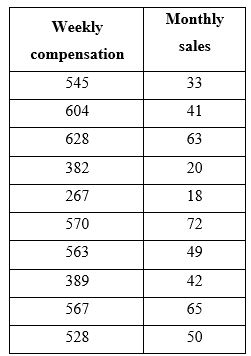 You run a used car dealership and want to know if you are appropriately compensating your sales force, so you collect weekly compensation rates and counts of monthly sales with the intent of comparing them.
1)What is the research question?
2)What are the hypotheses?
3)What are the degrees of freedom for the statistical significance test?
4)What is the critical value for this test?
5)State the formal results of the test.
6)Should you compute a coefficient of determination? How do you know? If so, calculate it.
7)Regress sales on compensation, and report the formula for the regression line here.
8)State all appropriate conclusions.
9)If a salesperson was compensated 450, what would we expect sales to be?

Unlock Deck
Sign up to unlock the cards in this deck!
Unlock Deck
Unlock Deck
1/54
Play
Full screen (f)
Deck 12: Correlation R and Regression Y BX A
1
Correlation is similar to the χ2 test of independence in that ______.
A) both require interval or ratio level measurement
B) both examine the relationship between two variables
C) both are non-parametric tests
D) all of these
A) both require interval or ratio level measurement
B) both examine the relationship between two variables
C) both are non-parametric tests
D) all of these
B
2
Which of these is a name for r?
A) correlation coefficient
B) Pearson's r
C) Pearson's product-moment correlation coefficient
D) all of these
A) correlation coefficient
B) Pearson's r
C) Pearson's product-moment correlation coefficient
D) all of these
D
3
Pearson's r is ______.
A) an index of linear relationship between two interval or ratio variables
B) an index of curvilinear relationship between two interval or ratio variables
C) an index of linear relationship between two nominal or ordinal variables
D) an index of curvilinear relationship between two nominal or ordinal variables
A
4
A linear relationship is a relationship that ______.
A) follows a straight line
B) follows a curved line
C) follows a straight or curved line
D) none of these
A) follows a straight line
B) follows a curved line
C) follows a straight or curved line
D) none of these
Unlock Deck
Unlock for access to all 54 flashcards in this deck.
Unlock Deck
k this deck
5
To people unfamiliar with statistics, "correlation" most likely is used a synonym for ______.
A) linear relationship
B) relationship
C) curvilinear relationship
D) none of these
A) linear relationship
B) relationship
C) curvilinear relationship
D) none of these
Unlock Deck
Unlock for access to all 54 flashcards in this deck.
Unlock Deck
k this deck
6
The value of a correlation reflects ______.
A) one piece of information: magnitude
B) two pieces of information: magnitude and direction
C) three pieces of information: magnitude, direction, and strength
D) none of these
A) one piece of information: magnitude
B) two pieces of information: magnitude and direction
C) three pieces of information: magnitude, direction, and strength
D) none of these
Unlock Deck
Unlock for access to all 54 flashcards in this deck.
Unlock Deck
k this deck
7
A correlation of -1 could be described as ______.
A) perfect relationship
B) imperfect relationship
C) null relationship
D) none of these
A) perfect relationship
B) imperfect relationship
C) null relationship
D) none of these
Unlock Deck
Unlock for access to all 54 flashcards in this deck.
Unlock Deck
k this deck
8
As compensation increases, turnover decreases. This describes ______.
A) no relationship
B) a positive relationship
C) a negative relationship
D) a perfect relationship
A) no relationship
B) a positive relationship
C) a negative relationship
D) a perfect relationship
Unlock Deck
Unlock for access to all 54 flashcards in this deck.
Unlock Deck
k this deck
9
Which of these describes the strongest relationship?
A) r = .7
B) r = .6
C) r = -.8
D) These correlations do not differ in strength.
A) r = .7
B) r = .6
C) r = -.8
D) These correlations do not differ in strength.
Unlock Deck
Unlock for access to all 54 flashcards in this deck.
Unlock Deck
k this deck
10
A scatterplot depicting a circular cloud of data could be described as ______.
A) a negative relationship
B) a positive relationship
C) a perfect relationship
D) no relationship
A) a negative relationship
B) a positive relationship
C) a perfect relationship
D) no relationship
Unlock Deck
Unlock for access to all 54 flashcards in this deck.
Unlock Deck
k this deck
11
As CEO compensation decreases, stock price decreases. This describes ______.
A) a negative relationship
B) no relationship
C) a positive relationship
D) a perfect relationship
A) a negative relationship
B) no relationship
C) a positive relationship
D) a perfect relationship
Unlock Deck
Unlock for access to all 54 flashcards in this deck.
Unlock Deck
k this deck
12
When employees are very relaxed (not at all stressed), they perform poorly. When employees are concerned about meeting deadlines (somewhat stressed), they perform strongly. When employees are overwhelmed (very stressed), they perform poorly. The relationship between stress and performance can be described as ______.
A) positive
B) negative
C) linear
D) curvilinear
A) positive
B) negative
C) linear
D) curvilinear
Unlock Deck
Unlock for access to all 54 flashcards in this deck.
Unlock Deck
k this deck
13
A correlation is a ______ covariance.
A) curvilinear
B) standardized
C) linear
D) none of these
A) curvilinear
B) standardized
C) linear
D) none of these
Unlock Deck
Unlock for access to all 54 flashcards in this deck.
Unlock Deck
k this deck
14
The covariance is different from the variance in that the covariance ______.
A) incorporates information about two variables
B) standardizes the variability in both variables
C) incorporates the sum of the differences between scores and their means
D) none of these; they are the same.
A) incorporates information about two variables
B) standardizes the variability in both variables
C) incorporates the sum of the differences between scores and their means
D) none of these; they are the same.
Unlock Deck
Unlock for access to all 54 flashcards in this deck.
Unlock Deck
k this deck
15
Given a dataset where r = .8, adding a new case where the value of x is high and the value of y is high is most likely to ______.
A) increase the magnitude of the correlation
B) decrease the magnitude of the correlation
C) have no effect on the correlation
D) skew the correlation
A) increase the magnitude of the correlation
B) decrease the magnitude of the correlation
C) have no effect on the correlation
D) skew the correlation
Unlock Deck
Unlock for access to all 54 flashcards in this deck.
Unlock Deck
k this deck
16
Given a dataset where r = -.9, adding a new case where the value of x is high and the value of y is low is most likely to ______.
A) increase the magnitude of the correlation
B) decrease the magnitude of the correlation
C) have no effect on the correlation
D) skew the correlation
A) increase the magnitude of the correlation
B) decrease the magnitude of the correlation
C) have no effect on the correlation
D) skew the correlation
Unlock Deck
Unlock for access to all 54 flashcards in this deck.
Unlock Deck
k this deck
17
The value of correlation over covariance is that correlation ______.
A) better describes linear relationships
B) better describes curvilinear relationships
C) can be used to compare across relationships with dissimilar variables
D) none of these
A) better describes linear relationships
B) better describes curvilinear relationships
C) can be used to compare across relationships with dissimilar variables
D) none of these
Unlock Deck
Unlock for access to all 54 flashcards in this deck.
Unlock Deck
k this deck
18
Which of the following is a valid null hypothesis to test a correlation?
A) H1: = 0
B) H1: = 0
C) H1: = 0
D) H1: = 0
A) H1: = 0
B) H1: = 0
C) H1: = 0
D) H1: = 0
Unlock Deck
Unlock for access to all 54 flashcards in this deck.
Unlock Deck
k this deck
19
What is the critical value for a correlation where n = 14?
A) t = ±2.160
B) t = ±2.179
C) r = ±2.160
D) r = ±2.179
A) t = ±2.160
B) t = ±2.179
C) r = ±2.160
D) r = ±2.179
Unlock Deck
Unlock for access to all 54 flashcards in this deck.
Unlock Deck
k this deck
20
Significance tests for correlation are generally ______.
A) directional
B) linear
C) non-directional
D) curvilinear
A) directional
B) linear
C) non-directional
D) curvilinear
Unlock Deck
Unlock for access to all 54 flashcards in this deck.
Unlock Deck
k this deck
21
The conduct a significance test on a correlation, we must ______.
A) consult an r-table
B) convert the correlation to t and consult a t-table
C) convert the correlation to z and consult a z-table
D) none of these
A) consult an r-table
B) convert the correlation to t and consult a t-table
C) convert the correlation to z and consult a z-table
D) none of these
Unlock Deck
Unlock for access to all 54 flashcards in this deck.
Unlock Deck
k this deck
22
You find a correlation of .5. What percentage of variability in your x-variable can be explained by your y-variable?
A) 50%
B) 5%
C) 25%
D) none of these
A) 50%
B) 5%
C) 25%
D) none of these
Unlock Deck
Unlock for access to all 54 flashcards in this deck.
Unlock Deck
k this deck
23
The coefficient of determination is found to be .81. What is the value of r?
A) .81
B) .09
C) .90
D) none of these
A) .81
B) .09
C) .90
D) none of these
Unlock Deck
Unlock for access to all 54 flashcards in this deck.
Unlock Deck
k this deck
24
If the correlation between sales and profit is .7, what percentage of variance in sales is unshared with variance in profit?
A) 70%
B) 30%
C) 49%
D) 51%
A) 70%
B) 30%
C) 49%
D) 51%
Unlock Deck
Unlock for access to all 54 flashcards in this deck.
Unlock Deck
k this deck
25
The Director of Training at our organization wants to provide training to all salespeople across all branches of our organization. If we regressed training scores on instructor quality, ______ would be our x variable, and ______ would be our y variable.
A) Instructor quality, training scores
B) training scores, branch
C) branch, training scores
D) training scores, instructor quality
A) Instructor quality, training scores
B) training scores, branch
C) branch, training scores
D) training scores, instructor quality
Unlock Deck
Unlock for access to all 54 flashcards in this deck.
Unlock Deck
k this deck
26
The line of best fit is the best line that can be used to describe ______.
A) the relative directions of the correlations
B) the relationship between two variables
C) the relative magnitudes of correlations
D) none of these
A) the relative directions of the correlations
B) the relationship between two variables
C) the relative magnitudes of correlations
D) none of these
Unlock Deck
Unlock for access to all 54 flashcards in this deck.
Unlock Deck
k this deck
27
Regression can also be called least squares regression because ______.
A) it produces a line minimizing the sum of squared residuals
B) it produces a line minimizing the squared residuals
C) it produces a line minimizing the squares
D) none of these
A) it produces a line minimizing the sum of squared residuals
B) it produces a line minimizing the squared residuals
C) it produces a line minimizing the squares
D) none of these
Unlock Deck
Unlock for access to all 54 flashcards in this deck.
Unlock Deck
k this deck
28
If we find a correlation between training and job performance, we can conclude ______.
A) training causes job performance
B) job performance causes training
C) both a and b
D) none of these
A) training causes job performance
B) job performance causes training
C) both a and b
D) none of these
Unlock Deck
Unlock for access to all 54 flashcards in this deck.
Unlock Deck
k this deck
29
We have conducted a regression discovering that y′ = 12x - 10. If the predictor is valued at 1, the value of the criterion is predicted to be ______.
A) 2
B) 0.92
C) 1
D) none of these
A) 2
B) 0.92
C) 1
D) none of these
Unlock Deck
Unlock for access to all 54 flashcards in this deck.
Unlock Deck
k this deck
30
In this regression formula (y′ = 2x + 1), the "1" is the ______ and the "2" is the ______ .
A) slope, intercept
B) intercept, slope
C) predictor, criterion
D) criterion, predictor
A) slope, intercept
B) intercept, slope
C) predictor, criterion
D) criterion, predictor
Unlock Deck
Unlock for access to all 54 flashcards in this deck.
Unlock Deck
k this deck
31
Pearson's r is the most common type of correlation.
Unlock Deck
Unlock for access to all 54 flashcards in this deck.
Unlock Deck
k this deck
32
When calculating a correlation, the variable you choose for x and the variable you choose for y is critical to interpretation.
Unlock Deck
Unlock for access to all 54 flashcards in this deck.
Unlock Deck
k this deck
33
A Pearson's product-moment correlation coefficient is often abbreviated as "correlation."
Unlock Deck
Unlock for access to all 54 flashcards in this deck.
Unlock Deck
k this deck
34
A correlation of -.8 is stronger than a correlation of .6.
Unlock Deck
Unlock for access to all 54 flashcards in this deck.
Unlock Deck
k this deck
35
If you can predict y from x with 100% accuracy, you can refer to this as a perfect relationship.
Unlock Deck
Unlock for access to all 54 flashcards in this deck.
Unlock Deck
k this deck
36
As one variable goes down, the other goes down. This describes a positive relationship.
Unlock Deck
Unlock for access to all 54 flashcards in this deck.
Unlock Deck
k this deck
37
The covariance formula differs from the variance formula in that instead of squaring the difference between each score and its mean, we multiply the difference between each x score and its mean with each y score and its mean.
Unlock Deck
Unlock for access to all 54 flashcards in this deck.
Unlock Deck
k this deck
38
If r = -.8, adding a case that is high on x and high on y will result in a stronger correlation.
Unlock Deck
Unlock for access to all 54 flashcards in this deck.
Unlock Deck
k this deck
39
A correlation can be calculated by adding each multiplied pair of z-scores together and dividing by degrees of freedom.
Unlock Deck
Unlock for access to all 54 flashcards in this deck.
Unlock Deck
k this deck
40
H1: = 0 is a valid alternative hypothesis for testing the statistical significance of a correlation.
Unlock Deck
Unlock for access to all 54 flashcards in this deck.
Unlock Deck
k this deck
41
Correlation can be tested for statistical significance by converting it to a t-statistic and testing it against a t-distribution with (n - 1) degrees of freedom.
Unlock Deck
Unlock for access to all 54 flashcards in this deck.
Unlock Deck
k this deck
42
If r(8) = 1.2, p > .05, there must have been a sample size of 10.
Unlock Deck
Unlock for access to all 54 flashcards in this deck.
Unlock Deck
k this deck
43
If r = .6, 36% of the variance in each variable is explained by the other.
Unlock Deck
Unlock for access to all 54 flashcards in this deck.
Unlock Deck
k this deck
44
A regression line can be used to predict values outside the range of the original predictor.
Unlock Deck
Unlock for access to all 54 flashcards in this deck.
Unlock Deck
k this deck
45
In regression, the slope can be determined by dividing the rise by the run of the regression line.
Unlock Deck
Unlock for access to all 54 flashcards in this deck.
Unlock Deck
k this deck
46
In regression, we always regress the y variable on the x variable.
Unlock Deck
Unlock for access to all 54 flashcards in this deck.
Unlock Deck
k this deck
47
In the following regression line, the intercept is 5: y′ = 23x - 5
Unlock Deck
Unlock for access to all 54 flashcards in this deck.
Unlock Deck
k this deck
48
In regression, the predictor is also called the dependent variable and the criterion is also called the independent variable.
Unlock Deck
Unlock for access to all 54 flashcards in this deck.
Unlock Deck
k this deck
49
Causation can only be determined by experimental design - not statistics alone.
Unlock Deck
Unlock for access to all 54 flashcards in this deck.
Unlock Deck
k this deck
50
Correlation and the χ2 test of independence are similar in purpose with a few key differences. Describe how are these tests are similar. Describe how they are different.
Unlock Deck
Unlock for access to all 54 flashcards in this deck.
Unlock Deck
k this deck
51
When predicting values using a regression line, why can't we use values outside the range of the original x-variable?
Unlock Deck
Unlock for access to all 54 flashcards in this deck.
Unlock Deck
k this deck
52
Correlation is not the same as causation. Why not?
Unlock Deck
Unlock for access to all 54 flashcards in this deck.
Unlock Deck
k this deck
53
How are the coefficient of determination and correlation similar? How are they different?
Unlock Deck
Unlock for access to all 54 flashcards in this deck.
Unlock Deck
k this deck
54
You run a used car dealership and want to know if you are appropriately compensating your sales force, so you collect weekly compensation rates and counts of monthly sales with the intent of comparing them.1)What is the research question?
2)What are the hypotheses?
3)What are the degrees of freedom for the statistical significance test?
4)What is the critical value for this test?
5)State the formal results of the test.
6)Should you compute a coefficient of determination? How do you know? If so, calculate it.
7)Regress sales on compensation, and report the formula for the regression line here.
8)State all appropriate conclusions.
9)If a salesperson was compensated 450, what would we expect sales to be?
Unlock Deck
Unlock for access to all 54 flashcards in this deck.
Unlock Deck
k this deck
Unlock Deck
Unlock for access to all 54 flashcards in this deck.


