Deck 5: Recession, Forecasting, and Economic Policy
Full screen (f)
Question
Question
Question
Question
Question
Question
Question
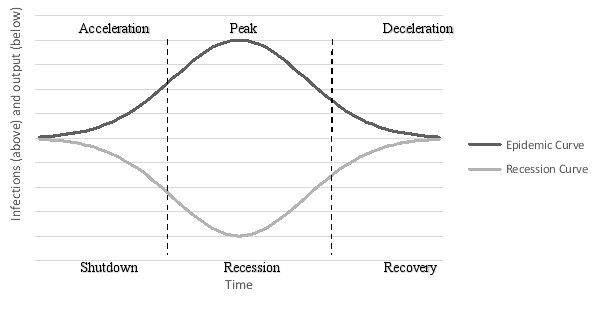
A link exists between the epidemic curve and the recession curve. In the absence of policy intervention, flattening the epidemic curve steepens the recession curve. In a two-graph model, draw this scenario. For a relationship between the two curves, what assumptions are necessary? Should a country use automatic stabilizers to address the recessionary problem?
Question
Question
Question

Unlock Deck
Sign up to unlock the cards in this deck!
Unlock Deck
Unlock Deck
1/10
Play
Full screen (f)
Deck 5: Recession, Forecasting, and Economic Policy
1
Using the circular-flow model, explain what happens to household income in the recessionary interval when the production of output declines.
The loops in the circular-flow model provide a framework to address the sequence of events that begin with economic shutdown and continue with recession. The shutdown interval first sends workers home to shelter-in-place, which reduces the factors of production flowing from households to businesses. This intervention decreases the production of output by businesses. At the same time, when the production of output declines and sales decrease, the level of revenue flowing to businesses decreases. This effect leads to a decrease in both household income and spending.
2
For the most recent business cycle in an economy, identify the last expansion, peak, recession, and trough. How long was the pandemic recession? Compared to previous recessions, how severe was it?
Empirical answer requiring data collection.
3
During a pandemic, what factors might shift the aggregate-supply curve to the left? What factors might shift the aggregate-demand curve to the left?
During a societal crisis, there is a strong probability that supply and demand curves will shift, to a comparatively greater degree (particularly during a pandemic), within a given economy. In the case of a pervasive, global pandemic, there are numerous contributing factors to aggregate-supply and aggregate-demand curve movements. Supply curves shift leftward when both workers and production materials are in relatively shorter supply. When a pandemic involves airborne particulate pathogens, there must necessarily be greater space and/or physical distance between workers from a preventative care standpoint, so fewer workers should be in the same space. Diminished numbers of workers in said space are going to produce fewer goods, which ultimately leads to a leftward-shifting supply curve. Then, as the materials needed to produce other relevant goods (intermediate goods) are cranked out at relatively slower rates, the final products are limited in manufactured scale. Think about the factories that make the elastic bands for N95 masks - they must cut their workforce to combat the spread of the virus, so they make fewer bands. Accordingly, the next factory, which assembles the masks, must then wait longer for the materials, so fewer masks are made, and so on. On the demand side, one particularly salient example involves the service industry, especially as the weather gets colder and colder. Fewer and fewer restaurants and bars are in a position to operate at full capacity, already having been hindered by shelter-in-place and quarantine regulations. As consumers are both subject to government regulations, and disinclined to increase their own risk of catching the virus, they consume less, such that the demand for service industry goods plummets. In turn, this shifts the overall demand curve to the left.
4
Using the AS-AD framework, trace the short-run and long-run effects of a pandemic on output and the price level.
Unlock Deck
Unlock for access to all 10 flashcards in this deck.
Unlock Deck
k this deck
5
In an AS-AD framework, under what short-run conditions will a pandemic create a greater impact on the demand side than on the supply side? For specific countries, was the decrease in AD greater than the decrease in SRAS? If so, why?
Unlock Deck
Unlock for access to all 10 flashcards in this deck.
Unlock Deck
k this deck
6
Does a pandemic shift LRAS? If so, what factors create this outcome?
Unlock Deck
Unlock for access to all 10 flashcards in this deck.
Unlock Deck
k this deck
7
A link exists between the epidemic curve and the recession curve. In the absence of policy intervention, flattening the epidemic curve steepens the recession curve. In a two-graph model, draw this scenario. For a relationship between the two curves, what assumptions are necessary? Should a country use automatic stabilizers to address the recessionary problem?
Unlock Deck
Unlock for access to all 10 flashcards in this deck.
Unlock Deck
k this deck
8
Suppose an economic recovery after a pandemic leaves aggregate demand short of its pre-pandemic level. What types of fiscal and monetary policies would boost aggregate demand? After the pandemic ends, how long should the policies continue? Will crowding out occur? Will a tradeoff between output and inflation occur?
Unlock Deck
Unlock for access to all 10 flashcards in this deck.
Unlock Deck
k this deck
9
For the year 2020, gather unemployment data. For individual countries, graph the month-by-month unemployment rates. Which countries had the highest unemployment rates? Which countries experienced higher unemployment rates for the longest periods of time? What factors account for these trends?
Unlock Deck
Unlock for access to all 10 flashcards in this deck.
Unlock Deck
k this deck
10
How does a pandemic alter the process of forecasting?
Unlock Deck
Unlock for access to all 10 flashcards in this deck.
Unlock Deck
k this deck
Unlock Deck
Unlock for access to all 10 flashcards in this deck.


