Deck 7: Inferences About the Difference Between Two Means
Full screen (f)
Question
Interpret the following SPSS output in terms of the extent to which the assumption of normality has been met. Include appropriate evidence (e.g., statistical values from the output).
Question
Question
Review the following SPSS output. Interpret the output including identifying the specific statistical procedure that has been used and reporting the extent to which the test is statistically significant. Include appropriate evidence (e.g., test statistic value, degrees of freedom, and p value).
Question
Calculate and interpret Cohen's d using the following output.

Question
Question
Question

Unlock Deck
Sign up to unlock the cards in this deck!
Unlock Deck
Unlock Deck
1/7
Play
Full screen (f)
Deck 7: Inferences About the Difference Between Two Means
1
Interpret the following SPSS output in terms of the extent to which the assumption of normality has been met. Include appropriate evidence (e.g., statistical values from the output).
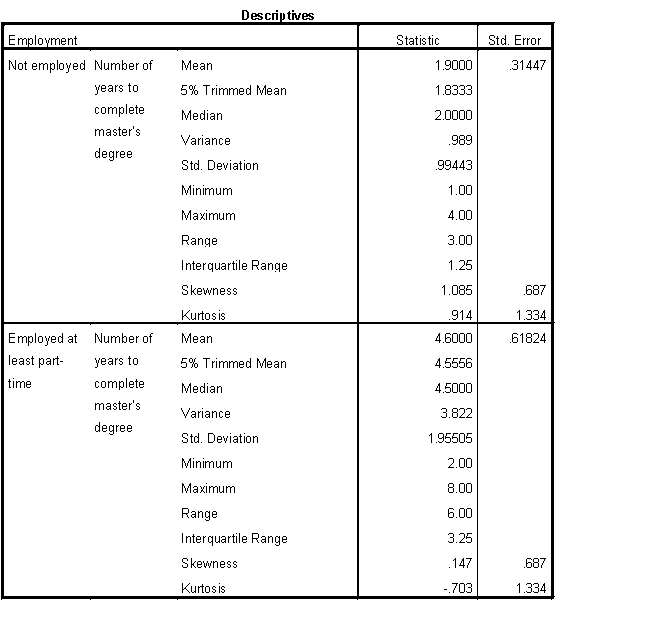
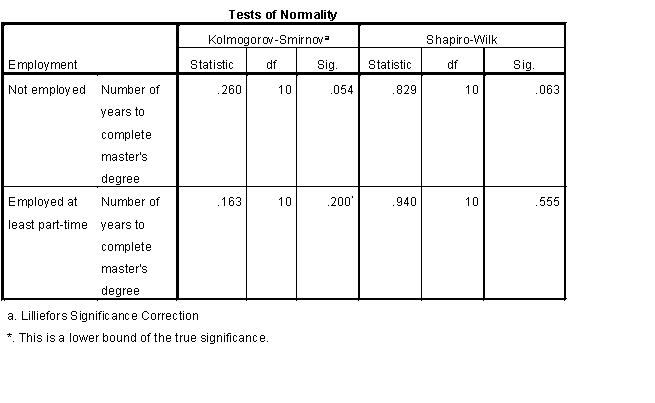
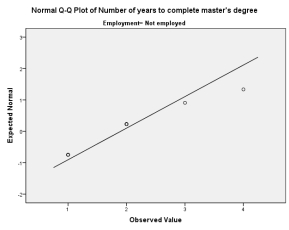
Review of the Shapiro-Wilk test for normality (SW = .829, df = 10, p = .063) and skewness (1.085) and kurtosis (.914) statistics suggest that normality of the number of years to complete a master's for not employed was reasonable. The Q-Q plot suggested minor non-normality.
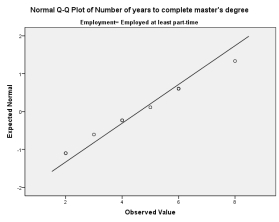
Review of the Shapiro-Wilk test for normality (SW = .940, df = 10, p = .555) and skewness (.147) and kurtosis (.703) statistics suggest that normality of the number of years to complete a master's for not employed was reasonable. The Q-Q plot suggested normality was generally reasonable.
Review of the Shapiro-Wilk test for normality (SW = .940, df = 10, p = .555) and skewness (.147) and kurtosis (.703) statistics suggest that normality of the number of years to complete a master's for not employed was reasonable. The Q-Q plot suggested normality was generally reasonable.
2
Review the following SPSS output. Interpret the output including identifying the specific statistical procedure that has been used and reporting the extent to which the test is statistically significant. Include appropriate evidence (e.g., values from the output).
An independent t test was conducted. The test is statistically significant, t = ?3.893, df = 18, p = .001.
3
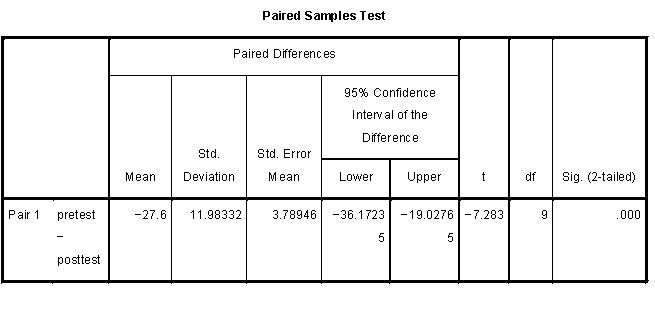
Review the following SPSS output. Interpret the output including identifying the specific statistical procedure that has been used and reporting the extent to which the test is statistically significant. Include appropriate evidence (e.g., test statistic value, degrees of freedom, and p value).
A dependent t test (i.e., paired samples test) was conducted. The test is statistically significant, t = -7.283, df = 9, p = .000.
4
Calculate and interpret Cohen's d using the following output.
Unlock Deck
Unlock for access to all 7 flashcards in this deck.
Unlock Deck
k this deck
5
A researcher randomly assigns individuals to two groups, one in which calming instrumental music is played softly and another in which no music is played. The researcher collects time on task, measured in minutes. The research question is: Is there a greater average time on task for individuals who had music as compared to individuals who did not have music? Which one of the following represents how the NULL hypothesis will be written?
A) Time on task differs on average for individuals with music as compared to without music.
B) The average time on task for individuals with music is the same as the average time on task for individuals without music.
C) The average time on task for individuals with music is less than or equal to the average time on task for individuals without music
D) The average time on task for individuals with music is greater than or equal to the average time on task for individuals without music
Unlock Deck
Unlock for access to all 7 flashcards in this deck.
Unlock Deck
k this deck
6
A researcher randomly assigns individuals to two groups, one in which calming instrumental music is played softly and another in which no music is played. The researcher collects time on task, measured in minutes. The research question is: Is there a greater average time on task for individuals who had music as compared to individuals who did not have music? Which one of the following represents how the ALTERNATIVE hypothesis will be written?
A) Time on task differs on average for individuals with music as compared to without music.
B) The average time on task for individuals with music is the same as the average time on task for individuals without music.
C) The average time on task for individuals with music is less than the average time on task for individuals without music
D) The average time on task for individuals with music is greater than the average time on task for individuals without music
Unlock Deck
Unlock for access to all 7 flashcards in this deck.
Unlock Deck
k this deck
7
A research article reports the following for an independent t test: = .05, t (6) = −4.40, p .005, d = −3.11. Which of the following reflects the interpretation for the hypothesis test?
A) Fail to reject the null hypothesis
B) Reject the null hypothesis
C) There is a small effect
D) There is a large effect
A) Fail to reject the null hypothesis
B) Reject the null hypothesis
C) There is a small effect
D) There is a large effect
Unlock Deck
Unlock for access to all 7 flashcards in this deck.
Unlock Deck
k this deck
Unlock Deck
Unlock for access to all 7 flashcards in this deck.


