Deck 16: Hierarchical and Randomized Block Analysis of Variance Models
Full screen (f)
Question
Question
Question
Question
Question
Question
Questions are based on the following figure.
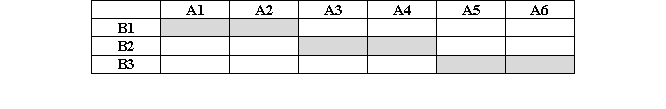
Each cell represents one combination of factor levels. The actual experiment assigns participants only to the combinations represented by the shaded cells. It is unknown whether the levels of the factors are fixed or randomly selected.
-Which of the following best describes the design of the experiment?
A) AB
B) BA
C) A(B)
D) B(A)
Question
Questions are based on the following figure.
Each cell represents one combination of factor levels. The actual experiment assigns participants only to the combinations represented by the shaded cells. It is unknown whether the levels of the factors are fixed or randomly selected.
-A is a random-effects factor and B is a fixed-effects factor. Each cell has 5 observations. The FB ratio has degrees of freedom equal to what?
A) 2, 3
B) 2, 10
C) 2, 24
D) 3, 72
Question
Questions are based on the following figure.
Each cell represents one combination of factor levels. The actual experiment assigns participants only to the combinations represented by the shaded cells. It is unknown whether the levels of the factors are fixed or randomly selected.
-Both A and B are fixed-effects factors. Each cell has 5 observations. The FB ratio has degrees of freedom equal to?
A) 2, 3
B) 2, 10
C) 2, 24
D) 3, 72
Question
Questions are based on the following figure.
Each cell represents one combination of factor levels. The actual experiment assigns participants only to the combinations represented by the shaded cells. It is unknown whether the levels of the factors are fixed or randomly selected.
-Both A and B are random-effects factors. Each cell has 5 observations. The FB ratio has degrees of freedom equal to what?
A) 2, 3
B) 2, 10
C) 2, 24
D) 3, 72
Question
Question
Question

Unlock Deck
Sign up to unlock the cards in this deck!
Unlock Deck
Unlock Deck
1/12
Play
Full screen (f)
Deck 16: Hierarchical and Randomized Block Analysis of Variance Models
1
An experiment was conducted to compare the effects of four types of classroom layout on children's learning outcomes. Score on a pretest is used to form the blocks (low, middle, high). The mean scores on the dependent variable, children's score on a posttest quiz, are listed here for each cell.
Use these cell means to graph the interaction between type of classroom layout and pretest score block.
a. Is there an interaction between type of classroom layout and pretest score?
b. What kind of recommendation would you make to teachers?
Use these cell means to graph the interaction between type of classroom layout and pretest score block.
a. Is there an interaction between type of classroom layout and pretest score?
b. What kind of recommendation would you make to teachers?
The profile plot of cell means is shown as follows.
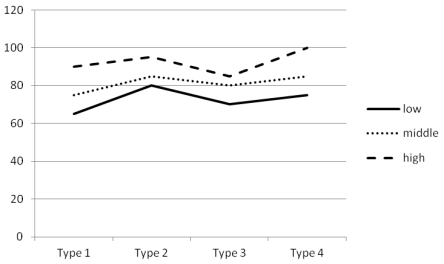
a. No, there does not appear to be an interaction between type of classroom layout and pretest score. The three lines (representing three levels on pretest) in the plot are almost parallel, indicating that the effects of classroom layout are similar for students with different achievement levels on the pretest.
b. Results suggest that the effects of classroom layout are generalizable across students with different levels of achievement on the pretest. Therefore, teachers should choose the type of classroom layout in which the students had the highest learning outcome. However, the plots also suggest that the effects of four types of classroom may not differ significantly from each other.
2
An experiment was conducted to compare the effect of three types of daily schedules on the employees' work performance. The schedules all contained the same amount of tasks, but the tasks were listed in different orders in each schedule. The day of the week was used as the blocking variable. The mean scores on the dependent variable, the percentage of tasks completed, are listed here for each cell.
Use these cell means to graph the interaction between type of schedule and the day of the week.
a. Is there an interaction between type of schedule and the day of the week?
b. What kind of recommendation would you make to the manager?
Use these cell means to graph the interaction between type of schedule and the day of the week.
a. Is there an interaction between type of schedule and the day of the week?
b. What kind of recommendation would you make to the manager?
The profile plot of cell means is shown as follows.
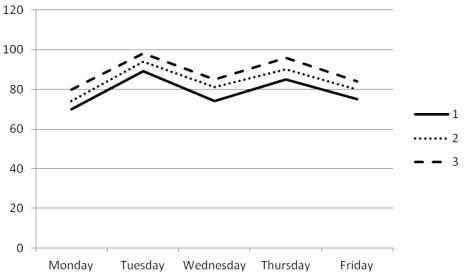
a. No, there does not appear to be an interaction between type of schedule and the day of the week. The three lines (representing three types of schedules) in the plot are almost parallel, indicating that the effects of type of schedule are similar for each weekday.
b. Results suggest that the effects of type of schedule are generalizable across all weekdays. Therefore, the manager should implement schedule type 3, which consistently yields the best work performance throughout the week.
3
A market researcher wanted to test three exotic flavors of cake (dragon fruit, root beer, and yam) on customers of different age groups (21-30, 31-40, 41-50, 51-60). Thus, age is a blocking variable. The dependent measure was the customer's rating on how much he/she liked the cake. There were six subjects in each cell. Complete the ANOVA summary table below, assuming a fixed-effects model where = .05.
There are 3 levels of the fixed factor A (flavors of cake), so J = 3. There are 4 levels of the fixed factor B (age), so K = 4. Each cell has 6 subjects, so n = 6. N = 6*3*4 = 72.
dfA = J -1 = 3 - 1 = 2, dfB = K - 1 = 4 -1 = 3, dfAB = (J - 1)(K - 1) = 2*3 = 6, dfwith = N - JK = 72 - 3*4 = 60, dftotal = N - 1 = 72 - 1 = 71.
SSB = MSB*dfB = 50*3 = 150; SSwith = MSwith*dfwith = 25*60 = 1500;
SSwith = SStotal - SSA ? SSB- SSwith = 2400 - 300 - 150 - 1500 = 450.
MSA = SSA/dfA = 300/2 = 150; MSAB = SSAB /dfAB = 450/6 = 75.
FA = MSA/MSwith = 150/25 = 6; critical value for A = .05F2,60 = 3.15 < FA, reject H0.
FB = MSB/MSwith = 50/25 = 2; critical value for B = .05F3,60 = 2.76 > FB, fail to reject H0.
FAB = MSAB/MSwith = 75/25 = 3; critical value for AB= .05F6,60 = 2.25 < FAB, reject H0.
4
Azita wants to evaluate the effects of three new types of word processors (1: MacrosoftWork; 2: ToogleDoc, 3: WordTerrific) on the employees' working efficiency. Twelve employees were randomly selected and grouped into four blocks based on the amount of their daily tasks (higher values indicate heavier work load). Within each block, each employee was randomly assigned to use one of the three word processors. Their working efficiency as measured by the number of files processed per day is listed in the table. Conduct a two-factor randomized block ANOVA ( = .05) and Bonferroni MCPs using SPSS to determine the results of the study.
Unlock Deck
Unlock for access to all 12 flashcards in this deck.
Unlock Deck
k this deck
5
Dr. Numerus wanted to examine two different methods to teach number theory. He randomly selected six instructors from the department and assigned three of them to use method 1 and three of them to use method 2. There were 20 students in each instructor's class. At the end of the semester, Dr. Numerus collected the test scores from all six classes and ran a two-factor hierarchical ANOVA. Below is the selected output generated by SPSS.
Test of Between-Subjects Effects
a. Identify factor A and factor B.
b. For each factor, identify whether it is a fixed-effects or random-effects factor.
c. Is the SPSS ANOVA summary table correct? If not, correct the erroneous part(s).
d. What conclusions can you draw from the correct test results? (Use = .05)
Unlock Deck
Unlock for access to all 12 flashcards in this deck.
Unlock Deck
k this deck
6
Questions are based on the following figure.
Each cell represents one combination of factor levels. The actual experiment assigns participants only to the combinations represented by the shaded cells. It is unknown whether the levels of the factors are fixed or randomly selected.
-Which of the following best describes the design of the experiment?
A) AB
B) BA
C) A(B)
D) B(A)
Unlock Deck
Unlock for access to all 12 flashcards in this deck.
Unlock Deck
k this deck
7
Questions are based on the following figure.
Each cell represents one combination of factor levels. The actual experiment assigns participants only to the combinations represented by the shaded cells. It is unknown whether the levels of the factors are fixed or randomly selected.
-A is a random-effects factor and B is a fixed-effects factor. Each cell has 5 observations. The FB ratio has degrees of freedom equal to what?
A) 2, 3
B) 2, 10
C) 2, 24
D) 3, 72
Unlock Deck
Unlock for access to all 12 flashcards in this deck.
Unlock Deck
k this deck
8
Questions are based on the following figure.
Each cell represents one combination of factor levels. The actual experiment assigns participants only to the combinations represented by the shaded cells. It is unknown whether the levels of the factors are fixed or randomly selected.
-Both A and B are fixed-effects factors. Each cell has 5 observations. The FB ratio has degrees of freedom equal to?
A) 2, 3
B) 2, 10
C) 2, 24
D) 3, 72
Unlock Deck
Unlock for access to all 12 flashcards in this deck.
Unlock Deck
k this deck
9
Questions are based on the following figure.
Each cell represents one combination of factor levels. The actual experiment assigns participants only to the combinations represented by the shaded cells. It is unknown whether the levels of the factors are fixed or randomly selected.
-Both A and B are random-effects factors. Each cell has 5 observations. The FB ratio has degrees of freedom equal to what?
A) 2, 3
B) 2, 10
C) 2, 24
D) 3, 72
Unlock Deck
Unlock for access to all 12 flashcards in this deck.
Unlock Deck
k this deck
10
In a two-factor randomized block ANOVA, the blocking factor is often considered a nuisance variable for which the researcher wants to control through the design of the study.
Unlock Deck
Unlock for access to all 12 flashcards in this deck.
Unlock Deck
k this deck
11
Randomized block designs are also known as which of the following? Select all that apply.
A) Adjusted ANCOVA
B) Matching designs
C) Mixed effect models
D) Treatment by block designs
A) Adjusted ANCOVA
B) Matching designs
C) Mixed effect models
D) Treatment by block designs
Unlock Deck
Unlock for access to all 12 flashcards in this deck.
Unlock Deck
k this deck
12
Which one of the following is the nonparametric equivalent to the two-factor randomized block ANOVA model?
A) Chi-square test of equivalence
B) Friedman
C) Kruskal-Wallis
D) Mann-Whitney
A) Chi-square test of equivalence
B) Friedman
C) Kruskal-Wallis
D) Mann-Whitney
Unlock Deck
Unlock for access to all 12 flashcards in this deck.
Unlock Deck
k this deck
Unlock Deck
Unlock for access to all 12 flashcards in this deck.


