Deck 6: Demand Management, Forecasting, and Aggregate Planning
Full screen (f)
Question
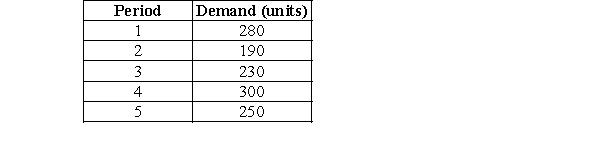
-Calculate the four-period moving average for Period 5.
A)190.0
B)300.0
C)250.0
D)242.5
E)280.0
Question
-Calculate the three-period weighted moving average for Period 5 using the weights, wt = 0.5, wt-1 = 0.2, wt-2 = 0.2 and wt-3 = 0.1
A)190.0
B)300.0
C)250.0
D)262.0
E)280.0
Question
-Calculate an exponential smoothing forecast for Period 5 using a smoothing constant of 0.6 and an initial forecast for period 4 of 275.
A)290.0
B)260.0
C)250.0
D)285.0
E)265.0
Question
-For Plutonium Courtyard Hotel in Wendover, Saturday is the best day of the week for business. The gambling take for the hotel on Saturdays over the past four weeks was as follows:
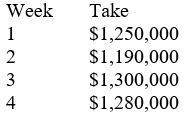 Using a moving average with n = 3 terms, what would be the forecast for Week 5?
A)$1,673,333.33
B)$1,255,000.00
C)$1,256,666.67
D)$1,246,666.67
E)$1,280,000.00
Question
-For Plutonium Courtyard Hotel in Wendover, Saturday is the best day of the week for business. The gambling take for the hotel on Saturdays over the past four weeks was as follows:
 Plutonium Courtyard uses a three-period weighted moving average to forecast demand, with wt = 0.6, wt-1 = 0.3, and wt-2 = 0.1. What is the forecast for Week 5?
A)$1,262,000.00
B)$1,277,000.00
C)$1,232,000.00
D)$1,237,000.00
E)$1,280,000.00
Question
-Zampa and Company sold 2,000 widgets yesterday. It had forecasted sales of 1,900 units. Using exponential smoothing with a smoothing constant of 0.5, what is the forecast for today's sales of widgets?
A)2,025
B)1,900
C)2,000
D)1,950
E)2,050
Question
-Willow Company had sales of $100,000 last week. The company had forecasted that sales would be $120,000. Using exponential smoothing with a smoothing constant of 0.3, what is the forecast for this week's sales?
A)$114,000
B)$94,000
C)$106,000
D)$86,000
E)$100,000
Question
-Over a six-month period, the demand for a product has been as follows: January = 200, February = 210, March = 240, April = 240, May = 260, and June = 280. The five-month moving average forecast for July is _______.
A)307.50
B)246.00
C)410.00
D)230.00
E)238.33
Question
A firm's demand data from the last two quarters is displayed in the table.
-What is the three-period moving average for January's demand?
A)206.33
B)172.00
C)246.00
D)180.67
E)217.00
-What is the three-period moving average for January's demand?
A)206.33
B)172.00
C)246.00
D)180.67
E)217.00
Question
A firm's demand data from the last two quarters is displayed in the table.
-Use a three-period weighted moving average with wt = 0.7, wt-1 = 0.2, and wt-2 = 0.1 to forecast demand for January.
A)183.60
B)194.80
C)214.90
D)235.20
E)246.00
-Use a three-period weighted moving average with wt = 0.7, wt-1 = 0.2, and wt-2 = 0.1 to forecast demand for January.
A)183.60
B)194.80
C)214.90
D)235.20
E)246.00
Question
A firm's demand data from the last two quarters is displayed in the table.
-If last period's forecast was 27, and the actual demand was 30, what was the forecast error?
A)+3.00
B)+2.00
C)+1.00
D)-2.00
E)-3.00
-If last period's forecast was 27, and the actual demand was 30, what was the forecast error?
A)+3.00
B)+2.00
C)+1.00
D)-2.00
E)-3.00
Question
A company has the information shown in the chart below regarding its forecast performance in the past three periods.
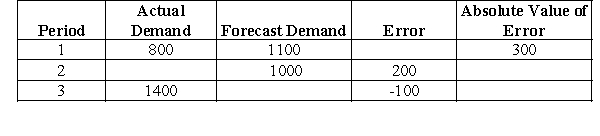
-Calculate the mean absolute deviation (MAD).
A)-66.67
B)225.00
C)200.00
D)1,200.00
E)Need more information to answer the question
-Calculate the mean absolute deviation (MAD).
A)-66.67
B)225.00
C)200.00
D)1,200.00
E)Need more information to answer the question
Question
A company has the information shown in the chart below regarding its forecast performance in the past three periods.
-Calculate the running sum of forecast error (RSFE) that provides a measure of forecast bias.
A)-66.67
B)-200.00
C)-300.00
D)400.00
E)Need more information to answer the question
-Calculate the running sum of forecast error (RSFE) that provides a measure of forecast bias.
A)-66.67
B)-200.00
C)-300.00
D)400.00
E)Need more information to answer the question
Question
A company has the data shown in the chart below concerning its forecast performance over the past five time periods.
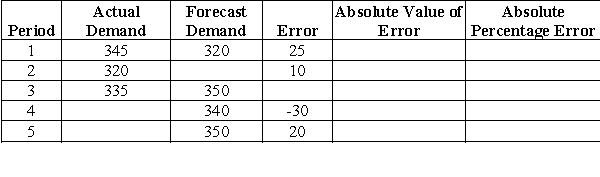
-Calculate the forecast demand for Period 2.
A)310
B)320
C)330
D)340
E)350
-Calculate the forecast demand for Period 2.
A)310
B)320
C)330
D)340
E)350
Question
A company has the data shown in the chart below concerning its forecast performance over the past five time periods.
-Calculate the actual demand for Period 5.
A)330
B)350
C)370
D)390
E)310
-Calculate the actual demand for Period 5.
A)330
B)350
C)370
D)390
E)310
Question
A company has the data shown in the chart below concerning its forecast performance over the past five time periods.
-Calculate the forecast error for Period 3.
A)0
B)-15
C)15
D)5
E)Need more information to answer the question
-Calculate the forecast error for Period 3.
A)0
B)-15
C)15
D)5
E)Need more information to answer the question
Question
A company has the data shown in the chart below concerning its forecast performance over the past five time periods.
-Calculate the absolute percentage error for Period 1.
A)5.4054%
B)9.6774%
C)4.4776%
D)3.125%
E)7.2464%
-Calculate the absolute percentage error for Period 1.
A)5.4054%
B)9.6774%
C)4.4776%
D)3.125%
E)7.2464%
Question
A company has the data shown in the chart below concerning its forecast performance over the past five time periods.
-Calculate the running sum of forecast error (RSFE).
A)0
B)10
C)-10
D)2.00
E)-2.00
-Calculate the running sum of forecast error (RSFE).
A)0
B)10
C)-10
D)2.00
E)-2.00
Question
A company has the data shown in the chart below concerning its forecast performance over the past five time periods.
-In examining the data above, the manager exclaimed that she was very happy to see no bias in the forecasts. How would you respond to the manager?
A)The manager is correct.
B)I beg to differ, but there is a slight negative bias.
C)I beg to differ, but there appears to be slight positive bias.
D)There is no way one can estimate bias looking at the data.
E)Need more information to answer the question
Question
A company has the data shown in the chart below concerning its forecast performance over the past five time periods.
-Calculate the mean absolute deviation (MAD).
A)0.00
B)10.00
C)20.00
D)100.00
E)Need more information to answer the question
-Calculate the mean absolute deviation (MAD).
A)0.00
B)10.00
C)20.00
D)100.00
E)Need more information to answer the question
Question
A company has the data shown in the chart below concerning its forecast performance over the past five time periods.
-Calculate the mean absolute percentage error (MAPE).
A)5.41%
B)9.68%
C)4.48%
D)5.99%
E)Need more information to answer the question
-Calculate the mean absolute percentage error (MAPE).
A)5.41%
B)9.68%
C)4.48%
D)5.99%
E)Need more information to answer the question
Question
A company has the data shown in the chart below concerning its forecast performance over the past five time periods.
-Calculate the tracking signal for Period 1 (TS = RSFE / MAD)
A)0.00
B)+1.00
C)-1.00
D)+2.00
E)Need more information to answer the question
-Calculate the tracking signal for Period 1 (TS = RSFE / MAD)
A)0.00
B)+1.00
C)-1.00
D)+2.00
E)Need more information to answer the question
Question
A company has the data shown in the chart below concerning its forecast performance over the past five time periods.
-Calculate the tracking signal for Period 4 (TS = RSFE / MAD).
A)+2.00
B)+1.00
C)-1.00
D)-0.50
E)+0.50
-Calculate the tracking signal for Period 4 (TS = RSFE / MAD).
A)+2.00
B)+1.00
C)-1.00
D)-0.50
E)+0.50
Question
Given the series of demand data below
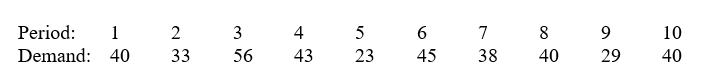
-What is the two-period moving-average forecast for Week 9?
A)41.5
B)39.0.
C)34.5.
D)39.0
E)34.0
-What is the two-period moving-average forecast for Week 9?
A)41.5
B)39.0.
C)34.5.
D)39.0
E)34.0
Question
Given the series of demand data below
-What is the four-period moving-average forecast for Week 11?
A)41.8
B)36.8
C)37.3
D)36.5
E)38.0
-What is the four-period moving-average forecast for Week 11?
A)41.8
B)36.8
C)37.3
D)36.5
E)38.0
Question
Given the series of demand data below
-What is the six-period moving-average forecast for Week 10?
A)39.7
B)35.8
C)40.8
D)40.0
E)36.3
-What is the six-period moving-average forecast for Week 10?
A)39.7
B)35.8
C)40.8
D)40.0
E)36.3
Question
Given the series of demand data below
-Calculate the running sum of forecast error (RSFE) for n = 2 (two-period moving average) between Weeks 7 and 10.
A)0.00
B)-0.50
C)-2.00
D)+2.00
E)+0.50
-Calculate the running sum of forecast error (RSFE) for n = 2 (two-period moving average) between Weeks 7 and 10.
A)0.00
B)-0.50
C)-2.00
D)+2.00
E)+0.50
Question
Given the series of demand data below
-Calculate the running sum of forecast error (RSFE) for n = 4 (four-period moving average) between Weeks 7 and 10.
A)-6.50
B)-1.65
C)+1.65
D)+6.50
E)0.00
-Calculate the running sum of forecast error (RSFE) for n = 4 (four-period moving average) between Weeks 7 and 10.
A)-6.50
B)-1.65
C)+1.65
D)+6.50
E)0.00
Question
Given the series of demand data below
-Calculate the running sum of forecast error (RSFE) for n = 6 (six-period moving average) between Weeks 7 and 10.
A)+9.80
B)+2.45
C)0.00
D)-2.45
E)-9.80
-Calculate the running sum of forecast error (RSFE) for n = 6 (six-period moving average) between Weeks 7 and 10.
A)+9.80
B)+2.45
C)0.00
D)-2.45
E)-9.80
Question
Given the series of demand data below
-Calculate the mean absolute deviation (MAD) for n = 2 (two-period moving average) between Weeks 7 and 10.
A)0.00
B)+5.25
C)-5.25
D)+21.00
E)-21.00
-Calculate the mean absolute deviation (MAD) for n = 2 (two-period moving average) between Weeks 7 and 10.
A)0.00
B)+5.25
C)-5.25
D)+21.00
E)-21.00
Question
Given the series of demand data below
-Calculate the mean absolute deviation (MAD) for n = 4 (four-period moving average) between Weeks 7 and 10.
A)3.80
B)7.50
C)4.00
D)16.00
E)2.00
-Calculate the mean absolute deviation (MAD) for n = 4 (four-period moving average) between Weeks 7 and 10.
A)3.80
B)7.50
C)4.00
D)16.00
E)2.00
Question
Given the series of demand data below
-Calculate the mean absolute deviation (MAD) for n = 6 (six-period moving average) between Weeks 7 and 10.
A)17.80
B)11.80
C)3.70
D)2.00
E)4.46
-Calculate the mean absolute deviation (MAD) for n = 6 (six-period moving average) between Weeks 7 and 10.
A)17.80
B)11.80
C)3.70
D)2.00
E)4.46
Question
A well-educated lumberjack decides to use linear regression to predict the demand for firewood based on the ambient temperature. He has collected data on firewood sales and temperature for the last several days and has performed some preliminary calculations as shown in the table.
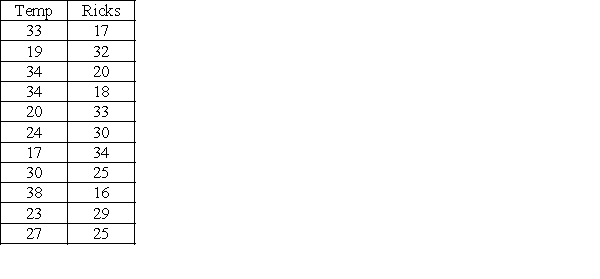
-What is his regression equation based on the data?
A)Ricks = 50.6 - 0.93 x Temp
B)Temp = 53.3 - 1.0 x Ricks
C)Ricks = 0.93 - 50.6 x Temp
D)Temp = 1.0 - 53.3 x Ricks
E)Need more information to answer the question
-What is his regression equation based on the data?
A)Ricks = 50.6 - 0.93 x Temp
B)Temp = 53.3 - 1.0 x Ricks
C)Ricks = 0.93 - 50.6 x Temp
D)Temp = 1.0 - 53.3 x Ricks
E)Need more information to answer the question
Question
A well-educated lumberjack decides to use linear regression to predict the demand for firewood based on the ambient temperature. He has collected data on firewood sales and temperature for the last several days and has performed some preliminary calculations as shown in the table.
-Determine the regression equation based on the data. What is the y-axis intercept?
A)1.0
B)0.93
C)53.3
D)50.6
E)Need more information to answer the question
-Determine the regression equation based on the data. What is the y-axis intercept?
A)1.0
B)0.93
C)53.3
D)50.6
E)Need more information to answer the question
Question
A well-educated lumberjack decides to use linear regression to predict the demand for firewood based on the ambient temperature. He has collected data on firewood sales and temperature for the last several days and has performed some preliminary calculations as shown in the table.
-Determine the regression equation based on the data. What is the slope of the regression equation?
A)1.0
B)-0.93
C)-53.3
D)-50.6
E)Need more information to answer the question
-Determine the regression equation based on the data. What is the slope of the regression equation?
A)1.0
B)-0.93
C)-53.3
D)-50.6
E)Need more information to answer the question
Question
A well-educated lumberjack decides to use linear regression to predict the demand for firewood based on the ambient temperature. He has collected data on firewood sales and temperature for the last several days and has performed some preliminary calculations as shown in the table.
-Determine the regression equation based on the data. What is the sample correlation coefficient (R) for the regression equation?
A)0.976
B)0.952
C)0.946
D)-0.976
E)-0.952
-Determine the regression equation based on the data. What is the sample correlation coefficient (R) for the regression equation?
A)0.976
B)0.952
C)0.946
D)-0.976
E)-0.952
Question
A well-educated lumberjack decides to use linear regression to predict the demand for firewood based on the ambient temperature. He has collected data on firewood sales and temperature for the last several days and has performed some preliminary calculations as shown in the table.
-Determine the regression equation based on the data. What is the sample coefficient of determination (R-square) for the regression equation?
A)0.976
B)0.952
C)0.946
D)-0.976
E)-0.952
-Determine the regression equation based on the data. What is the sample coefficient of determination (R-square) for the regression equation?
A)0.976
B)0.952
C)0.946
D)-0.976
E)-0.952
Question
A well-educated lumberjack decides to use linear regression to predict the demand for firewood based on the ambient temperature. He has collected data on firewood sales and temperature for the last several days and has performed some preliminary calculations as shown in the table.
-Sampson and Delilah advertising company is interested in an appropriate mix of print, radio, and television ads for their new client. Steven Nash performs a multiple regression on the effects of dollars spent on each type of media on dollars of sales of product. Nash uses data from the most recent advertising campaigns and develops the following equation:
Y = 254,215 + 6.79 * Print - 1.4 * Radio + 16.87 *Television
The r-squared statistic is 0.77. Which of the following statements is BEST?
A)At a minimum, the client will sell $254,215 worth of product after the new advertising campaign.
B)At a maximum, the client will sell $254,215 worth of product after the new advertising campaign.
C)This equation will be of no use in predicting the amount of sales based on advertising in these media.
D)The client should spend more money on television advertising than on radio advertising.
E)Need more information to answer the question
Question
A well-educated lumberjack decides to use linear regression to predict the demand for firewood based on the ambient temperature. He has collected data on firewood sales and temperature for the last several days and has performed some preliminary calculations as shown in the table.
-Marilyn runs a multiple regression for the output of cheese curds by using the daily temperature and the consumption of sweet clover. The intercept term is 23, the slope coefficient for the daily temperature is 1.5, and the slope coefficient for the consumption of sweet clover is 0. Which of these conclusions is most appropriate?
A)Marilyn should collect more data.
B)The most important term in Marilyn's model is the intercept.
C)As the daily temperature rises, the intercept term probably decreases.
D)Marilyn should drop the sweet-clover term from her model.
E)Need more information to answer the question
Question
Humboldt Corporation is preparing an aggregate production plan for fasteners for the next four quarters. The company's expected quarterly demand is given in the following table. The company will have 1,000 fasteners in inventory at the beginning of the year and wishes to maintain at least that number at the end of each quarter. Following is other critical data:
Production cost per unit = $250
Inventory carrying cost per quarter per unit = $10 (based on quarter-ending inventory)
Hiring cost per worker = $1,000
Firing cost per worker = $2,000
Beginning number of workers = 10
Each worker can produce 100 units per quarter.
Any worker on the staff at the end of the year will not be fired at that time.

-If Humboldt prefers a level plan, what will be the regular production rate per quarter?
A)5,000 units
B)4,000 units
C)6,000 units
D)Regular production will vary each month.
E)Need more information to answer the question
Production cost per unit = $250
Inventory carrying cost per quarter per unit = $10 (based on quarter-ending inventory)
Hiring cost per worker = $1,000
Firing cost per worker = $2,000
Beginning number of workers = 10
Each worker can produce 100 units per quarter.
Any worker on the staff at the end of the year will not be fired at that time.
-If Humboldt prefers a level plan, what will be the regular production rate per quarter?
A)5,000 units
B)4,000 units
C)6,000 units
D)Regular production will vary each month.
E)Need more information to answer the question
Question
Humboldt Corporation is preparing an aggregate production plan for fasteners for the next four quarters. The company's expected quarterly demand is given in the following table. The company will have 1,000 fasteners in inventory at the beginning of the year and wishes to maintain at least that number at the end of each quarter. Following is other critical data:
Production cost per unit = $250
Inventory carrying cost per quarter per unit = $10 (based on quarter-ending inventory)
Hiring cost per worker = $1,000
Firing cost per worker = $2,000
Beginning number of workers = 10
Each worker can produce 100 units per quarter.
Any worker on the staff at the end of the year will not be fired at that time.
-Given the above information, what is the inventory carrying cost of a level plan?
A)$100,000
B)$700,000
C)$70,000
D)$7,000
E)Need more information to answer the question
Question
Humboldt Corporation is preparing an aggregate production plan for fasteners for the next four quarters. The company's expected quarterly demand is given in the following table. The company will have 1,000 fasteners in inventory at the beginning of the year and wishes to maintain at least that number at the end of each quarter. Following is other critical data:
Production cost per unit = $250
Inventory carrying cost per quarter per unit = $10 (based on quarter-ending inventory)
Hiring cost per worker = $1,000
Firing cost per worker = $2,000
Beginning number of workers = 10
Each worker can produce 100 units per quarter.
Any worker on the staff at the end of the year will not be fired at that time.
-Given the above information, what is the total cost of a level plan?
A)$5,740,000
B)$5,110,000
C)$5,140,000
D)$5,000,000
E)Need more information to answer the question
Question
Vodafone Corporation is preparing an aggregate production plan for its product for the next four months. The firm's expected monthly demand is given in the following table. The firm will have 100 units in inventory at the beginning of the month and wishes to maintain at least 100 units at the end of each month. The following is other critical data:
Production cost per unit = $125
Inventory carrying cost per quarter per unit = $10 (based on quarter-ending inventory)
Hiring cost per associate = $50
Firing cost per associate = $100
Beginning number of associates = 25
Each associate can produce 25 units per month.
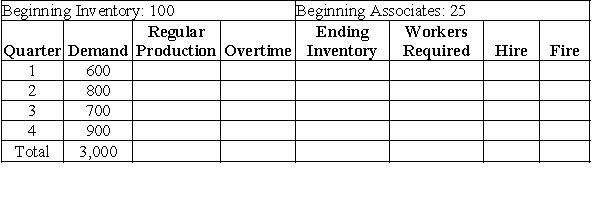
-Given the above information, what is the total inventory carrying cost of a chase plan?
A)$6,000
B)$4,000
C)$5,000
D)$4,500
E)Need more information to answer the question
Production cost per unit = $125
Inventory carrying cost per quarter per unit = $10 (based on quarter-ending inventory)
Hiring cost per associate = $50
Firing cost per associate = $100
Beginning number of associates = 25
Each associate can produce 25 units per month.
-Given the above information, what is the total inventory carrying cost of a chase plan?
A)$6,000
B)$4,000
C)$5,000
D)$4,500
E)Need more information to answer the question
Question
Vodafone Corporation is preparing an aggregate production plan for its product for the next four months. The firm's expected monthly demand is given in the following table. The firm will have 100 units in inventory at the beginning of the month and wishes to maintain at least 100 units at the end of each month. The following is other critical data:
Production cost per unit = $125
Inventory carrying cost per quarter per unit = $10 (based on quarter-ending inventory)
Hiring cost per associate = $50
Firing cost per associate = $100
Beginning number of associates = 25
Each associate can produce 25 units per month.
-Given the above information, what is the total cost of a chase plan (using hiring and firing)?
A)$379,800
B)$379,000
C)$381,100
D)$380,300
E)Need more information to answer the question
Question
Vodafone Corporation is preparing an aggregate production plan for its product for the next four months. The firm's expected monthly demand is given in the following table. The firm will have 100 units in inventory at the beginning of the month and wishes to maintain at least 100 units at the end of each month. The following is other critical data:
Production cost per unit = $125
Inventory carrying cost per quarter per unit = $10 (based on quarter-ending inventory)
Hiring cost per associate = $50
Firing cost per associate = $100
Beginning number of associates = 25
Each associate can produce 25 units per month.
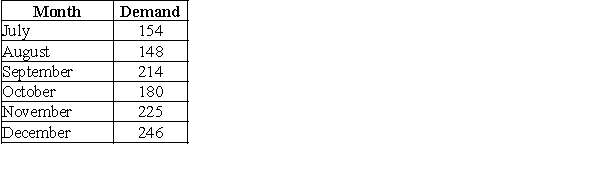
-A lamp manufacturer enters a six-month planning a period with forecasts as indicated in the table. To make things as stable as possible, the sales and operations planner decides to use a level plan throughout the period. The starting inventory is 240 units, and the planner would like to end this period with no inventory. How much should they produce in September?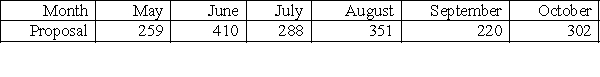
A)302 units
B)305 units
C)265 units
D)351 units
E)Need more information to answer the question
Production cost per unit = $125
Inventory carrying cost per quarter per unit = $10 (based on quarter-ending inventory)
Hiring cost per associate = $50
Firing cost per associate = $100
Beginning number of associates = 25
Each associate can produce 25 units per month.
-A lamp manufacturer enters a six-month planning a period with forecasts as indicated in the table. To make things as stable as possible, the sales and operations planner decides to use a level plan throughout the period. The starting inventory is 240 units, and the planner would like to end this period with no inventory. How much should they produce in September?
A)302 units
B)305 units
C)265 units
D)351 units
E)Need more information to answer the question

Unlock Deck
Sign up to unlock the cards in this deck!
Unlock Deck
Unlock Deck
1/45
Play
Full screen (f)
Deck 6: Demand Management, Forecasting, and Aggregate Planning
1
-Calculate the four-period moving average for Period 5.
A)190.0
B)300.0
C)250.0
D)242.5
E)280.0
250.0
2
-Calculate the three-period weighted moving average for Period 5 using the weights, wt = 0.5, wt-1 = 0.2, wt-2 = 0.2 and wt-3 = 0.1
A)190.0
B)300.0
C)250.0
D)262.0
E)280.0
262.0
3
-Calculate an exponential smoothing forecast for Period 5 using a smoothing constant of 0.6 and an initial forecast for period 4 of 275.
A)290.0
B)260.0
C)250.0
D)285.0
E)265.0
290.0
4
-For Plutonium Courtyard Hotel in Wendover, Saturday is the best day of the week for business. The gambling take for the hotel on Saturdays over the past four weeks was as follows:
Using a moving average with n = 3 terms, what would be the forecast for Week 5?A)$1,673,333.33
B)$1,255,000.00
C)$1,256,666.67
D)$1,246,666.67
E)$1,280,000.00
Unlock Deck
Unlock for access to all 45 flashcards in this deck.
Unlock Deck
k this deck
5
-For Plutonium Courtyard Hotel in Wendover, Saturday is the best day of the week for business. The gambling take for the hotel on Saturdays over the past four weeks was as follows:
Plutonium Courtyard uses a three-period weighted moving average to forecast demand, with wt = 0.6, wt-1 = 0.3, and wt-2 = 0.1. What is the forecast for Week 5?A)$1,262,000.00
B)$1,277,000.00
C)$1,232,000.00
D)$1,237,000.00
E)$1,280,000.00
Unlock Deck
Unlock for access to all 45 flashcards in this deck.
Unlock Deck
k this deck
6
-Zampa and Company sold 2,000 widgets yesterday. It had forecasted sales of 1,900 units. Using exponential smoothing with a smoothing constant of 0.5, what is the forecast for today's sales of widgets?
A)2,025
B)1,900
C)2,000
D)1,950
E)2,050
Unlock Deck
Unlock for access to all 45 flashcards in this deck.
Unlock Deck
k this deck
7
-Willow Company had sales of $100,000 last week. The company had forecasted that sales would be $120,000. Using exponential smoothing with a smoothing constant of 0.3, what is the forecast for this week's sales?
A)$114,000
B)$94,000
C)$106,000
D)$86,000
E)$100,000
Unlock Deck
Unlock for access to all 45 flashcards in this deck.
Unlock Deck
k this deck
8
-Over a six-month period, the demand for a product has been as follows: January = 200, February = 210, March = 240, April = 240, May = 260, and June = 280. The five-month moving average forecast for July is _______.
A)307.50
B)246.00
C)410.00
D)230.00
E)238.33
Unlock Deck
Unlock for access to all 45 flashcards in this deck.
Unlock Deck
k this deck
9
A firm's demand data from the last two quarters is displayed in the table.
-What is the three-period moving average for January's demand?
A)206.33
B)172.00
C)246.00
D)180.67
E)217.00
-What is the three-period moving average for January's demand?
A)206.33
B)172.00
C)246.00
D)180.67
E)217.00
Unlock Deck
Unlock for access to all 45 flashcards in this deck.
Unlock Deck
k this deck
10
A firm's demand data from the last two quarters is displayed in the table.
-Use a three-period weighted moving average with wt = 0.7, wt-1 = 0.2, and wt-2 = 0.1 to forecast demand for January.
A)183.60
B)194.80
C)214.90
D)235.20
E)246.00
-Use a three-period weighted moving average with wt = 0.7, wt-1 = 0.2, and wt-2 = 0.1 to forecast demand for January.
A)183.60
B)194.80
C)214.90
D)235.20
E)246.00
Unlock Deck
Unlock for access to all 45 flashcards in this deck.
Unlock Deck
k this deck
11
A firm's demand data from the last two quarters is displayed in the table.
-If last period's forecast was 27, and the actual demand was 30, what was the forecast error?
A)+3.00
B)+2.00
C)+1.00
D)-2.00
E)-3.00
-If last period's forecast was 27, and the actual demand was 30, what was the forecast error?
A)+3.00
B)+2.00
C)+1.00
D)-2.00
E)-3.00
Unlock Deck
Unlock for access to all 45 flashcards in this deck.
Unlock Deck
k this deck
12
A company has the information shown in the chart below regarding its forecast performance in the past three periods.
-Calculate the mean absolute deviation (MAD).
A)-66.67
B)225.00
C)200.00
D)1,200.00
E)Need more information to answer the question
-Calculate the mean absolute deviation (MAD).
A)-66.67
B)225.00
C)200.00
D)1,200.00
E)Need more information to answer the question
Unlock Deck
Unlock for access to all 45 flashcards in this deck.
Unlock Deck
k this deck
13
A company has the information shown in the chart below regarding its forecast performance in the past three periods.
-Calculate the running sum of forecast error (RSFE) that provides a measure of forecast bias.
A)-66.67
B)-200.00
C)-300.00
D)400.00
E)Need more information to answer the question
-Calculate the running sum of forecast error (RSFE) that provides a measure of forecast bias.
A)-66.67
B)-200.00
C)-300.00
D)400.00
E)Need more information to answer the question
Unlock Deck
Unlock for access to all 45 flashcards in this deck.
Unlock Deck
k this deck
14
A company has the data shown in the chart below concerning its forecast performance over the past five time periods.
-Calculate the forecast demand for Period 2.
A)310
B)320
C)330
D)340
E)350
-Calculate the forecast demand for Period 2.
A)310
B)320
C)330
D)340
E)350
Unlock Deck
Unlock for access to all 45 flashcards in this deck.
Unlock Deck
k this deck
15
A company has the data shown in the chart below concerning its forecast performance over the past five time periods.
-Calculate the actual demand for Period 5.
A)330
B)350
C)370
D)390
E)310
-Calculate the actual demand for Period 5.
A)330
B)350
C)370
D)390
E)310
Unlock Deck
Unlock for access to all 45 flashcards in this deck.
Unlock Deck
k this deck
16
A company has the data shown in the chart below concerning its forecast performance over the past five time periods.
-Calculate the forecast error for Period 3.
A)0
B)-15
C)15
D)5
E)Need more information to answer the question
-Calculate the forecast error for Period 3.
A)0
B)-15
C)15
D)5
E)Need more information to answer the question
Unlock Deck
Unlock for access to all 45 flashcards in this deck.
Unlock Deck
k this deck
17
A company has the data shown in the chart below concerning its forecast performance over the past five time periods.
-Calculate the absolute percentage error for Period 1.
A)5.4054%
B)9.6774%
C)4.4776%
D)3.125%
E)7.2464%
-Calculate the absolute percentage error for Period 1.
A)5.4054%
B)9.6774%
C)4.4776%
D)3.125%
E)7.2464%
Unlock Deck
Unlock for access to all 45 flashcards in this deck.
Unlock Deck
k this deck
18
A company has the data shown in the chart below concerning its forecast performance over the past five time periods.
-Calculate the running sum of forecast error (RSFE).
A)0
B)10
C)-10
D)2.00
E)-2.00
-Calculate the running sum of forecast error (RSFE).
A)0
B)10
C)-10
D)2.00
E)-2.00
Unlock Deck
Unlock for access to all 45 flashcards in this deck.
Unlock Deck
k this deck
19
A company has the data shown in the chart below concerning its forecast performance over the past five time periods.
-In examining the data above, the manager exclaimed that she was very happy to see no bias in the forecasts. How would you respond to the manager?
A)The manager is correct.
B)I beg to differ, but there is a slight negative bias.
C)I beg to differ, but there appears to be slight positive bias.
D)There is no way one can estimate bias looking at the data.
E)Need more information to answer the question
Unlock Deck
Unlock for access to all 45 flashcards in this deck.
Unlock Deck
k this deck
20
A company has the data shown in the chart below concerning its forecast performance over the past five time periods.
-Calculate the mean absolute deviation (MAD).
A)0.00
B)10.00
C)20.00
D)100.00
E)Need more information to answer the question
-Calculate the mean absolute deviation (MAD).
A)0.00
B)10.00
C)20.00
D)100.00
E)Need more information to answer the question
Unlock Deck
Unlock for access to all 45 flashcards in this deck.
Unlock Deck
k this deck
21
A company has the data shown in the chart below concerning its forecast performance over the past five time periods.
-Calculate the mean absolute percentage error (MAPE).
A)5.41%
B)9.68%
C)4.48%
D)5.99%
E)Need more information to answer the question
-Calculate the mean absolute percentage error (MAPE).
A)5.41%
B)9.68%
C)4.48%
D)5.99%
E)Need more information to answer the question
Unlock Deck
Unlock for access to all 45 flashcards in this deck.
Unlock Deck
k this deck
22
A company has the data shown in the chart below concerning its forecast performance over the past five time periods.
-Calculate the tracking signal for Period 1 (TS = RSFE / MAD)
A)0.00
B)+1.00
C)-1.00
D)+2.00
E)Need more information to answer the question
-Calculate the tracking signal for Period 1 (TS = RSFE / MAD)
A)0.00
B)+1.00
C)-1.00
D)+2.00
E)Need more information to answer the question
Unlock Deck
Unlock for access to all 45 flashcards in this deck.
Unlock Deck
k this deck
23
A company has the data shown in the chart below concerning its forecast performance over the past five time periods.
-Calculate the tracking signal for Period 4 (TS = RSFE / MAD).
A)+2.00
B)+1.00
C)-1.00
D)-0.50
E)+0.50
-Calculate the tracking signal for Period 4 (TS = RSFE / MAD).
A)+2.00
B)+1.00
C)-1.00
D)-0.50
E)+0.50
Unlock Deck
Unlock for access to all 45 flashcards in this deck.
Unlock Deck
k this deck
24
Given the series of demand data below
-What is the two-period moving-average forecast for Week 9?
A)41.5
B)39.0.
C)34.5.
D)39.0
E)34.0
-What is the two-period moving-average forecast for Week 9?
A)41.5
B)39.0.
C)34.5.
D)39.0
E)34.0
Unlock Deck
Unlock for access to all 45 flashcards in this deck.
Unlock Deck
k this deck
25
Given the series of demand data below
-What is the four-period moving-average forecast for Week 11?
A)41.8
B)36.8
C)37.3
D)36.5
E)38.0
-What is the four-period moving-average forecast for Week 11?
A)41.8
B)36.8
C)37.3
D)36.5
E)38.0
Unlock Deck
Unlock for access to all 45 flashcards in this deck.
Unlock Deck
k this deck
26
Given the series of demand data below
-What is the six-period moving-average forecast for Week 10?
A)39.7
B)35.8
C)40.8
D)40.0
E)36.3
-What is the six-period moving-average forecast for Week 10?
A)39.7
B)35.8
C)40.8
D)40.0
E)36.3
Unlock Deck
Unlock for access to all 45 flashcards in this deck.
Unlock Deck
k this deck
27
Given the series of demand data below
-Calculate the running sum of forecast error (RSFE) for n = 2 (two-period moving average) between Weeks 7 and 10.
A)0.00
B)-0.50
C)-2.00
D)+2.00
E)+0.50
-Calculate the running sum of forecast error (RSFE) for n = 2 (two-period moving average) between Weeks 7 and 10.
A)0.00
B)-0.50
C)-2.00
D)+2.00
E)+0.50
Unlock Deck
Unlock for access to all 45 flashcards in this deck.
Unlock Deck
k this deck
28
Given the series of demand data below
-Calculate the running sum of forecast error (RSFE) for n = 4 (four-period moving average) between Weeks 7 and 10.
A)-6.50
B)-1.65
C)+1.65
D)+6.50
E)0.00
-Calculate the running sum of forecast error (RSFE) for n = 4 (four-period moving average) between Weeks 7 and 10.
A)-6.50
B)-1.65
C)+1.65
D)+6.50
E)0.00
Unlock Deck
Unlock for access to all 45 flashcards in this deck.
Unlock Deck
k this deck
29
Given the series of demand data below
-Calculate the running sum of forecast error (RSFE) for n = 6 (six-period moving average) between Weeks 7 and 10.
A)+9.80
B)+2.45
C)0.00
D)-2.45
E)-9.80
-Calculate the running sum of forecast error (RSFE) for n = 6 (six-period moving average) between Weeks 7 and 10.
A)+9.80
B)+2.45
C)0.00
D)-2.45
E)-9.80
Unlock Deck
Unlock for access to all 45 flashcards in this deck.
Unlock Deck
k this deck
30
Given the series of demand data below
-Calculate the mean absolute deviation (MAD) for n = 2 (two-period moving average) between Weeks 7 and 10.
A)0.00
B)+5.25
C)-5.25
D)+21.00
E)-21.00
-Calculate the mean absolute deviation (MAD) for n = 2 (two-period moving average) between Weeks 7 and 10.
A)0.00
B)+5.25
C)-5.25
D)+21.00
E)-21.00
Unlock Deck
Unlock for access to all 45 flashcards in this deck.
Unlock Deck
k this deck
31
Given the series of demand data below
-Calculate the mean absolute deviation (MAD) for n = 4 (four-period moving average) between Weeks 7 and 10.
A)3.80
B)7.50
C)4.00
D)16.00
E)2.00
-Calculate the mean absolute deviation (MAD) for n = 4 (four-period moving average) between Weeks 7 and 10.
A)3.80
B)7.50
C)4.00
D)16.00
E)2.00
Unlock Deck
Unlock for access to all 45 flashcards in this deck.
Unlock Deck
k this deck
32
Given the series of demand data below
-Calculate the mean absolute deviation (MAD) for n = 6 (six-period moving average) between Weeks 7 and 10.
A)17.80
B)11.80
C)3.70
D)2.00
E)4.46
-Calculate the mean absolute deviation (MAD) for n = 6 (six-period moving average) between Weeks 7 and 10.
A)17.80
B)11.80
C)3.70
D)2.00
E)4.46
Unlock Deck
Unlock for access to all 45 flashcards in this deck.
Unlock Deck
k this deck
33
A well-educated lumberjack decides to use linear regression to predict the demand for firewood based on the ambient temperature. He has collected data on firewood sales and temperature for the last several days and has performed some preliminary calculations as shown in the table.
-What is his regression equation based on the data?
A)Ricks = 50.6 - 0.93 x Temp
B)Temp = 53.3 - 1.0 x Ricks
C)Ricks = 0.93 - 50.6 x Temp
D)Temp = 1.0 - 53.3 x Ricks
E)Need more information to answer the question
-What is his regression equation based on the data?
A)Ricks = 50.6 - 0.93 x Temp
B)Temp = 53.3 - 1.0 x Ricks
C)Ricks = 0.93 - 50.6 x Temp
D)Temp = 1.0 - 53.3 x Ricks
E)Need more information to answer the question
Unlock Deck
Unlock for access to all 45 flashcards in this deck.
Unlock Deck
k this deck
34
A well-educated lumberjack decides to use linear regression to predict the demand for firewood based on the ambient temperature. He has collected data on firewood sales and temperature for the last several days and has performed some preliminary calculations as shown in the table.
-Determine the regression equation based on the data. What is the y-axis intercept?
A)1.0
B)0.93
C)53.3
D)50.6
E)Need more information to answer the question
-Determine the regression equation based on the data. What is the y-axis intercept?
A)1.0
B)0.93
C)53.3
D)50.6
E)Need more information to answer the question
Unlock Deck
Unlock for access to all 45 flashcards in this deck.
Unlock Deck
k this deck
35
A well-educated lumberjack decides to use linear regression to predict the demand for firewood based on the ambient temperature. He has collected data on firewood sales and temperature for the last several days and has performed some preliminary calculations as shown in the table.
-Determine the regression equation based on the data. What is the slope of the regression equation?
A)1.0
B)-0.93
C)-53.3
D)-50.6
E)Need more information to answer the question
-Determine the regression equation based on the data. What is the slope of the regression equation?
A)1.0
B)-0.93
C)-53.3
D)-50.6
E)Need more information to answer the question
Unlock Deck
Unlock for access to all 45 flashcards in this deck.
Unlock Deck
k this deck
36
A well-educated lumberjack decides to use linear regression to predict the demand for firewood based on the ambient temperature. He has collected data on firewood sales and temperature for the last several days and has performed some preliminary calculations as shown in the table.
-Determine the regression equation based on the data. What is the sample correlation coefficient (R) for the regression equation?
A)0.976
B)0.952
C)0.946
D)-0.976
E)-0.952
-Determine the regression equation based on the data. What is the sample correlation coefficient (R) for the regression equation?
A)0.976
B)0.952
C)0.946
D)-0.976
E)-0.952
Unlock Deck
Unlock for access to all 45 flashcards in this deck.
Unlock Deck
k this deck
37
A well-educated lumberjack decides to use linear regression to predict the demand for firewood based on the ambient temperature. He has collected data on firewood sales and temperature for the last several days and has performed some preliminary calculations as shown in the table.
-Determine the regression equation based on the data. What is the sample coefficient of determination (R-square) for the regression equation?
A)0.976
B)0.952
C)0.946
D)-0.976
E)-0.952
-Determine the regression equation based on the data. What is the sample coefficient of determination (R-square) for the regression equation?
A)0.976
B)0.952
C)0.946
D)-0.976
E)-0.952
Unlock Deck
Unlock for access to all 45 flashcards in this deck.
Unlock Deck
k this deck
38
A well-educated lumberjack decides to use linear regression to predict the demand for firewood based on the ambient temperature. He has collected data on firewood sales and temperature for the last several days and has performed some preliminary calculations as shown in the table.
-Sampson and Delilah advertising company is interested in an appropriate mix of print, radio, and television ads for their new client. Steven Nash performs a multiple regression on the effects of dollars spent on each type of media on dollars of sales of product. Nash uses data from the most recent advertising campaigns and develops the following equation:
Y = 254,215 + 6.79 * Print - 1.4 * Radio + 16.87 *Television
The r-squared statistic is 0.77. Which of the following statements is BEST?
A)At a minimum, the client will sell $254,215 worth of product after the new advertising campaign.
B)At a maximum, the client will sell $254,215 worth of product after the new advertising campaign.
C)This equation will be of no use in predicting the amount of sales based on advertising in these media.
D)The client should spend more money on television advertising than on radio advertising.
E)Need more information to answer the question
Unlock Deck
Unlock for access to all 45 flashcards in this deck.
Unlock Deck
k this deck
39
A well-educated lumberjack decides to use linear regression to predict the demand for firewood based on the ambient temperature. He has collected data on firewood sales and temperature for the last several days and has performed some preliminary calculations as shown in the table.
-Marilyn runs a multiple regression for the output of cheese curds by using the daily temperature and the consumption of sweet clover. The intercept term is 23, the slope coefficient for the daily temperature is 1.5, and the slope coefficient for the consumption of sweet clover is 0. Which of these conclusions is most appropriate?
A)Marilyn should collect more data.
B)The most important term in Marilyn's model is the intercept.
C)As the daily temperature rises, the intercept term probably decreases.
D)Marilyn should drop the sweet-clover term from her model.
E)Need more information to answer the question
Unlock Deck
Unlock for access to all 45 flashcards in this deck.
Unlock Deck
k this deck
40
Humboldt Corporation is preparing an aggregate production plan for fasteners for the next four quarters. The company's expected quarterly demand is given in the following table. The company will have 1,000 fasteners in inventory at the beginning of the year and wishes to maintain at least that number at the end of each quarter. Following is other critical data:
Production cost per unit = $250
Inventory carrying cost per quarter per unit = $10 (based on quarter-ending inventory)
Hiring cost per worker = $1,000
Firing cost per worker = $2,000
Beginning number of workers = 10
Each worker can produce 100 units per quarter.
Any worker on the staff at the end of the year will not be fired at that time.
-If Humboldt prefers a level plan, what will be the regular production rate per quarter?
A)5,000 units
B)4,000 units
C)6,000 units
D)Regular production will vary each month.
E)Need more information to answer the question
Unlock Deck
Unlock for access to all 45 flashcards in this deck.
Unlock Deck
k this deck
41
Humboldt Corporation is preparing an aggregate production plan for fasteners for the next four quarters. The company's expected quarterly demand is given in the following table. The company will have 1,000 fasteners in inventory at the beginning of the year and wishes to maintain at least that number at the end of each quarter. Following is other critical data:
Production cost per unit = $250
Inventory carrying cost per quarter per unit = $10 (based on quarter-ending inventory)
Hiring cost per worker = $1,000
Firing cost per worker = $2,000
Beginning number of workers = 10
Each worker can produce 100 units per quarter.
Any worker on the staff at the end of the year will not be fired at that time.
-Given the above information, what is the inventory carrying cost of a level plan?
A)$100,000
B)$700,000
C)$70,000
D)$7,000
E)Need more information to answer the question
Unlock Deck
Unlock for access to all 45 flashcards in this deck.
Unlock Deck
k this deck
42
Humboldt Corporation is preparing an aggregate production plan for fasteners for the next four quarters. The company's expected quarterly demand is given in the following table. The company will have 1,000 fasteners in inventory at the beginning of the year and wishes to maintain at least that number at the end of each quarter. Following is other critical data:
Production cost per unit = $250
Inventory carrying cost per quarter per unit = $10 (based on quarter-ending inventory)
Hiring cost per worker = $1,000
Firing cost per worker = $2,000
Beginning number of workers = 10
Each worker can produce 100 units per quarter.
Any worker on the staff at the end of the year will not be fired at that time.
-Given the above information, what is the total cost of a level plan?
A)$5,740,000
B)$5,110,000
C)$5,140,000
D)$5,000,000
E)Need more information to answer the question
Unlock Deck
Unlock for access to all 45 flashcards in this deck.
Unlock Deck
k this deck
43
Vodafone Corporation is preparing an aggregate production plan for its product for the next four months. The firm's expected monthly demand is given in the following table. The firm will have 100 units in inventory at the beginning of the month and wishes to maintain at least 100 units at the end of each month. The following is other critical data:
Production cost per unit = $125
Inventory carrying cost per quarter per unit = $10 (based on quarter-ending inventory)
Hiring cost per associate = $50
Firing cost per associate = $100
Beginning number of associates = 25
Each associate can produce 25 units per month.
-Given the above information, what is the total inventory carrying cost of a chase plan?
A)$6,000
B)$4,000
C)$5,000
D)$4,500
E)Need more information to answer the question
Unlock Deck
Unlock for access to all 45 flashcards in this deck.
Unlock Deck
k this deck
44
Vodafone Corporation is preparing an aggregate production plan for its product for the next four months. The firm's expected monthly demand is given in the following table. The firm will have 100 units in inventory at the beginning of the month and wishes to maintain at least 100 units at the end of each month. The following is other critical data:
Production cost per unit = $125
Inventory carrying cost per quarter per unit = $10 (based on quarter-ending inventory)
Hiring cost per associate = $50
Firing cost per associate = $100
Beginning number of associates = 25
Each associate can produce 25 units per month.
-Given the above information, what is the total cost of a chase plan (using hiring and firing)?
A)$379,800
B)$379,000
C)$381,100
D)$380,300
E)Need more information to answer the question
Unlock Deck
Unlock for access to all 45 flashcards in this deck.
Unlock Deck
k this deck
45
Vodafone Corporation is preparing an aggregate production plan for its product for the next four months. The firm's expected monthly demand is given in the following table. The firm will have 100 units in inventory at the beginning of the month and wishes to maintain at least 100 units at the end of each month. The following is other critical data:
Production cost per unit = $125
Inventory carrying cost per quarter per unit = $10 (based on quarter-ending inventory)
Hiring cost per associate = $50
Firing cost per associate = $100
Beginning number of associates = 25
Each associate can produce 25 units per month.
-A lamp manufacturer enters a six-month planning a period with forecasts as indicated in the table. To make things as stable as possible, the sales and operations planner decides to use a level plan throughout the period. The starting inventory is 240 units, and the planner would like to end this period with no inventory. How much should they produce in September?
A)302 units
B)305 units
C)265 units
D)351 units
E)Need more information to answer the question
Unlock Deck
Unlock for access to all 45 flashcards in this deck.
Unlock Deck
k this deck
Unlock Deck
Unlock for access to all 45 flashcards in this deck.


