Deck 1: Preliminaries: Introduction to Statistical Investigations
Full screen (f)
Question
Question
Question
Question
Question
Question
Question
Question
Question
Question
Question
Question
Question
Question
Question
Question
Question
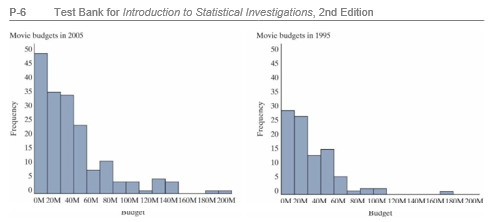
The plots below were created using a data set containing information about movies re-leased in 1995 and 2005. Note: M = million. 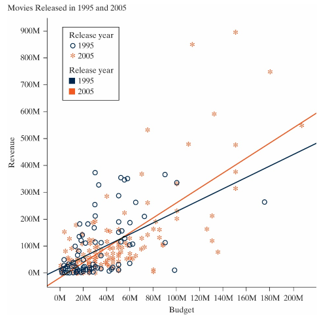
-Identify all variables measured on the observational units that are displayed in the three plots above. Select all that apply.
A) Budget
B) Revenue
C) Year
D) Frequency
-Identify all variables measured on the observational units that are displayed in the three plots above. Select all that apply.
A) Budget
B) Revenue
C) Year
D) Frequency
Question
The plots below were created using a data set containing information about movies re-leased in 1995 and 2005. Note: M = million.
-What is the shape of the distribution of movie budgets in the year 1995?
A) Symmetric
B) Bell-shaped
C) Skewed left
D) Skewed right
-What is the shape of the distribution of movie budgets in the year 1995?
A) Symmetric
B) Bell-shaped
C) Skewed left
D) Skewed right
Question
The plots below were created using a data set containing information about movies re-leased in 1995 and 2005. Note: M = million.
-Which year had a lower mean movie budget?
A) 1995
B) 2005
C) The two years had the same mean movie budget.
D) This cannot be determined from the information given.
-Which year had a lower mean movie budget?
A) 1995
B) 2005
C) The two years had the same mean movie budget.
D) This cannot be determined from the information given.
Question
The plots below were created using a data set containing information about movies re-leased in 1995 and 2005. Note: M = million.
-Which year had larger variability in movie budgets?
A) 1995
B) 2005
C) The two years had the same variability in movie budget.
D) This cannot be determined from the information given.
-Which year had larger variability in movie budgets?
A) 1995
B) 2005
C) The two years had the same variability in movie budget.
D) This cannot be determined from the information given.
Question
The plots below were created using a data set containing information about movies re-leased in 1995 and 2005. Note: M = million.
-Which year had a higher mean movie revenue?
A) 1995
B) 2005
C) The two years had the same mean movie revenue.
D) This cannot be determined from the information given.
-Which year had a higher mean movie revenue?
A) 1995
B) 2005
C) The two years had the same mean movie revenue.
D) This cannot be determined from the information given.
Question
The plots below were created using a data set containing information about movies re-leased in 1995 and 2005. Note: M = million.
-Which year had smaller variability in movie revenue?
A) 1995
B) 2005
C) The two years had the same mean movie budget.
D) This cannot be determined from the information given.
-Which year had smaller variability in movie revenue?
A) 1995
B) 2005
C) The two years had the same mean movie budget.
D) This cannot be determined from the information given.
Question
The plots below were created using a data set containing information about movies re-leased in 1995 and 2005. Note: M = million.
-Did the association between movie budget and movie revenue change between 1995 and 2005?
A) No, since the shapes of the two histograms are similar.
B) No, since the scatterplot shows a positive association between movie budget and movie revenue for both years.
C) Yes, since the slope of the line is steeper in 2005 than in 1995 in the scatterplot of movie revenue versus movie budget.
D) Yes, since there are more outliers in 2005 than in 1995.
Question
Question
Question
The following plots display data exam scores for two different statistics classes. 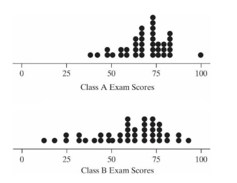
-Which class had a larger standard deviation of exam scores?
A) Class A
B) Class B
C) The two classes had approximately the same standard deviation.
D) This cannot be determined from the information given.
-Which class had a larger standard deviation of exam scores?
A) Class A
B) Class B
C) The two classes had approximately the same standard deviation.
D) This cannot be determined from the information given.
Question
The following plots display data exam scores for two different statistics classes.
-What is the shape of the distribution of exam scores for Class B?
A) Symmetric
B) Bell-shaped
C) Skewed left
D) Skewed right
-What is the shape of the distribution of exam scores for Class B?
A) Symmetric
B) Bell-shaped
C) Skewed left
D) Skewed right
Question
The following plots display data exam scores for two different statistics classes.
-Does there appear to be any outliers in the two classes?
A) There are no outliers in either class.
B) There is at least one outlier in Class A and at least one outlier in Class B
C) There are no outliers in Class A, but at least one outlier in Class B
D) There are no outliers in Class B, but at least one outlier in Class A
Question
Question
Question
Question
Question
Question
Question
Question
Question
Question
Question
Question
Question
Question
Question
Question
Question
Question

Unlock Deck
Sign up to unlock the cards in this deck!
Unlock Deck
Unlock Deck
1/46
Play
Full screen (f)
Deck 1: Preliminaries: Introduction to Statistical Investigations
1
In June of 2012, New York City Mayor Michael Bloomberg proposed banning the sale of any regular soda or other sugary drinks in containers larger than 16 oz. A fast food chain polled a random sample of 2500 of its regular customers and found that 63% opposed the ban, 28% supported the ban, and 9% had no opinion.
-What are the observational units?
A) Sugary drinks
B) Fast food chain regular customers
C) Whether a customer opposes the ban, supports the ban, or has no opinion
D) The percent of customers that oppose the ban, support the ban, or have no opinion
-What are the observational units?
A) Sugary drinks
B) Fast food chain regular customers
C) Whether a customer opposes the ban, supports the ban, or has no opinion
D) The percent of customers that oppose the ban, support the ban, or have no opinion
Fast food chain regular customers
2
In June of 2012, New York City Mayor Michael Bloomberg proposed banning the sale of any regular soda or other sugary drinks in containers larger than 16 oz. A fast food chain polled a random sample of 2500 of its regular customers and found that 63% opposed the ban, 28% supported the ban, and 9% had no opinion.
-What variable was measured in this study?
A) Sugary drinks
B) Fast food chain regular customers
C) Whether a customer opposes the ban, supports the ban, or has no opinion
D) The percent of customers that oppose the ban, support the ban, or have no opinion
-What variable was measured in this study?
A) Sugary drinks
B) Fast food chain regular customers
C) Whether a customer opposes the ban, supports the ban, or has no opinion
D) The percent of customers that oppose the ban, support the ban, or have no opinion
Whether a customer opposes the ban, supports the ban, or has no opinion
3
In June of 2012, New York City Mayor Michael Bloomberg proposed banning the sale of any regular soda or other sugary drinks in containers larger than 16 oz. A fast food chain polled a random sample of 2500 of its regular customers and found that 63% opposed the ban, 28% supported the ban, and 9% had no opinion.
-What type of variable was measured in this study?
A) Categorical
B) Quantitative
-What type of variable was measured in this study?
A) Categorical
B) Quantitative
Categorical
4
Researchers investigated whether larger bowls increase the mean amount of ice cream people scoop when serving themselves. In a sample of volunteers, participants were ran-domly given either a small (17 oz.) bowl or a large (34 oz.) bowl. They were then invited to scoop as much ice cream as they liked, and the amount of ice cream (in ounces) was measured. The mean amount of ice cream for the participants given a small bowl was 6.43 ounces; the mean amount of ice cream for the participants given a large bowl was 8.15 ounces.
-What are the observational units?
A) Ice cream scoops
B) Participants
C) Researchers
D) Ounces
-What are the observational units?
A) Ice cream scoops
B) Participants
C) Researchers
D) Ounces
Unlock Deck
Unlock for access to all 46 flashcards in this deck.
Unlock Deck
k this deck
5
Researchers investigated whether larger bowls increase the mean amount of ice cream people scoop when serving themselves. In a sample of volunteers, participants were ran-domly given either a small (17 oz.) bowl or a large (34 oz.) bowl. They were then invited to scoop as much ice cream as they liked, and the amount of ice cream (in ounces) was measured. The mean amount of ice cream for the participants given a small bowl was 6.43 ounces; the mean amount of ice cream for the participants given a large bowl was 8.15 ounces.
-What two variables were measured in this study? Select two.
A) Amount of ice cream scooped
B) Mean amount of ice cream scooped
C) Bowl size (small or large)
D) Ounces
-What two variables were measured in this study? Select two.
A) Amount of ice cream scooped
B) Mean amount of ice cream scooped
C) Bowl size (small or large)
D) Ounces
Unlock Deck
Unlock for access to all 46 flashcards in this deck.
Unlock Deck
k this deck
6
Researchers investigated whether larger bowls increase the mean amount of ice cream people scoop when serving themselves. In a sample of volunteers, participants were ran-domly given either a small (17 oz.) bowl or a large (34 oz.) bowl. They were then invited to scoop as much ice cream as they liked, and the amount of ice cream (in ounces) was measured. The mean amount of ice cream for the participants given a small bowl was 6.43 ounces; the mean amount of ice cream for the participants given a large bowl was 8.15 ounces.
-Are the two variables in the study categorical or quantitative?
A) They are both quantitative.
B) They are both categorical.
C) One is quantitative and the other is categorical.
-Are the two variables in the study categorical or quantitative?
A) They are both quantitative.
B) They are both categorical.
C) One is quantitative and the other is categorical.
Unlock Deck
Unlock for access to all 46 flashcards in this deck.
Unlock Deck
k this deck
7
Which of the following research questions could be investigated with a statistical study?
A) Do marathon runners tend to have a higher rate of knee injuries than non-marathon runners?
B) What proportion of voters in my district plan to vote for a proposed sales tax?
C) Is a person's daily caloric intake associated with their cholesterol level?
D) All of the above
A) Do marathon runners tend to have a higher rate of knee injuries than non-marathon runners?
B) What proportion of voters in my district plan to vote for a proposed sales tax?
C) Is a person's daily caloric intake associated with their cholesterol level?
D) All of the above
Unlock Deck
Unlock for access to all 46 flashcards in this deck.
Unlock Deck
k this deck
8
A researcher designed a study to test whether players of the "Drop 7" smartphone app at-tain a higher score if offered a monetary incentive. Of 40 volunteers, 20 were randomly as-signed to a group where high scorers were paid $5 and the other 20 to a group simply told to "do your best." The researcher found that, on average, the volunteers in the group getting the monetary incentive scored substantially higher than those who did not receive a mone-tary incentive (mean score of 13,500 points in the group without the monetary incentive; 15,900 points in the monetary incentive group). Identify the steps of a statistical investiga-tion in this study by answering the following questions about this study.
-Step 1: Ask a research question. What is the research question being investigated in this study?
A) What proportion of "Drop 7" players receive a monetary incentive?
B) Do "Drop 7" players receiving a monetary incentive tend to play the game longer?
C) Do "Drop 7" players tend to score higher if offered a monetary incentive?
D) What proportion of "Drop 7" players have scored higher than 15,900?
Unlock Deck
Unlock for access to all 46 flashcards in this deck.
Unlock Deck
k this deck
9
A researcher designed a study to test whether players of the "Drop 7" smartphone app at-tain a higher score if offered a monetary incentive. Of 40 volunteers, 20 were randomly as-signed to a group where high scorers were paid $5 and the other 20 to a group simply told to "do your best." The researcher found that, on average, the volunteers in the group getting the monetary incentive scored substantially higher than those who did not receive a mone-tary incentive (mean score of 13,500 points in the group without the monetary incentive; 15,900 points in the monetary incentive group). Identify the steps of a statistical investiga-tion in this study by answering the following questions about this study.
-Step 2: Design a study and collect data. What are the observational units in this study?
A) Volunteers
B) Games
C) Dollars
D) Points
-Step 2: Design a study and collect data. What are the observational units in this study?
A) Volunteers
B) Games
C) Dollars
D) Points
Unlock Deck
Unlock for access to all 46 flashcards in this deck.
Unlock Deck
k this deck
10
A researcher designed a study to test whether players of the "Drop 7" smartphone app at-tain a higher score if offered a monetary incentive. Of 40 volunteers, 20 were randomly as-signed to a group where high scorers were paid $5 and the other 20 to a group simply told to "do your best." The researcher found that, on average, the volunteers in the group getting the monetary incentive scored substantially higher than those who did not receive a mone-tary incentive (mean score of 13,500 points in the group without the monetary incentive; 15,900 points in the monetary incentive group). Identify the steps of a statistical investiga-tion in this study by answering the following questions about this study.
-Step 2: Design a study and collect data. How many observational units did the researcher collect data on?
-Step 2: Design a study and collect data. How many observational units did the researcher collect data on?
Unlock Deck
Unlock for access to all 46 flashcards in this deck.
Unlock Deck
k this deck
11
A researcher designed a study to test whether players of the "Drop 7" smartphone app at-tain a higher score if offered a monetary incentive. Of 40 volunteers, 20 were randomly as-signed to a group where high scorers were paid $5 and the other 20 to a group simply told to "do your best." The researcher found that, on average, the volunteers in the group getting the monetary incentive scored substantially higher than those who did not receive a mone-tary incentive (mean score of 13,500 points in the group without the monetary incentive; 15,900 points in the monetary incentive group). Identify the steps of a statistical investiga-tion in this study by answering the following questions about this study.
-Step 2: Design a study and collect data. What are the variables in this study and their types? Select all that apply.
A) Mean scores in each group; quantitative
B) Whether a volunteer was assigned to a monetary incentive or not; categorical
C) A volunteer's "Drop 7" score; quantitative
D) A volunteer's "Drop 7" score; categorical
Unlock Deck
Unlock for access to all 46 flashcards in this deck.
Unlock Deck
k this deck
12
A researcher designed a study to test whether players of the "Drop 7" smartphone app at-tain a higher score if offered a monetary incentive. Of 40 volunteers, 20 were randomly as-signed to a group where high scorers were paid $5 and the other 20 to a group simply told to "do your best." The researcher found that, on average, the volunteers in the group getting the monetary incentive scored substantially higher than those who did not receive a mone-tary incentive (mean score of 13,500 points in the group without the monetary incentive; 15,900 points in the monetary incentive group). Identify the steps of a statistical investiga-tion in this study by answering the following questions about this study.
-Step 3: Explore the data. What are the average scores in the two groups?
Monetary incentive group: ___(B1)___
"Do your best" group: ___ (B2)___
-Step 3: Explore the data. What are the average scores in the two groups?
Monetary incentive group: ___(B1)___
"Do your best" group: ___ (B2)___
Unlock Deck
Unlock for access to all 46 flashcards in this deck.
Unlock Deck
k this deck
13
A researcher designed a study to test whether players of the "Drop 7" smartphone app at-tain a higher score if offered a monetary incentive. Of 40 volunteers, 20 were randomly as-signed to a group where high scorers were paid $5 and the other 20 to a group simply told to "do your best." The researcher found that, on average, the volunteers in the group getting the monetary incentive scored substantially higher than those who did not receive a mone-tary incentive (mean score of 13,500 points in the group without the monetary incentive; 15,900 points in the monetary incentive group). Identify the steps of a statistical investiga-tion in this study by answering the following questions about this study.
-Step 4: Draw inferences beyond the data. What is the researchers' conclusion about the difference in anxiety levels between the two groups?
A) Monetary incentives have no effect on players' "Drop 7" scores.
B) The average "Drop 7" score for a player offered a monetary incentive is higher than the average "Drop 7" score for a player not offered a monetary incentive.
C) The average "Drop 7" score for a player not offered a monetary incentive is higher than the average "Drop 7" score for a player offered a monetary incentive.
D) If you offer a "Drop 7" player a monetary incentive, that player will score higher than if she was not offered a monetary incentive.
Unlock Deck
Unlock for access to all 46 flashcards in this deck.
Unlock Deck
k this deck
14
A researcher designed a study to test whether players of the "Drop 7" smartphone app at-tain a higher score if offered a monetary incentive. Of 40 volunteers, 20 were randomly as-signed to a group where high scorers were paid $5 and the other 20 to a group simply told to "do your best." The researcher found that, on average, the volunteers in the group getting the monetary incentive scored substantially higher than those who did not receive a mone-tary incentive (mean score of 13,500 points in the group without the monetary incentive; 15,900 points in the monetary incentive group). Identify the steps of a statistical investiga-tion in this study by answering the following questions about this study.
-Step 5: Formulate conclusions. In order to make the conclusions of the study more relevant, what is the researcher hoping about the volunteers in this study as compared to all "Drop 7" players?
A) The average IQ level of volunteers in the study is higher than the average IQ level over all "Drop 7" players.
B) The volunteers in the study are less likely to be employed than all other "Drop 7" players.
C) The volunteers in the study tend to play "Drop 7" more often than all other "Drop 7" players.
D) The volunteers in the study have similar behaviors and average scores to all "Drop 7" players.
Unlock Deck
Unlock for access to all 46 flashcards in this deck.
Unlock Deck
k this deck
15
A meteorologist is hoping to find a better model for predicting when and where an avalanche will occur around ski areas in Montana. She plans to collect information from a ski area weather station each day between November 1 through March 31 for each of the next three winters. For each day, the meteorologist will record the high and low tem-perature, amount of snowfall, maximum wind velocity, whether at least half the daylight hours were sunny, and whether an avalanche occurred.
-What are the observational units?
A) Years
B) Ski resorts
C) Days
D) Avalanches
-What are the observational units?
A) Years
B) Ski resorts
C) Days
D) Avalanches
Unlock Deck
Unlock for access to all 46 flashcards in this deck.
Unlock Deck
k this deck
16
A meteorologist is hoping to find a better model for predicting when and where an avalanche will occur around ski areas in Montana. She plans to collect information from a ski area weather station each day between November 1 through March 31 for each of the next three winters. For each day, the meteorologist will record the high and low tem-perature, amount of snowfall, maximum wind velocity, whether at least half the daylight hours were sunny, and whether an avalanche occurred.
-For each variable below, select whether it is categorical or quantitative.
i. High temperature ___(1)___
ii. Whether an avalanche occurred ___(2)___
iii. Whether at least half the daylight hours were sunny ___(3)___
Drop-down options for (1), (2), and (3):
•categorical
•quantitative
-For each variable below, select whether it is categorical or quantitative.
i. High temperature ___(1)___
ii. Whether an avalanche occurred ___(2)___
iii. Whether at least half the daylight hours were sunny ___(3)___
Drop-down options for (1), (2), and (3):
•categorical
•quantitative
Unlock Deck
Unlock for access to all 46 flashcards in this deck.
Unlock Deck
k this deck
17
The plots below were created using a data set containing information about movies re-leased in 1995 and 2005. Note: M = million.
-Identify all variables measured on the observational units that are displayed in the three plots above. Select all that apply.
A) Budget
B) Revenue
C) Year
D) Frequency
-Identify all variables measured on the observational units that are displayed in the three plots above. Select all that apply.
A) Budget
B) Revenue
C) Year
D) Frequency
Unlock Deck
Unlock for access to all 46 flashcards in this deck.
Unlock Deck
k this deck
18
The plots below were created using a data set containing information about movies re-leased in 1995 and 2005. Note: M = million.
-What is the shape of the distribution of movie budgets in the year 1995?
A) Symmetric
B) Bell-shaped
C) Skewed left
D) Skewed right
-What is the shape of the distribution of movie budgets in the year 1995?
A) Symmetric
B) Bell-shaped
C) Skewed left
D) Skewed right
Unlock Deck
Unlock for access to all 46 flashcards in this deck.
Unlock Deck
k this deck
19
The plots below were created using a data set containing information about movies re-leased in 1995 and 2005. Note: M = million.
-Which year had a lower mean movie budget?
A) 1995
B) 2005
C) The two years had the same mean movie budget.
D) This cannot be determined from the information given.
-Which year had a lower mean movie budget?
A) 1995
B) 2005
C) The two years had the same mean movie budget.
D) This cannot be determined from the information given.
Unlock Deck
Unlock for access to all 46 flashcards in this deck.
Unlock Deck
k this deck
20
The plots below were created using a data set containing information about movies re-leased in 1995 and 2005. Note: M = million.
-Which year had larger variability in movie budgets?
A) 1995
B) 2005
C) The two years had the same variability in movie budget.
D) This cannot be determined from the information given.
-Which year had larger variability in movie budgets?
A) 1995
B) 2005
C) The two years had the same variability in movie budget.
D) This cannot be determined from the information given.
Unlock Deck
Unlock for access to all 46 flashcards in this deck.
Unlock Deck
k this deck
21
The plots below were created using a data set containing information about movies re-leased in 1995 and 2005. Note: M = million.
-Which year had a higher mean movie revenue?
A) 1995
B) 2005
C) The two years had the same mean movie revenue.
D) This cannot be determined from the information given.
-Which year had a higher mean movie revenue?
A) 1995
B) 2005
C) The two years had the same mean movie revenue.
D) This cannot be determined from the information given.
Unlock Deck
Unlock for access to all 46 flashcards in this deck.
Unlock Deck
k this deck
22
The plots below were created using a data set containing information about movies re-leased in 1995 and 2005. Note: M = million.
-Which year had smaller variability in movie revenue?
A) 1995
B) 2005
C) The two years had the same mean movie budget.
D) This cannot be determined from the information given.
-Which year had smaller variability in movie revenue?
A) 1995
B) 2005
C) The two years had the same mean movie budget.
D) This cannot be determined from the information given.
Unlock Deck
Unlock for access to all 46 flashcards in this deck.
Unlock Deck
k this deck
23
The plots below were created using a data set containing information about movies re-leased in 1995 and 2005. Note: M = million.
-Did the association between movie budget and movie revenue change between 1995 and 2005?
A) No, since the shapes of the two histograms are similar.
B) No, since the scatterplot shows a positive association between movie budget and movie revenue for both years.
C) Yes, since the slope of the line is steeper in 2005 than in 1995 in the scatterplot of movie revenue versus movie budget.
D) Yes, since there are more outliers in 2005 than in 1995.
Unlock Deck
Unlock for access to all 46 flashcards in this deck.
Unlock Deck
k this deck
24
Which of the following variables are likely to be skewed right? Select all that apply.
A) College GPA
B) IQ
C) Home prices
D) Battery lifetimes
A) College GPA
B) IQ
C) Home prices
D) Battery lifetimes
Unlock Deck
Unlock for access to all 46 flashcards in this deck.
Unlock Deck
k this deck
25
Which of the following variables are likely to be symmetric? Select all that apply.
A) Cereal box weights
B) IQ
C) Home prices
D) Battery lifetimes
A) Cereal box weights
B) IQ
C) Home prices
D) Battery lifetimes
Unlock Deck
Unlock for access to all 46 flashcards in this deck.
Unlock Deck
k this deck
26
The following plots display data exam scores for two different statistics classes.
-Which class had a larger standard deviation of exam scores?
A) Class A
B) Class B
C) The two classes had approximately the same standard deviation.
D) This cannot be determined from the information given.
-Which class had a larger standard deviation of exam scores?
A) Class A
B) Class B
C) The two classes had approximately the same standard deviation.
D) This cannot be determined from the information given.
Unlock Deck
Unlock for access to all 46 flashcards in this deck.
Unlock Deck
k this deck
27
The following plots display data exam scores for two different statistics classes.
-What is the shape of the distribution of exam scores for Class B?
A) Symmetric
B) Bell-shaped
C) Skewed left
D) Skewed right
-What is the shape of the distribution of exam scores for Class B?
A) Symmetric
B) Bell-shaped
C) Skewed left
D) Skewed right
Unlock Deck
Unlock for access to all 46 flashcards in this deck.
Unlock Deck
k this deck
28
The following plots display data exam scores for two different statistics classes.
-Does there appear to be any outliers in the two classes?
A) There are no outliers in either class.
B) There is at least one outlier in Class A and at least one outlier in Class B
C) There are no outliers in Class A, but at least one outlier in Class B
D) There are no outliers in Class B, but at least one outlier in Class A
Unlock Deck
Unlock for access to all 46 flashcards in this deck.
Unlock Deck
k this deck
29
Which of the following sets of numbers has the largest standard deviation?
A) 100, 101, 102, 103, 104
B) 1, 5, 10, 15, 20
C) 300, 300, 300, 300, 300
D) 1, 1, 1, 30, 30
A) 100, 101, 102, 103, 104
B) 1, 5, 10, 15, 20
C) 300, 300, 300, 300, 300
D) 1, 1, 1, 30, 30
Unlock Deck
Unlock for access to all 46 flashcards in this deck.
Unlock Deck
k this deck
30
Which of the following sets of numbers has the smallest standard deviation?
A) 100, 101, 102, 103, 104
B) 1, 5, 10, 15, 20
C) 300, 300, 300, 300, 300
D) 1, 1, 1, 30, 30
A) 100, 101, 102, 103, 104
B) 1, 5, 10, 15, 20
C) 300, 300, 300, 300, 300
D) 1, 1, 1, 30, 30
Unlock Deck
Unlock for access to all 46 flashcards in this deck.
Unlock Deck
k this deck
31
A histogram that has the majority of data on the left with a long right tail is skewed left.
Unlock Deck
Unlock for access to all 46 flashcards in this deck.
Unlock Deck
k this deck
32
Van Nood et al. (2013) studied patients with "Clostridium difficile" infections, which cause persistent diarrhea. One variable was treatment: some patients were given the antibiotic vancomycin, and some patients were given a fecal transplant. The other variable was whether the patient was cured (cured or not cured). Van Nood randomly assigned an equal number of patients to each treatment. The researchers found that 18% of the patients in the antibiotic vancomycin treatment group were cured, whereas 69% of patients in the fecal transplant were cured.
-Out of 100 Clostridium difficile patients taking the antibiotic vancomycin, 18 of them will be cured.
-Out of 100 Clostridium difficile patients taking the antibiotic vancomycin, 18 of them will be cured.
Unlock Deck
Unlock for access to all 46 flashcards in this deck.
Unlock Deck
k this deck
33
Van Nood et al. (2013) studied patients with "Clostridium difficile" infections, which cause persistent diarrhea. One variable was treatment: some patients were given the antibiotic vancomycin, and some patients were given a fecal transplant. The other variable was whether the patient was cured (cured or not cured). Van Nood randomly assigned an equal number of patients to each treatment. The researchers found that 18% of the patients in the antibiotic vancomycin treatment group were cured, whereas 69% of patients in the fecal transplant were cured.
-Explain what the value 0.69 means, as if to someone who has never studied probability or statistics.
A) In the long run, about 69% of Clostridium difficile patients given a fecal transplant will be cured.
B) In the long run, about 69% of Clostridium difficile patients will be cured.
C) In the long run, about 69% of Clostridium difficile patients given the antibiotic vancomycin will be cured.
D) In the long run, about 69% of Clostridium difficile patients that were cured were given a fecal transplant.
Unlock Deck
Unlock for access to all 46 flashcards in this deck.
Unlock Deck
k this deck
34
A student participates in a Coke versus Pepsi taste test. She correctly identifies the correct soda 4 times out of 6 tries. She claims that this proves that she can reliably tell the difference between the two soft drinks. You have studied statistics and you want to determine the probability of anyone getting at least 4 right out of 6 tries just by chance alone. Which of the following would provide an accurate estimate of that probability?
A) Have the student repeat this experiment many times and calculate the percentage of times she correctly distinguishes between the brands.
B) Repeat this experiment with a very large sample of people and calculate the percentage of people who make four correct guesses out of six tries.
C) Simulate this on the computer with a 50% chance of guessing the correct soft drink on each try, and calculate the proportion of times there are 4 or more correct guesses out of 6 trials.
D) All of the methods listed above would provide an accurate estimate of the probability.
Unlock Deck
Unlock for access to all 46 flashcards in this deck.
Unlock Deck
k this deck
35
Many football bets include a "point-spread" so that the team that is favored needs to win by more than that amount for a "victory." The point-spreads are designed by professional odds makers with the intention that the probability of the favored team winning by the required amount is 0.50.
-In many, many football games, the favored team will win by the point-spread in about 50% of those games.
-In many, many football games, the favored team will win by the point-spread in about 50% of those games.
Unlock Deck
Unlock for access to all 46 flashcards in this deck.
Unlock Deck
k this deck
36
Many football bets include a "point-spread" so that the team that is favored needs to win by more than that amount for a "victory." The point-spreads are designed by professional odds makers with the intention that the probability of the favored team winning by the required amount is 0.50.
-The favored team won by the required amount in 7 out of 10 games. Describe how you could conduct a simulation to estimate the probability of this happening if the true proportion that the favored team won by the required amount is 0.50.
A) Observe 10 football games many many times, and calculate the proportion of times the favored team won by the required amount in 7 of these games.
B) Take 7 red cards and 3 blue cards. Shuffle the cards, then draw one card, with replacement, 10 times, and count the number of red cards. Repeat this many times, and calculate the proportion of times you observed 7 of 10 red cards.
C) Take 5 red cards and 5 blue cards. Shuffle the cards, then draw one card, with replacement, 10 times, and count the number of red cards. Repeat this many times, and calculate the proportion of times you observed 7 of 10 red cards.
D) All of the methods listed above would provide an accurate estimate of the probability.
Unlock Deck
Unlock for access to all 46 flashcards in this deck.
Unlock Deck
k this deck
37
Suppose you plan to flip a fair coin and count the number of times the coin lands on "heads". Let H represent "heads" and T represent "tails".
-Which of the following sequences of heads and tails is the least likely to occur?
A) HHHHHH
B) HHHTTT
C) HTTHHT
D) All of the above sequences have the same probability.
-Which of the following sequences of heads and tails is the least likely to occur?
A) HHHHHH
B) HHHTTT
C) HTTHHT
D) All of the above sequences have the same probability.
Unlock Deck
Unlock for access to all 46 flashcards in this deck.
Unlock Deck
k this deck
38
Suppose you plan to flip a fair coin and count the number of times the coin lands on "heads". Let H represent "heads" and T represent "tails".
-You plan to flip the coin n times. For which of the following values of n would you have the highest probability of observing all heads?
A) n = 2
B) n = 5
C) n = 20
D) n = 100
-You plan to flip the coin n times. For which of the following values of n would you have the highest probability of observing all heads?
A) n = 2
B) n = 5
C) n = 20
D) n = 100
Unlock Deck
Unlock for access to all 46 flashcards in this deck.
Unlock Deck
k this deck
39
An environmental science teacher at a high school with a large population of students was curious whether the majority (more than half) of students at the school regularly recycle plastic bottles. The teacher asks 146 students at the school: "Do you recycle plastic bottles more often than you throw them in the trash?" (Yes/No). Suppose that 89 of the students answered "Yes".
-How could we simulate the teacher's survey if 50% of students at the school would have answered Yes? Select all that apply.
A) Flip a coin 146 times, where heads represents "answered Yes." Count the number of heads in 146 flips.
B) Create a spinner with 61% shaded to represent "answered Yes." Spin the spinner 146 times and count the number of times the spinner lands in the shaded area.
C) Have 5 black cards and 5 red cards where black represents "answered Yes." Draw with replacement from the cards 146 times and count the number of times a black card is drawn.
D) Create a spinner with 50% shaded to represent "answered Yes." Spin the spinner 146 times and count the number of times the spinner lands in the shaded area.
Unlock Deck
Unlock for access to all 46 flashcards in this deck.
Unlock Deck
k this deck
40
An environmental science teacher at a high school with a large population of students was curious whether the majority (more than half) of students at the school regularly recycle plastic bottles. The teacher asks 146 students at the school: "Do you recycle plastic bottles more often than you throw them in the trash?" (Yes/No). Suppose that 89 of the students answered "Yes".
-If 50% of students at the school regularly recycle plastic bottles, there is only a 0.60% chance that 89 or more students out of 146 would have answered Yes to the teacher's survey. What does this tell you about the proportion of all students at the school that regularly recycle plastic bottles?
A) This probability proves that the proportion of all students at the school that regularly recycle plastic bottles is not equal to 50%.
B) This probability proves that the proportion of all students at the school that regularly recycle plastic bottles is equal to 61%.
C) 50% is not a plausible value for the proportion of all students at the school that regularly recycle plastic bottles.
D) 50% is a plausible value for the proportion of all students at the school that regularly recycle plastic bottles.
Unlock Deck
Unlock for access to all 46 flashcards in this deck.
Unlock Deck
k this deck
41
Suppose you plan to roll a six-sided die.
-Which of the following sequences of die rolls is the least likely to occur?
A) 1 - 1 - 1 - 1 - 1
B) 2 - 3 - 4 - 5 - 6
C) 1 - 5 - 2 - 1 - 3
D) All of the above sequences have the same probability.
-Which of the following sequences of die rolls is the least likely to occur?
A) 1 - 1 - 1 - 1 - 1
B) 2 - 3 - 4 - 5 - 6
C) 1 - 5 - 2 - 1 - 3
D) All of the above sequences have the same probability.
Unlock Deck
Unlock for access to all 46 flashcards in this deck.
Unlock Deck
k this deck
42
Suppose you plan to roll a six-sided die.
-You plan to roll the die n times. With each roll, you record whether the die landed on an odd number or an even number. For which of the following values of n would you have the lowest probability of observing all even number rolls?
A) n = 2
B) n = 5
C) n = 20
D) n = 100
-You plan to roll the die n times. With each roll, you record whether the die landed on an odd number or an even number. For which of the following values of n would you have the lowest probability of observing all even number rolls?
A) n = 2
B) n = 5
C) n = 20
D) n = 100
Unlock Deck
Unlock for access to all 46 flashcards in this deck.
Unlock Deck
k this deck
43
The lottery game Powerball advertises that the probability of winning a prize is 0.04. This means that if 100 people play Powerball, then 4 of them will win a prize.
Unlock Deck
Unlock for access to all 46 flashcards in this deck.
Unlock Deck
k this deck
44
The lottery game Powerball advertises that the probability of winning a prize is 0.04. This means that, in the long run, if thousands of people play Powerball, then about 4% of them will win a prize.
Unlock Deck
Unlock for access to all 46 flashcards in this deck.
Unlock Deck
k this deck
45
A classmate claims that he can smell the difference between a Starbucks cup of coffee and a Dunkin' Donuts cup of coffee. You decide to test this claim by blindfolding him and presenting him with two cups of coffee - one from Starbucks and one from Dunkin' Donuts.
-Your classmate guesses the correct brand of coffee both times in two trials. Does this convince you that your classmate's claim is true?
A) Yes, since the classmate was correct in 100% of the trials.
B) Yes, since if the classmate was just guessing, it is very unlikely to guess correctly twice in a row.
C) No, since if the classmate was just guessing, there is a 50% chance of guessing correctly twice in a row.
D) No, since if the classmate was just guessing, there is a 25% chance of guessing correctly twice in a row.
Unlock Deck
Unlock for access to all 46 flashcards in this deck.
Unlock Deck
k this deck
46
A classmate claims that he can smell the difference between a Starbucks cup of coffee and a Dunkin' Donuts cup of coffee. You decide to test this claim by blindfolding him and presenting him with two cups of coffee - one from Starbucks and one from Dunkin' Donuts.
-Your classmate guesses the correct brand of coffee in 65 out of 100 trials. Does this convince you that your classmate's claim is true?
A) No, since 65 out of 100 is close to 50%.
B) No, since the classmate did not guess correctly in all 100 trials.
C) Yes, since there is less than a 1% chance of guessing correctly in 65 or more of 100 trials if the classmate was just guessing.
D) Yes, since 65% is greater than 50%.
Unlock Deck
Unlock for access to all 46 flashcards in this deck.
Unlock Deck
k this deck
Unlock Deck
Unlock for access to all 46 flashcards in this deck.


