Deck 6: Comparing Two Proportions
Full screen (f)
Question
Question
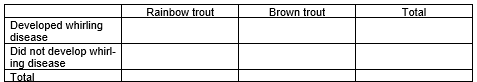
Whirling disease is a deadly disease that affects trout in Montana rivers. In a follow-up to a 2006 study conducted by the Montana Department of Fish, Wildlife and Parks (FWP), researchers sought to determine if the proportion of trout afflicted by whirling disease in the Gallatin river differs between rainbow trout and brown trout. To test this theory, researchers collected a representative sample of 527 rainbow trout and 459 brown trout. Of the 527 rainbow trout collected, 120 had developed whirling disease; of the 459 brown trout collected, 74 had developed whirling disease.
-Organize these data into a two-way table:
-Organize these data into a two-way table:
Question
Question
Question
Question
Question
Question
The Women's Health Study included 39,876 female health professionals aged 45 years and older who were followed for an average of 10 years (Ridker et al., 2005). At the beginning of the study, participants were randomly assigned to take either a daily low-dose aspirin or a daily placebo pill for the duration of the study. At the end of the study, researchers measured the number of participants that suffered from a heart attack during the study. Data are summarized in the following table. 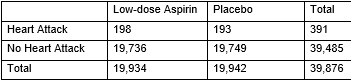
-Calculate the relative risk of heart attack for the low-dose aspirin group compared to the placebo group.
A) 1.026
B) 0.974
C) 0.00993
D) 0.000255
-Calculate the relative risk of heart attack for the low-dose aspirin group compared to the placebo group.
A) 1.026
B) 0.974
C) 0.00993
D) 0.000255
Question
The Women's Health Study included 39,876 female health professionals aged 45 years and older who were followed for an average of 10 years (Ridker et al., 2005). At the beginning of the study, participants were randomly assigned to take either a daily low-dose aspirin or a daily placebo pill for the duration of the study. At the end of the study, researchers measured the number of participants that suffered from a heart attack during the study. Data are summarized in the following table.
-Does there appear to be an association between whether a woman takes low-dose Aspirin or placebo and if she suffers from a heart attack in this sample?
A) No, since approximately the same number of women suffered from a heart attack in each group.
B) Yes, women who took low-dose Aspirin were less likely to suffer from a heart attack.
C) Yes, women who took low-dose Aspirin were more likely to suffer from a heart attack.
D) We cannot determine whether an association exists without a plot.
Question
The Women's Health Study included 39,876 female health professionals aged 45 years and older who were followed for an average of 10 years (Ridker et al., 2005). At the beginning of the study, participants were randomly assigned to take either a daily low-dose aspirin or a daily placebo pill for the duration of the study. At the end of the study, researchers measured the number of participants that suffered from a heart attack during the study. Data are summarized in the following table.
-What type of plot could be used to plot these data?
A) Scatterplot
B) Segmented bar chart
C) Dotplot
D) Histogram
-What type of plot could be used to plot these data?
A) Scatterplot
B) Segmented bar chart
C) Dotplot
D) Histogram
Question
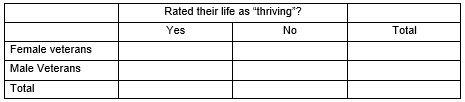
A Gallup poll headline from April 25, 2013, reads "In U.S., Women Veterans Rate Lives Better Than Men". In a random sample of 900 female veterans interviewed, 459 rated their lives as "thriving." Only 693 male veterans rated their lives as "thriving" in a random sample of size 1,650.
-Organize these data into a two-way table:
-Organize these data into a two-way table:
Question
Question
Question
Question
Question
The article "Freedom of What?" (Associated Press, February 1, 2005) described a study in which high school students and high school teachers were asked whether they agreed with the following statement: "Students should be allowed to report controversial issues in their student newspapers without the approval of school authorities." Researchers hypothesized that the long-run proportion of high school teachers who would agree with the statement would differ from the long-run proportion of high school students who would agree. Two random samples - 8,000 high school teachers and 10,000 high school students - were selected from high schools in the U.S. It was reported that 39% of the teachers surveyed and 58% of the students surveyed agreed with the statement.
-State the null and alternative hypotheses.
A) versus
B) versus
C) versus
D) versus
-State the null and alternative hypotheses.
A)
versus B)
versus C)
versus D)
versus Question
The article "Freedom of What?" (Associated Press, February 1, 2005) described a study in which high school students and high school teachers were asked whether they agreed with the following statement: "Students should be allowed to report controversial issues in their student newspapers without the approval of school authorities." Researchers hypothesized that the long-run proportion of high school teachers who would agree with the statement would differ from the long-run proportion of high school students who would agree. Two random samples - 8,000 high school teachers and 10,000 high school students - were selected from high schools in the U.S. It was reported that 39% of the teachers surveyed and 58% of the students surveyed agreed with the statement.
-What is the value of the statistic and its appropriate notation?
A)
B)
C)
D)
-What is the value of the statistic and its appropriate notation?
A)
B)
C)
D)
Question
The article "Freedom of What?" (Associated Press, February 1, 2005) described a study in which high school students and high school teachers were asked whether they agreed with the following statement: "Students should be allowed to report controversial issues in their student newspapers without the approval of school authorities." Researchers hypothesized that the long-run proportion of high school teachers who would agree with the statement would differ from the long-run proportion of high school students who would agree. Two random samples - 8,000 high school teachers and 10,000 high school students - were selected from high schools in the U.S. It was reported that 39% of the teachers surveyed and 58% of the students surveyed agreed with the statement.
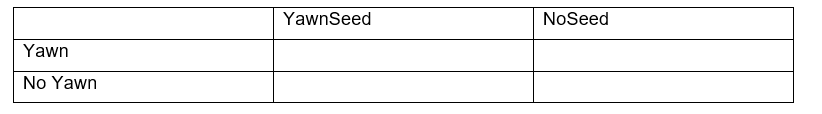
-Fill in the table below with the inputs to the
Two Proportion applet to conduct a simulation of the null hypothesis.
-Fill in the table below with the inputs to the
Two Proportion applet to conduct a simulation of the null hypothesis.
Question
Question
The article "Freedom of What?" (Associated Press, February 1, 2005) described a study in which high school students and high school teachers were asked whether they agreed with the following statement: "Students should be allowed to report controversial issues in their student newspapers without the approval of school authorities." Researchers hypothesized that the long-run proportion of high school teachers who would agree with the statement would differ from the long-run proportion of high school students who would agree. Two random samples - 8,000 high school teachers and 10,000 high school students - were selected from high schools in the U.S. It was reported that 39% of the teachers surveyed and 58% of the students surveyed agreed with the statement.
-A simulated null distribution of 1,000 differences in proportions created by using the Two Proportion applet is shown below.
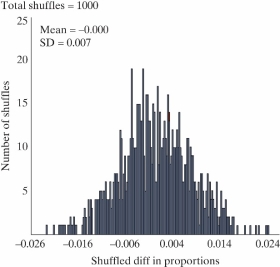 What is the strength of evidence against observed study results happening by chance alone?
A) Very strong
B) Moderate
C) Weak
D) We cannot determine the strength of evidence from this plot.
-A simulated null distribution of 1,000 differences in proportions created by using the Two Proportion applet is shown below.
What is the strength of evidence against observed study results happening by chance alone?A) Very strong
B) Moderate
C) Weak
D) We cannot determine the strength of evidence from this plot.
Question
The article "Freedom of What?" (Associated Press, February 1, 2005) described a study in which high school students and high school teachers were asked whether they agreed with the following statement: "Students should be allowed to report controversial issues in their student newspapers without the approval of school authorities." Researchers hypothesized that the long-run proportion of high school teachers who would agree with the statement would differ from the long-run proportion of high school students who would agree. Two random samples - 8,000 high school teachers and 10,000 high school students - were selected from high schools in the U.S. It was reported that 39% of the teachers surveyed and 58% of the students surveyed agreed with the statement.
-A simulated null distribution of 1,000 differences in proportions created by using the
Two Proportion applet is shown below.
 Use the 2SD method to find a 95% confidence interval for the difference in long-run proportion who would agree with the statement between Students and Teachers (Students - Teachers).
(____(1)____, ____(2)____)
-A simulated null distribution of 1,000 differences in proportions created by using the
Two Proportion applet is shown below.
Use the 2SD method to find a 95% confidence interval for the difference in long-run proportion who would agree with the statement between Students and Teachers (Students - Teachers).(____(1)____, ____(2)____)
Question
Question
To investigate biases against women in personnel decisions, psychologists performed a randomized experiment on 50 male bank supervisors attending a management institute who volunteered for the study. The supervisors were asked to make a decision on whether to promote a hypothetical applicant based on a personnel file. For 26 of them, the application file described a female candidate; for the others it described a male. The files were identical in all other respects. Results on the promotion decisions for the two groups are shown below. 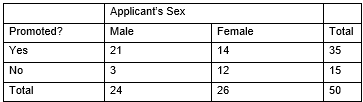
-What is the alternative hypothesis, in words?
A) There is no bias against women in personnel decisions.
B) There is a bias against women in personnel decisions.
-What is the alternative hypothesis, in words?
A) There is no bias against women in personnel decisions.
B) There is a bias against women in personnel decisions.
Question
To investigate biases against women in personnel decisions, psychologists performed a randomized experiment on 50 male bank supervisors attending a management institute who volunteered for the study. The supervisors were asked to make a decision on whether to promote a hypothetical applicant based on a personnel file. For 26 of them, the application file described a female candidate; for the others it described a male. The files were identical in all other respects. Results on the promotion decisions for the two groups are shown below.
-What is the value of the statistic and its appropriate notation?
A)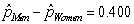
B)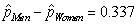
C)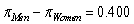
D)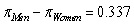
E)
-What is the value of the statistic and its appropriate notation?
A)
B)
C)
D)
E)
Question
To investigate biases against women in personnel decisions, psychologists performed a randomized experiment on 50 male bank supervisors attending a management institute who volunteered for the study. The supervisors were asked to make a decision on whether to promote a hypothetical applicant based on a personnel file. For 26 of them, the application file described a female candidate; for the others it described a male. The files were identical in all other respects. Results on the promotion decisions for the two groups are shown below.
-The standardized statistic for this study is 2.59. How would you interpret this value?
A) The sample proportion of men promoted is 2.59 standard deviations above the sample proportion of women promoted.
B) The sample difference in proportion promoted between men and women (men - women) is 2.59 standard deviations above zero.
C) On average, sample differences in proportion promoted between men and women (men - women) are 2.59 standard deviations from zero.
D) There is a 2.59% chance of seeing a sample difference in proportion promoted between men and women (men - women) of the one observed or greater.
Question
To investigate biases against women in personnel decisions, psychologists performed a randomized experiment on 50 male bank supervisors attending a management institute who volunteered for the study. The supervisors were asked to make a decision on whether to promote a hypothetical applicant based on a personnel file. For 26 of them, the application file described a female candidate; for the others it described a male. The files were identical in all other respects. Results on the promotion decisions for the two groups are shown below.
-The p-value for this study is 0.009. How would you interpret this value?
A) There is a 0.9% probability that there is no bias against women in personnel decisions.
B) There is a 0.9% probability that there is a bias against women in personnel decisions.
C) If there were no bias against women in personnel decisions, there is a 0.9% probability of seeing a sample difference in proportion promoted between men and women (men - women) of 0.337 or greater.
D) If there were a bias against women in personnel decisions, there is a 0.9% probability of seeing a sample difference in proportion promoted between men and women (men - women) of 0.337 or greater.
Question
To investigate biases against women in personnel decisions, psychologists performed a randomized experiment on 50 male bank supervisors attending a management institute who volunteered for the study. The supervisors were asked to make a decision on whether to promote a hypothetical applicant based on a personnel file. For 26 of them, the application file described a female candidate; for the others it described a male. The files were identical in all other respects. Results on the promotion decisions for the two groups are shown below.
-The standardized statistic for this study is 2.59, and the p-value is 0.009. State a conclusion of the test in context of the problem.
A) We do not have significant evidence that the probability an applicant is promoted is higher for women than for men.
B) We do not have significant evidence that the probability an applicant is promoted is higher for men than for women.
C) We have significant evidence that the probability an applicant is promoted is higher for women than for men.
D) We have significant evidence that the probability an applicant is promoted is higher for men than for women.
Question
To investigate biases against women in personnel decisions, psychologists performed a randomized experiment on 50 male bank supervisors attending a management institute who volunteered for the study. The supervisors were asked to make a decision on whether to promote a hypothetical applicant based on a personnel file. For 26 of them, the application file described a female candidate; for the others it described a male. The files were identical in all other respects. Results on the promotion decisions for the two groups are shown below.
-Based on the study design, what is the scope of inference for these results?
A) The sex of an applicant causes a difference in the probability of being promoted by individuals similar to those in the study.
B) The sex of an applicant causes a difference in the probability of being promoted by all male bank supervisors attending a management institute.
C) The sex of an applicant is associated with whether or not the individual is promoted by individuals similar to those in the study.
D) The sex of an applicant is associated with whether or not the individual is promoted by all male bank supervisors attending a management institute.
Question
Question
Question
Question
The Women's Health Study included 39,876 female health professionals aged 45 years and older who were followed for an average of 10 years (Ridker et al., 2005). At the beginning of the study, participants were randomly assigned to take either a daily low-dose aspirin or a daily placebo pill for the duration of the study. At the end of the study, researchers measured the number of participants that suffered from a heart attack during the study. Data are summarized in the following table. 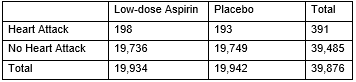
-Is a theory-based approach appropriate to evaluate the relationship between whether an individual took aspirin or a placebo and whether an individual suffers a heart attack?
A) No, since a simulation-based approach is always appropriate.
B) Yes, since 39,876 is larger than 20.
C) Yes, since 391 and 39,485 are both greater than 10.
D) Yes, since 198, 193, 19,736, 19,749 are all greater than 10.
Question
The Women's Health Study included 39,876 female health professionals aged 45 years and older who were followed for an average of 10 years (Ridker et al., 2005). At the beginning of the study, participants were randomly assigned to take either a daily low-dose aspirin or a daily placebo pill for the duration of the study. At the end of the study, researchers measured the number of participants that suffered from a heart attack during the study. Data are summarized in the following table.
-Use the Theory-Based Inference applet to find a 90% confidence interval for the difference in probability of suffering a heart attack between the two groups (aspirin - placebo).
(___(1)___, ___(2)___)
-Use the Theory-Based Inference applet to find a 90% confidence interval for the difference in probability of suffering a heart attack between the two groups (aspirin - placebo).
(___(1)___, ___(2)___)
Question
The Women's Health Study included 39,876 female health professionals aged 45 years and older who were followed for an average of 10 years (Ridker et al., 2005). At the beginning of the study, participants were randomly assigned to take either a daily low-dose aspirin or a daily placebo pill for the duration of the study. At the end of the study, researchers measured the number of participants that suffered from a heart attack during the study. Data are summarized in the following table.
-Based off of your confidence interval in question 33, what could you say for sure about the p-value for testing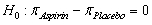 versus
  ?
?
A) p-value < 0.01
B) p-value < 0.05
C) p-value < 0.10
D) p-value > 0.10
-Based off of your confidence interval in question 33, what could you say for sure about the p-value for testing
versus ? A) p-value < 0.01
B) p-value < 0.05
C) p-value < 0.10
D) p-value > 0.10
Question
The Women's Health Study included 39,876 female health professionals aged 45 years and older who were followed for an average of 10 years (Ridker et al., 2005). At the beginning of the study, participants were randomly assigned to take either a daily low-dose aspirin or a daily placebo pill for the duration of the study. At the end of the study, researchers measured the number of participants that suffered from a heart attack during the study. Data are summarized in the following table.
-If we had calculated a 95% confidence interval in question 33 rather than a 90% confidence interval, all else being equal, would the resulting interval be wider, narrower, or the same width?
A) Wider
B) Narrower
C) Same width
-If we had calculated a 95% confidence interval in question 33 rather than a 90% confidence interval, all else being equal, would the resulting interval be wider, narrower, or the same width?
A) Wider
B) Narrower
C) Same width
Question
The Women's Health Study included 39,876 female health professionals aged 45 years and older who were followed for an average of 10 years (Ridker et al., 2005). At the beginning of the study, participants were randomly assigned to take either a daily low-dose aspirin or a daily placebo pill for the duration of the study. At the end of the study, researchers measured the number of participants that suffered from a heart attack during the study. Data are summarized in the following table.
-If our sample size had been 10,000 rather than 39,876, all else being equal, would the 90% confidence interval be wider, narrower, or the same width as the one found in question 33?
A) Wider
B) Narrower
C) Same width
-If our sample size had been 10,000 rather than 39,876, all else being equal, would the 90% confidence interval be wider, narrower, or the same width as the one found in question 33?
A) Wider
B) Narrower
C) Same width
Question
Question
A 2003 study reported in the Journal of Consumer Affairs examined how well consumers protect themselves from identity theft. The study surveyed a random sample of 61 college students and 59 non-students, and asked each participant, "Have you used personal information (such as birth date, pet name, etc.) when creating a password?" For the students, 22 agreed with this statement, while 30 of the non-students agreed.
-Is a theory-based approach appropriate to test versus
 ?
?
A) No, since a simulation-based approach is always appropriate.
B) Yes, since 120 is larger than 20.
C) Yes, since 61 and 59 are both greater than 20.
D) Yes, since at least 10 people agreed and at least 10 people disagreed in each sample.
-Is a theory-based approach appropriate to test versus
? A) No, since a simulation-based approach is always appropriate.
B) Yes, since 120 is larger than 20.
C) Yes, since 61 and 59 are both greater than 20.
D) Yes, since at least 10 people agreed and at least 10 people disagreed in each sample.
Question
A 2003 study reported in the Journal of Consumer Affairs examined how well consumers protect themselves from identity theft. The study surveyed a random sample of 61 college students and 59 non-students, and asked each participant, "Have you used personal information (such as birth date, pet name, etc.) when creating a password?" For the students, 22 agreed with this statement, while 30 of the non-students agreed.
-Use the Theory-Based Inference applet to find the p-value for a test of test versus
A) p-value = 0.0512
B) p-value = 0.1023
C) p-value = 0.1480
D) p-value = 0.9488
-Use the Theory-Based Inference applet to find the p-value for a test of test
versus A) p-value = 0.0512
B) p-value = 0.1023
C) p-value = 0.1480
D) p-value = 0.9488
Question
Question
Question
Question
Question
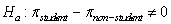
Hepatitis C is a blood-born viral infection that causes liver inflammation and infection that, over time, can lead to liver disease. There is no vaccine against this strain of hepatitis, so preventive measures are the only management techniques. One of the ways hepatitis can be transmitted is by use of improperly sterilized tattoo equipment or contaminated dyes, which in turn has led to more stringent sterilization requirements for commercial tattoo parlors. Researchers at the University of Texas Southwestern Medical Center examined the medical records of 113 patients who had a tattoo to see whether these sterilization requirements at commercial parlors are reducing the proportion of hepatitis C among those with tattoos, compared to those who get tattoos elsewhere. Data are summarized in the following table. 
-Is a theory-based approach appropriate to evaluate the relationship between the incidence of hepatitis C and the type of tattoo parlor?
A) No, since the number with hepatitis C in each group is less than 20.
B) Yes, since 113 is larger than 20.
C) Yes, since 70 and 43 are both greater than 20.
D) Yes, since 10, 15, 60, 28 are all at least 10.
Question
Hepatitis C is a blood-born viral infection that causes liver inflammation and infection that, over time, can lead to liver disease. There is no vaccine against this strain of hepatitis, so preventive measures are the only management techniques. One of the ways hepatitis can be transmitted is by use of improperly sterilized tattoo equipment or contaminated dyes, which in turn has led to more stringent sterilization requirements for commercial tattoo parlors. Researchers at the University of Texas Southwestern Medical Center examined the medical records of 113 patients who had a tattoo to see whether these sterilization requirements at commercial parlors are reducing the proportion of hepatitis C among those with tattoos, compared to those who get tattoos elsewhere. Data are summarized in the following table.
-Use the Theory-Based Inference applet to find the p-value for a test of test .
 versus
A) p-value = 0.0104
B) p-value = 0.0052
C) p-value = 0.2060
D) p-value = 0.9948
-Use the Theory-Based Inference applet to find the p-value for a test of test .
versus A) p-value = 0.0104
B) p-value = 0.0052
C) p-value = 0.2060
D) p-value = 0.9948
Question
Hepatitis C is a blood-born viral infection that causes liver inflammation and infection that, over time, can lead to liver disease. There is no vaccine against this strain of hepatitis, so preventive measures are the only management techniques. One of the ways hepatitis can be transmitted is by use of improperly sterilized tattoo equipment or contaminated dyes, which in turn has led to more stringent sterilization requirements for commercial tattoo parlors. Researchers at the University of Texas Southwestern Medical Center examined the medical records of 113 patients who had a tattoo to see whether these sterilization requirements at commercial parlors are reducing the proportion of hepatitis C among those with tattoos, compared to those who get tattoos elsewhere. Data are summarized in the following table.
-Use the
Theory-Based Inference applet to find a 95% confidence interval for the difference in probability of developing hepatitis C between the two types of parlors (commercial - elsewhere).
(___(1)___, ___(2)___)
-Use the
Theory-Based Inference applet to find a 95% confidence interval for the difference in probability of developing hepatitis C between the two types of parlors (commercial - elsewhere).
(___(1)___, ___(2)___)

Unlock Deck
Sign up to unlock the cards in this deck!
Unlock Deck
Unlock Deck
1/46
Play
Full screen (f)
Deck 6: Comparing Two Proportions
1
Whirling disease is a deadly disease that affects trout in Montana rivers. In a follow-up to a 2006 study conducted by the Montana Department of Fish, Wildlife and Parks (FWP), researchers sought to determine if the proportion of trout afflicted by whirling disease in the Gallatin river differs between rainbow trout and brown trout. To test this theory, researchers collected a representative sample of 527 rainbow trout and 459 brown trout. Of the 527 rainbow trout collected, 120 had developed whirling disease; of the 459 brown trout collected, 74 had developed whirling disease.
-Identify the explanatory and response variables, and their types by filling in the blanks below:
The type of trout (rainbow or brown) is the ___(1)___ (explanatory/response) variable and it is ___(2)___ (categorical/quantitative).
Whether or not the trout developed whirling disease is the ___(3)___ (explanatory/response) variable and it is ___(4)___ (categorical/quantitative).
(1) explanatory; (2) categorical; (3) response; (4) categorical.
2
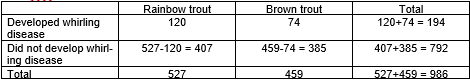
Whirling disease is a deadly disease that affects trout in Montana rivers. In a follow-up to a 2006 study conducted by the Montana Department of Fish, Wildlife and Parks (FWP), researchers sought to determine if the proportion of trout afflicted by whirling disease in the Gallatin river differs between rainbow trout and brown trout. To test this theory, researchers collected a representative sample of 527 rainbow trout and 459 brown trout. Of the 527 rainbow trout collected, 120 had developed whirling disease; of the 459 brown trout collected, 74 had developed whirling disease.
-Organize these data into a two-way table:
-Organize these data into a two-way table:
3
Whirling disease is a deadly disease that affects trout in Montana rivers. In a follow-up to a 2006 study conducted by the Montana Department of Fish, Wildlife and Parks (FWP), researchers sought to determine if the proportion of trout afflicted by whirling disease in the Gallatin river differs between rainbow trout and brown trout. To test this theory, researchers collected a representative sample of 527 rainbow trout and 459 brown trout. Of the 527 rainbow trout collected, 120 had developed whirling disease; of the 459 brown trout collected, 74 had developed whirling disease.
-Which of the following plots would be most appropriate to examine the association between the explanatory and response variables?
A) Segmented bar chart
B) Scatterplot
C) Mosaic plot
D) Segmented bar chart or mosaic plot
-Which of the following plots would be most appropriate to examine the association between the explanatory and response variables?
A) Segmented bar chart
B) Scatterplot
C) Mosaic plot
D) Segmented bar chart or mosaic plot
Segmented bar chart or mosaic plot
4
Whirling disease is a deadly disease that affects trout in Montana rivers. In a follow-up to a 2006 study conducted by the Montana Department of Fish, Wildlife and Parks (FWP), researchers sought to determine if the proportion of trout afflicted by whirling disease in the Gallatin river differs between rainbow trout and brown trout. To test this theory, researchers collected a representative sample of 527 rainbow trout and 459 brown trout. Of the 527 rainbow trout collected, 120 had developed whirling disease; of the 459 brown trout collected, 74 had developed whirling disease.
-Calculate the conditional proportion of trout that developed whirling disease for each species (rainbow or brown):
Rainbow: ___ (1) ___
Brown: ___(2) ___
-Calculate the conditional proportion of trout that developed whirling disease for each species (rainbow or brown):
Rainbow: ___ (1) ___
Brown: ___(2) ___
Unlock Deck
Unlock for access to all 46 flashcards in this deck.
Unlock Deck
k this deck
5
Whirling disease is a deadly disease that affects trout in Montana rivers. In a follow-up to a 2006 study conducted by the Montana Department of Fish, Wildlife and Parks (FWP), researchers sought to determine if the proportion of trout afflicted by whirling disease in the Gallatin river differs between rainbow trout and brown trout. To test this theory, researchers collected a representative sample of 527 rainbow trout and 459 brown trout. Of the 527 rainbow trout collected, 120 had developed whirling disease; of the 459 brown trout collected, 74 had developed whirling disease.
-Based on the conditional proportions found in question 4, does it appear that whether a trout develops whirling disease is associated with the species of trout (rainbow or brown)?
A) No, since there were approximately the same number of trout in each species.
B) Yes, since the number of trout who developed whirling disease differed from the number of trout who did not develop whirling disease.
C) Yes, since the conditional proportion of trout that developed the disease differed between rainbow and brown trout.
D) Yes, since the proportion of trout that developed the disease was not equal to 0.5.
Unlock Deck
Unlock for access to all 46 flashcards in this deck.
Unlock Deck
k this deck
6
Whirling disease is a deadly disease that affects trout in Montana rivers. In a follow-up to a 2006 study conducted by the Montana Department of Fish, Wildlife and Parks (FWP), researchers sought to determine if the proportion of trout afflicted by whirling disease in the Gallatin river differs between rainbow trout and brown trout. To test this theory, researchers collected a representative sample of 527 rainbow trout and 459 brown trout. Of the 527 rainbow trout collected, 120 had developed whirling disease; of the 459 brown trout collected, 74 had developed whirling disease.
-Calculate the relative risk of whirling disease for rainbow trout compared to brown trout in this sample.
-Calculate the relative risk of whirling disease for rainbow trout compared to brown trout in this sample.
Unlock Deck
Unlock for access to all 46 flashcards in this deck.
Unlock Deck
k this deck
7
Whirling disease is a deadly disease that affects trout in Montana rivers. In a follow-up to a 2006 study conducted by the Montana Department of Fish, Wildlife and Parks (FWP), researchers sought to determine if the proportion of trout afflicted by whirling disease in the Gallatin river differs between rainbow trout and brown trout. To test this theory, researchers collected a representative sample of 527 rainbow trout and 459 brown trout. Of the 527 rainbow trout collected, 120 had developed whirling disease; of the 459 brown trout collected, 74 had developed whirling disease.
-Based on the relative risk found in question 6, does it appear that whether a trout develops whirling disease is associated with the species of trout (rainbow or brown)?
A) Yes, since the relative risk differs from zero.
B) Yes, since the relative risk differs from one.
C) No, since the relative risk differs from zero.
D) No, since the relative risk differs from one.
Unlock Deck
Unlock for access to all 46 flashcards in this deck.
Unlock Deck
k this deck
8
The Women's Health Study included 39,876 female health professionals aged 45 years and older who were followed for an average of 10 years (Ridker et al., 2005). At the beginning of the study, participants were randomly assigned to take either a daily low-dose aspirin or a daily placebo pill for the duration of the study. At the end of the study, researchers measured the number of participants that suffered from a heart attack during the study. Data are summarized in the following table.
-Calculate the relative risk of heart attack for the low-dose aspirin group compared to the placebo group.
A) 1.026
B) 0.974
C) 0.00993
D) 0.000255
-Calculate the relative risk of heart attack for the low-dose aspirin group compared to the placebo group.
A) 1.026
B) 0.974
C) 0.00993
D) 0.000255
Unlock Deck
Unlock for access to all 46 flashcards in this deck.
Unlock Deck
k this deck
9
The Women's Health Study included 39,876 female health professionals aged 45 years and older who were followed for an average of 10 years (Ridker et al., 2005). At the beginning of the study, participants were randomly assigned to take either a daily low-dose aspirin or a daily placebo pill for the duration of the study. At the end of the study, researchers measured the number of participants that suffered from a heart attack during the study. Data are summarized in the following table.
-Does there appear to be an association between whether a woman takes low-dose Aspirin or placebo and if she suffers from a heart attack in this sample?
A) No, since approximately the same number of women suffered from a heart attack in each group.
B) Yes, women who took low-dose Aspirin were less likely to suffer from a heart attack.
C) Yes, women who took low-dose Aspirin were more likely to suffer from a heart attack.
D) We cannot determine whether an association exists without a plot.
Unlock Deck
Unlock for access to all 46 flashcards in this deck.
Unlock Deck
k this deck
10
The Women's Health Study included 39,876 female health professionals aged 45 years and older who were followed for an average of 10 years (Ridker et al., 2005). At the beginning of the study, participants were randomly assigned to take either a daily low-dose aspirin or a daily placebo pill for the duration of the study. At the end of the study, researchers measured the number of participants that suffered from a heart attack during the study. Data are summarized in the following table.
-What type of plot could be used to plot these data?
A) Scatterplot
B) Segmented bar chart
C) Dotplot
D) Histogram
-What type of plot could be used to plot these data?
A) Scatterplot
B) Segmented bar chart
C) Dotplot
D) Histogram
Unlock Deck
Unlock for access to all 46 flashcards in this deck.
Unlock Deck
k this deck
11
A Gallup poll headline from April 25, 2013, reads "In U.S., Women Veterans Rate Lives Better Than Men". In a random sample of 900 female veterans interviewed, 459 rated their lives as "thriving." Only 693 male veterans rated their lives as "thriving" in a random sample of size 1,650.
-Organize these data into a two-way table:
-Organize these data into a two-way table:
Unlock Deck
Unlock for access to all 46 flashcards in this deck.
Unlock Deck
k this deck
12
A Gallup poll headline from April 25, 2013, reads "In U.S., Women Veterans Rate Lives Better Than Men". In a random sample of 900 female veterans interviewed, 459 rated their lives as "thriving." Only 693 male veterans rated their lives as "thriving" in a random sample of size 1,650.
-For each sample (females and males), calculate the sample proportion who rated their lives as "thriving."
Females: ________
Males:________
-For each sample (females and males), calculate the sample proportion who rated their lives as "thriving."
Females: ________
Males:________
Unlock Deck
Unlock for access to all 46 flashcards in this deck.
Unlock Deck
k this deck
13
A Gallup poll headline from April 25, 2013, reads "In U.S., Women Veterans Rate Lives Better Than Men". In a random sample of 900 female veterans interviewed, 459 rated their lives as "thriving." Only 693 male veterans rated their lives as "thriving" in a random sample of size 1,650.
-The relative risk of a "thriving" life rating for female veterans compared to male veterans is 1.214. How would you interpret this value?
A) The chance a female veteran rated her life as "thriving" is about 21% lower than the chance a male veteran rated his life as "thriving."
B) The chance a female veteran rated her life as "thriving" is about 21% higher than the chance a male veteran rated his life as "thriving."
C) The chance a female veteran rated her life as "thriving" is about 121% lower than the chance a male veteran rated his life as "thriving."
D) The chance a female veteran rated her life as "thriving" is about 121% higher than the chance a male veteran rated his life as "thriving."
Unlock Deck
Unlock for access to all 46 flashcards in this deck.
Unlock Deck
k this deck
14
An advertisement for Claritin, a drug for seasonal nasal allergies, made this claim: "Clear relief without drowsiness. In studies, the incidence of drowsiness was similar to placebo" (Time, February 6, 1995, p. 43). The advertisement also reported that 8% of the 1,926 Claritin takers and 6% of the 2,545 placebo takers reported drowsiness as a side effect.
-Does there appear to be an association between whether one takes Claritin or a placebo and the development of drowsiness in this sample?
A) Yes, since 1,926 differs from 2,545.
B) Yes, since 8% differs from 6%.
C) No, since the sample size was not large enough.
D) No, since the claim stated the incidence of drowsiness when taking Claritin was similar to that when taking a placebo.
Unlock Deck
Unlock for access to all 46 flashcards in this deck.
Unlock Deck
k this deck
15
An advertisement for Claritin, a drug for seasonal nasal allergies, made this claim: "Clear relief without drowsiness. In studies, the incidence of drowsiness was similar to placebo" (Time, February 6, 1995, p. 43). The advertisement also reported that 8% of the 1,926 Claritin takers and 6% of the 2,545 placebo takers reported drowsiness as a side effect.
-Calculate the relative risk of drowsiness for Claritin users compared to placebo.
A) 0.02
B) 1.02
C) 0.75
D) 1.33
-Calculate the relative risk of drowsiness for Claritin users compared to placebo.
A) 0.02
B) 1.02
C) 0.75
D) 1.33
Unlock Deck
Unlock for access to all 46 flashcards in this deck.
Unlock Deck
k this deck
16
The article "Freedom of What?" (Associated Press, February 1, 2005) described a study in which high school students and high school teachers were asked whether they agreed with the following statement: "Students should be allowed to report controversial issues in their student newspapers without the approval of school authorities." Researchers hypothesized that the long-run proportion of high school teachers who would agree with the statement would differ from the long-run proportion of high school students who would agree. Two random samples - 8,000 high school teachers and 10,000 high school students - were selected from high schools in the U.S. It was reported that 39% of the teachers surveyed and 58% of the students surveyed agreed with the statement.
-State the null and alternative hypotheses.
A) versus
B) versus
C) versus
D) versus
-State the null and alternative hypotheses.
A)
versus B)
versus C)
versus D)
versus Unlock Deck
Unlock for access to all 46 flashcards in this deck.
Unlock Deck
k this deck
17
The article "Freedom of What?" (Associated Press, February 1, 2005) described a study in which high school students and high school teachers were asked whether they agreed with the following statement: "Students should be allowed to report controversial issues in their student newspapers without the approval of school authorities." Researchers hypothesized that the long-run proportion of high school teachers who would agree with the statement would differ from the long-run proportion of high school students who would agree. Two random samples - 8,000 high school teachers and 10,000 high school students - were selected from high schools in the U.S. It was reported that 39% of the teachers surveyed and 58% of the students surveyed agreed with the statement.
-What is the value of the statistic and its appropriate notation?
A)
B)
C)
D)
-What is the value of the statistic and its appropriate notation?
A)
B)
C)
D)
Unlock Deck
Unlock for access to all 46 flashcards in this deck.
Unlock Deck
k this deck
18
The article "Freedom of What?" (Associated Press, February 1, 2005) described a study in which high school students and high school teachers were asked whether they agreed with the following statement: "Students should be allowed to report controversial issues in their student newspapers without the approval of school authorities." Researchers hypothesized that the long-run proportion of high school teachers who would agree with the statement would differ from the long-run proportion of high school students who would agree. Two random samples - 8,000 high school teachers and 10,000 high school students - were selected from high schools in the U.S. It was reported that 39% of the teachers surveyed and 58% of the students surveyed agreed with the statement.
-Fill in the table below with the inputs to the
Two Proportion applet to conduct a simulation of the null hypothesis.
-Fill in the table below with the inputs to the
Two Proportion applet to conduct a simulation of the null hypothesis.
Unlock Deck
Unlock for access to all 46 flashcards in this deck.
Unlock Deck
k this deck
19
The article "Freedom of What?" (Associated Press, February 1, 2005) described a study in which high school students and high school teachers were asked whether they agreed with the following statement: "Students should be allowed to report controversial issues in their student newspapers without the approval of school authorities." Researchers hypothesized that the long-run proportion of high school teachers who would agree with the statement would differ from the long-run proportion of high school students who would agree. Two random samples - 8,000 high school teachers and 10,000 high school students - were selected from high schools in the U.S. It was reported that 39% of the teachers surveyed and 58% of the students surveyed agreed with the statement.
-Describe how you could use cards to simulate a single sample statistic in the null distribution.
A) Take 8,000 red cards and 10,000 blue cards. Shuffle the cards together, then deal the cards into two piles - one of size 8,000 and one of size 10,000. Compute the difference in the proportion of red cards between the two piles.
B) Take 8,000 red cards and 10,000 blue cards. Shuffle the cards together, then deal the cards into two piles - one of size 3,120 and one of size 5,800. Compute the difference in the proportion of red cards between the two piles.
C) Take 8,920 red cards and 9,080 blue cards. Shuffle the cards together, then deal the cards into two piles - one of size 8,000 and one of size 10,000. Compute the difference in the proportion of red cards between the two piles.
D) Take 8,920 red cards and 9,080 blue cards. Shuffle the cards together, then deal the cards into two piles - one of size 4,640 and one of size 3,900. Compute the difference in the proportion of red cards between the two piles.
Unlock Deck
Unlock for access to all 46 flashcards in this deck.
Unlock Deck
k this deck
20
The article "Freedom of What?" (Associated Press, February 1, 2005) described a study in which high school students and high school teachers were asked whether they agreed with the following statement: "Students should be allowed to report controversial issues in their student newspapers without the approval of school authorities." Researchers hypothesized that the long-run proportion of high school teachers who would agree with the statement would differ from the long-run proportion of high school students who would agree. Two random samples - 8,000 high school teachers and 10,000 high school students - were selected from high schools in the U.S. It was reported that 39% of the teachers surveyed and 58% of the students surveyed agreed with the statement.
-A simulated null distribution of 1,000 differences in proportions created by using the Two Proportion applet is shown below.
What is the strength of evidence against observed study results happening by chance alone?
A) Very strong
B) Moderate
C) Weak
D) We cannot determine the strength of evidence from this plot.
-A simulated null distribution of 1,000 differences in proportions created by using the Two Proportion applet is shown below.
What is the strength of evidence against observed study results happening by chance alone?A) Very strong
B) Moderate
C) Weak
D) We cannot determine the strength of evidence from this plot.
Unlock Deck
Unlock for access to all 46 flashcards in this deck.
Unlock Deck
k this deck
21
The article "Freedom of What?" (Associated Press, February 1, 2005) described a study in which high school students and high school teachers were asked whether they agreed with the following statement: "Students should be allowed to report controversial issues in their student newspapers without the approval of school authorities." Researchers hypothesized that the long-run proportion of high school teachers who would agree with the statement would differ from the long-run proportion of high school students who would agree. Two random samples - 8,000 high school teachers and 10,000 high school students - were selected from high schools in the U.S. It was reported that 39% of the teachers surveyed and 58% of the students surveyed agreed with the statement.
-A simulated null distribution of 1,000 differences in proportions created by using the
Two Proportion applet is shown below.
Use the 2SD method to find a 95% confidence interval for the difference in long-run proportion who would agree with the statement between Students and Teachers (Students - Teachers).
(____(1)____, ____(2)____)
-A simulated null distribution of 1,000 differences in proportions created by using the
Two Proportion applet is shown below.
Use the 2SD method to find a 95% confidence interval for the difference in long-run proportion who would agree with the statement between Students and Teachers (Students - Teachers).(____(1)____, ____(2)____)
Unlock Deck
Unlock for access to all 46 flashcards in this deck.
Unlock Deck
k this deck
22
The article "Freedom of What?" (Associated Press, February 1, 2005) described a study in which high school students and high school teachers were asked whether they agreed with the following statement: "Students should be allowed to report controversial issues in their student newspapers without the approval of school authorities." Researchers hypothesized that the long-run proportion of high school teachers who would agree with the statement would differ from the long-run proportion of high school students who would agree. Two random samples - 8,000 high school teachers and 10,000 high school students - were selected from high schools in the U.S. It was reported that 39% of the teachers surveyed and 58% of the students surveyed agreed with the statement.
-The study concluded that "in the U.S., a higher percentage of high school students believe controversial issues should be reported without approval of school authorities than high school teachers." Is this conclusion justified?
A) No, since we did not survey all high school students and high school teachers in the U.S.
B) Yes, because the sample sizes were large.
C) No, because the 2SD 95% confidence interval for the difference in long-run proportion who would agree with the statement between Students and Teachers (Students - Teachers) is entirely greater than zero.
D) Yes, because the 2SD 95% confidence interval for the difference in long-run proportion who would agree with the statement between Students and Teachers (Students - Teachers) is entirely greater than zero.
Unlock Deck
Unlock for access to all 46 flashcards in this deck.
Unlock Deck
k this deck
23
To investigate biases against women in personnel decisions, psychologists performed a randomized experiment on 50 male bank supervisors attending a management institute who volunteered for the study. The supervisors were asked to make a decision on whether to promote a hypothetical applicant based on a personnel file. For 26 of them, the application file described a female candidate; for the others it described a male. The files were identical in all other respects. Results on the promotion decisions for the two groups are shown below.
-What is the alternative hypothesis, in words?
A) There is no bias against women in personnel decisions.
B) There is a bias against women in personnel decisions.
-What is the alternative hypothesis, in words?
A) There is no bias against women in personnel decisions.
B) There is a bias against women in personnel decisions.
Unlock Deck
Unlock for access to all 46 flashcards in this deck.
Unlock Deck
k this deck
24
To investigate biases against women in personnel decisions, psychologists performed a randomized experiment on 50 male bank supervisors attending a management institute who volunteered for the study. The supervisors were asked to make a decision on whether to promote a hypothetical applicant based on a personnel file. For 26 of them, the application file described a female candidate; for the others it described a male. The files were identical in all other respects. Results on the promotion decisions for the two groups are shown below.
-What is the value of the statistic and its appropriate notation?
A)
B)
C)
D)
E)
-What is the value of the statistic and its appropriate notation?
A)
B)
C)
D)
E)
Unlock Deck
Unlock for access to all 46 flashcards in this deck.
Unlock Deck
k this deck
25
To investigate biases against women in personnel decisions, psychologists performed a randomized experiment on 50 male bank supervisors attending a management institute who volunteered for the study. The supervisors were asked to make a decision on whether to promote a hypothetical applicant based on a personnel file. For 26 of them, the application file described a female candidate; for the others it described a male. The files were identical in all other respects. Results on the promotion decisions for the two groups are shown below.
-The standardized statistic for this study is 2.59. How would you interpret this value?
A) The sample proportion of men promoted is 2.59 standard deviations above the sample proportion of women promoted.
B) The sample difference in proportion promoted between men and women (men - women) is 2.59 standard deviations above zero.
C) On average, sample differences in proportion promoted between men and women (men - women) are 2.59 standard deviations from zero.
D) There is a 2.59% chance of seeing a sample difference in proportion promoted between men and women (men - women) of the one observed or greater.
Unlock Deck
Unlock for access to all 46 flashcards in this deck.
Unlock Deck
k this deck
26
To investigate biases against women in personnel decisions, psychologists performed a randomized experiment on 50 male bank supervisors attending a management institute who volunteered for the study. The supervisors were asked to make a decision on whether to promote a hypothetical applicant based on a personnel file. For 26 of them, the application file described a female candidate; for the others it described a male. The files were identical in all other respects. Results on the promotion decisions for the two groups are shown below.
-The p-value for this study is 0.009. How would you interpret this value?
A) There is a 0.9% probability that there is no bias against women in personnel decisions.
B) There is a 0.9% probability that there is a bias against women in personnel decisions.
C) If there were no bias against women in personnel decisions, there is a 0.9% probability of seeing a sample difference in proportion promoted between men and women (men - women) of 0.337 or greater.
D) If there were a bias against women in personnel decisions, there is a 0.9% probability of seeing a sample difference in proportion promoted between men and women (men - women) of 0.337 or greater.
Unlock Deck
Unlock for access to all 46 flashcards in this deck.
Unlock Deck
k this deck
27
To investigate biases against women in personnel decisions, psychologists performed a randomized experiment on 50 male bank supervisors attending a management institute who volunteered for the study. The supervisors were asked to make a decision on whether to promote a hypothetical applicant based on a personnel file. For 26 of them, the application file described a female candidate; for the others it described a male. The files were identical in all other respects. Results on the promotion decisions for the two groups are shown below.
-The standardized statistic for this study is 2.59, and the p-value is 0.009. State a conclusion of the test in context of the problem.
A) We do not have significant evidence that the probability an applicant is promoted is higher for women than for men.
B) We do not have significant evidence that the probability an applicant is promoted is higher for men than for women.
C) We have significant evidence that the probability an applicant is promoted is higher for women than for men.
D) We have significant evidence that the probability an applicant is promoted is higher for men than for women.
Unlock Deck
Unlock for access to all 46 flashcards in this deck.
Unlock Deck
k this deck
28
To investigate biases against women in personnel decisions, psychologists performed a randomized experiment on 50 male bank supervisors attending a management institute who volunteered for the study. The supervisors were asked to make a decision on whether to promote a hypothetical applicant based on a personnel file. For 26 of them, the application file described a female candidate; for the others it described a male. The files were identical in all other respects. Results on the promotion decisions for the two groups are shown below.
-Based on the study design, what is the scope of inference for these results?
A) The sex of an applicant causes a difference in the probability of being promoted by individuals similar to those in the study.
B) The sex of an applicant causes a difference in the probability of being promoted by all male bank supervisors attending a management institute.
C) The sex of an applicant is associated with whether or not the individual is promoted by individuals similar to those in the study.
D) The sex of an applicant is associated with whether or not the individual is promoted by all male bank supervisors attending a management institute.
Unlock Deck
Unlock for access to all 46 flashcards in this deck.
Unlock Deck
k this deck
29
The p-value for a test of two proportions is the probability that the two long-run proportions are equal.
Unlock Deck
Unlock for access to all 46 flashcards in this deck.
Unlock Deck
k this deck
30
A simulated null distribution of a difference in sample proportions will be centered at the value of the difference in proportions in the observed data.
Unlock Deck
Unlock for access to all 46 flashcards in this deck.
Unlock Deck
k this deck
31
A Gallup poll headline from April 25, 2013, reads "In U.S., Women Veterans Rate Lives Better Than Men". In a random sample of 900 female veterans interviewed, 459 rated their lives as "thriving." Only 693 male veterans rated their lives as "thriving" in a random sample of size 1,650. What is the null hypothesis if researchers are interested in determining if the long-run proportion who would rate their lives as thriving differs between women and men?
A) There is an association between sex and whether a person would rate their life as thriving.
B) There is no association between sex and whether a person would rate their life as thriving.
C) There is an association between whether a person is a veteran and whether a person would rate their life as thriving.
D) There is no association between whether a person is a veteran and whether a person would rate their life as thriving.
Unlock Deck
Unlock for access to all 46 flashcards in this deck.
Unlock Deck
k this deck
32
The Women's Health Study included 39,876 female health professionals aged 45 years and older who were followed for an average of 10 years (Ridker et al., 2005). At the beginning of the study, participants were randomly assigned to take either a daily low-dose aspirin or a daily placebo pill for the duration of the study. At the end of the study, researchers measured the number of participants that suffered from a heart attack during the study. Data are summarized in the following table.
-Is a theory-based approach appropriate to evaluate the relationship between whether an individual took aspirin or a placebo and whether an individual suffers a heart attack?
A) No, since a simulation-based approach is always appropriate.
B) Yes, since 39,876 is larger than 20.
C) Yes, since 391 and 39,485 are both greater than 10.
D) Yes, since 198, 193, 19,736, 19,749 are all greater than 10.
Unlock Deck
Unlock for access to all 46 flashcards in this deck.
Unlock Deck
k this deck
33
The Women's Health Study included 39,876 female health professionals aged 45 years and older who were followed for an average of 10 years (Ridker et al., 2005). At the beginning of the study, participants were randomly assigned to take either a daily low-dose aspirin or a daily placebo pill for the duration of the study. At the end of the study, researchers measured the number of participants that suffered from a heart attack during the study. Data are summarized in the following table.
-Use the Theory-Based Inference applet to find a 90% confidence interval for the difference in probability of suffering a heart attack between the two groups (aspirin - placebo).
(___(1)___, ___(2)___)
-Use the Theory-Based Inference applet to find a 90% confidence interval for the difference in probability of suffering a heart attack between the two groups (aspirin - placebo).
(___(1)___, ___(2)___)
Unlock Deck
Unlock for access to all 46 flashcards in this deck.
Unlock Deck
k this deck
34
The Women's Health Study included 39,876 female health professionals aged 45 years and older who were followed for an average of 10 years (Ridker et al., 2005). At the beginning of the study, participants were randomly assigned to take either a daily low-dose aspirin or a daily placebo pill for the duration of the study. At the end of the study, researchers measured the number of participants that suffered from a heart attack during the study. Data are summarized in the following table.
-Based off of your confidence interval in question 33, what could you say for sure about the p-value for testing versus ?
A) p-value < 0.01
B) p-value < 0.05
C) p-value < 0.10
D) p-value > 0.10
-Based off of your confidence interval in question 33, what could you say for sure about the p-value for testing
versus ? A) p-value < 0.01
B) p-value < 0.05
C) p-value < 0.10
D) p-value > 0.10
Unlock Deck
Unlock for access to all 46 flashcards in this deck.
Unlock Deck
k this deck
35
The Women's Health Study included 39,876 female health professionals aged 45 years and older who were followed for an average of 10 years (Ridker et al., 2005). At the beginning of the study, participants were randomly assigned to take either a daily low-dose aspirin or a daily placebo pill for the duration of the study. At the end of the study, researchers measured the number of participants that suffered from a heart attack during the study. Data are summarized in the following table.
-If we had calculated a 95% confidence interval in question 33 rather than a 90% confidence interval, all else being equal, would the resulting interval be wider, narrower, or the same width?
A) Wider
B) Narrower
C) Same width
-If we had calculated a 95% confidence interval in question 33 rather than a 90% confidence interval, all else being equal, would the resulting interval be wider, narrower, or the same width?
A) Wider
B) Narrower
C) Same width
Unlock Deck
Unlock for access to all 46 flashcards in this deck.
Unlock Deck
k this deck
36
The Women's Health Study included 39,876 female health professionals aged 45 years and older who were followed for an average of 10 years (Ridker et al., 2005). At the beginning of the study, participants were randomly assigned to take either a daily low-dose aspirin or a daily placebo pill for the duration of the study. At the end of the study, researchers measured the number of participants that suffered from a heart attack during the study. Data are summarized in the following table.
-If our sample size had been 10,000 rather than 39,876, all else being equal, would the 90% confidence interval be wider, narrower, or the same width as the one found in question 33?
A) Wider
B) Narrower
C) Same width
-If our sample size had been 10,000 rather than 39,876, all else being equal, would the 90% confidence interval be wider, narrower, or the same width as the one found in question 33?
A) Wider
B) Narrower
C) Same width
Unlock Deck
Unlock for access to all 46 flashcards in this deck.
Unlock Deck
k this deck
37
A 2003 study reported in the Journal of Consumer Affairs examined how well consumers protect themselves from identity theft. The study surveyed a random sample of 61 college students and 59 non-students, and asked each participant, "Have you used personal information (such as birth date, pet name, etc.) when creating a password?" For the students, 22 agreed with this statement, while 30 of the non-students agreed.
-Calculate the difference between the proportion of college students that agreed with the statement and the proportion of nonstudents that agreed with the statement in the study (student - non-student).
-Calculate the difference between the proportion of college students that agreed with the statement and the proportion of nonstudents that agreed with the statement in the study (student - non-student).
Unlock Deck
Unlock for access to all 46 flashcards in this deck.
Unlock Deck
k this deck
38
A 2003 study reported in the Journal of Consumer Affairs examined how well consumers protect themselves from identity theft. The study surveyed a random sample of 61 college students and 59 non-students, and asked each participant, "Have you used personal information (such as birth date, pet name, etc.) when creating a password?" For the students, 22 agreed with this statement, while 30 of the non-students agreed.
-Is a theory-based approach appropriate to test versus ?
A) No, since a simulation-based approach is always appropriate.
B) Yes, since 120 is larger than 20.
C) Yes, since 61 and 59 are both greater than 20.
D) Yes, since at least 10 people agreed and at least 10 people disagreed in each sample.
-Is a theory-based approach appropriate to test versus
? A) No, since a simulation-based approach is always appropriate.
B) Yes, since 120 is larger than 20.
C) Yes, since 61 and 59 are both greater than 20.
D) Yes, since at least 10 people agreed and at least 10 people disagreed in each sample.
Unlock Deck
Unlock for access to all 46 flashcards in this deck.
Unlock Deck
k this deck
39
A 2003 study reported in the Journal of Consumer Affairs examined how well consumers protect themselves from identity theft. The study surveyed a random sample of 61 college students and 59 non-students, and asked each participant, "Have you used personal information (such as birth date, pet name, etc.) when creating a password?" For the students, 22 agreed with this statement, while 30 of the non-students agreed.
-Use the Theory-Based Inference applet to find the p-value for a test of test versus
A) p-value = 0.0512
B) p-value = 0.1023
C) p-value = 0.1480
D) p-value = 0.9488
-Use the Theory-Based Inference applet to find the p-value for a test of test
versus A) p-value = 0.0512
B) p-value = 0.1023
C) p-value = 0.1480
D) p-value = 0.9488
Unlock Deck
Unlock for access to all 46 flashcards in this deck.
Unlock Deck
k this deck
40
A 2003 study reported in the Journal of Consumer Affairs examined how well consumers protect themselves from identity theft. The study surveyed a random sample of 61 college students and 59 non-students, and asked each participant, "Have you used personal information (such as birth date, pet name, etc.) when creating a password?" For the students, 22 agreed with this statement, while 30 of the non-students agreed.
-Use the
Theory-Based Inference applet to find a 95% confidence interval for the difference in probability of agreeing with the statement in the study between the two groups (student - non-student).
(___(1)___, ___(2)___)
-Use the
Theory-Based Inference applet to find a 95% confidence interval for the difference in probability of agreeing with the statement in the study between the two groups (student - non-student).
(___(1)___, ___(2)___)
Unlock Deck
Unlock for access to all 46 flashcards in this deck.
Unlock Deck
k this deck
41
A 2003 study reported in the Journal of Consumer Affairs examined how well consumers protect themselves from identity theft. The study surveyed a random sample of 61 college students and 59 non-students, and asked each participant, "Have you used personal information (such as birth date, pet name, etc.) when creating a password?" For the students, 22 agreed with this statement, while 30 of the non-students agreed.
-What does it mean to have 95% confidence in the interval you created in question 40?
A) There is a 95% chance that the true difference in proportions is contained in the interval calculated in question 40.
B) In 95% of all possible random samples, the interval computed from the sample will contain the sample difference in proportions.
C) There is a 95% chance that the sample difference in proportions is contained in the interval calculated in question 40.
D) In 95% of all possible random samples, the interval computed from the sample will contain the true difference in proportions.
Unlock Deck
Unlock for access to all 46 flashcards in this deck.
Unlock Deck
k this deck
42
A 2003 study reported in the Journal of Consumer Affairs examined how well consumers protect themselves from identity theft. The study surveyed a random sample of 61 college students and 59 non-students, and asked each participant, "Have you used personal information (such as birth date, pet name, etc.) when creating a password?" For the students, 22 agreed with this statement, while 30 of the non-students agreed.
-If we increased the confidence level from 95% to 99%, all else remaining the same, the width of the confidence interval would
A) increase.
B) remain the same.
C) decrease.
-If we increased the confidence level from 95% to 99%, all else remaining the same, the width of the confidence interval would
A) increase.
B) remain the same.
C) decrease.
Unlock Deck
Unlock for access to all 46 flashcards in this deck.
Unlock Deck
k this deck
43
A 2003 study reported in the Journal of Consumer Affairs examined how well consumers protect themselves from identity theft. The study surveyed a random sample of 61 college students and 59 non-students, and asked each participant, "Have you used personal information (such as birth date, pet name, etc.) when creating a password?" For the students, 22 agreed with this statement, while 30 of the non-students agreed.
-If we increased the confidence level from 95% to 99%, all else remaining the same, the center of the confidence interval would
A) increase.
B) remain the same.
C) decrease.
-If we increased the confidence level from 95% to 99%, all else remaining the same, the center of the confidence interval would
A) increase.
B) remain the same.
C) decrease.
Unlock Deck
Unlock for access to all 46 flashcards in this deck.
Unlock Deck
k this deck
44
Hepatitis C is a blood-born viral infection that causes liver inflammation and infection that, over time, can lead to liver disease. There is no vaccine against this strain of hepatitis, so preventive measures are the only management techniques. One of the ways hepatitis can be transmitted is by use of improperly sterilized tattoo equipment or contaminated dyes, which in turn has led to more stringent sterilization requirements for commercial tattoo parlors. Researchers at the University of Texas Southwestern Medical Center examined the medical records of 113 patients who had a tattoo to see whether these sterilization requirements at commercial parlors are reducing the proportion of hepatitis C among those with tattoos, compared to those who get tattoos elsewhere. Data are summarized in the following table.
-Is a theory-based approach appropriate to evaluate the relationship between the incidence of hepatitis C and the type of tattoo parlor?
A) No, since the number with hepatitis C in each group is less than 20.
B) Yes, since 113 is larger than 20.
C) Yes, since 70 and 43 are both greater than 20.
D) Yes, since 10, 15, 60, 28 are all at least 10.
Unlock Deck
Unlock for access to all 46 flashcards in this deck.
Unlock Deck
k this deck
45
Hepatitis C is a blood-born viral infection that causes liver inflammation and infection that, over time, can lead to liver disease. There is no vaccine against this strain of hepatitis, so preventive measures are the only management techniques. One of the ways hepatitis can be transmitted is by use of improperly sterilized tattoo equipment or contaminated dyes, which in turn has led to more stringent sterilization requirements for commercial tattoo parlors. Researchers at the University of Texas Southwestern Medical Center examined the medical records of 113 patients who had a tattoo to see whether these sterilization requirements at commercial parlors are reducing the proportion of hepatitis C among those with tattoos, compared to those who get tattoos elsewhere. Data are summarized in the following table.
-Use the Theory-Based Inference applet to find the p-value for a test of test .
versus
A) p-value = 0.0104
B) p-value = 0.0052
C) p-value = 0.2060
D) p-value = 0.9948
-Use the Theory-Based Inference applet to find the p-value for a test of test .
versus A) p-value = 0.0104
B) p-value = 0.0052
C) p-value = 0.2060
D) p-value = 0.9948
Unlock Deck
Unlock for access to all 46 flashcards in this deck.
Unlock Deck
k this deck
46
Hepatitis C is a blood-born viral infection that causes liver inflammation and infection that, over time, can lead to liver disease. There is no vaccine against this strain of hepatitis, so preventive measures are the only management techniques. One of the ways hepatitis can be transmitted is by use of improperly sterilized tattoo equipment or contaminated dyes, which in turn has led to more stringent sterilization requirements for commercial tattoo parlors. Researchers at the University of Texas Southwestern Medical Center examined the medical records of 113 patients who had a tattoo to see whether these sterilization requirements at commercial parlors are reducing the proportion of hepatitis C among those with tattoos, compared to those who get tattoos elsewhere. Data are summarized in the following table.
-Use the
Theory-Based Inference applet to find a 95% confidence interval for the difference in probability of developing hepatitis C between the two types of parlors (commercial - elsewhere).
(___(1)___, ___(2)___)
-Use the
Theory-Based Inference applet to find a 95% confidence interval for the difference in probability of developing hepatitis C between the two types of parlors (commercial - elsewhere).
(___(1)___, ___(2)___)
Unlock Deck
Unlock for access to all 46 flashcards in this deck.
Unlock Deck
k this deck
Unlock Deck
Unlock for access to all 46 flashcards in this deck.


