Deck 13: Externalities, Environmental Policy, and Public Goods
Full screen (f)
Question
Question
Question
Question
Question
Question
Question
Question
Question
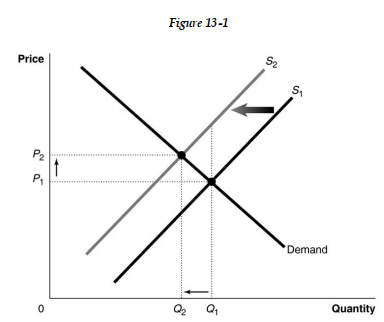 Figure 13-1 shows a market with an externality. The current market equilibrium output of Q1 is not the economically efficient output. The economically efficient output is Q2.
-Refer to Figure 13 -1. Suppose the current market equilibrium output of Q1 is not the economically efficient output because of an externality. The economically efficient output is Q2. In that case, diagram shows
A) the effect of an external cost imposed on a producer.
B) the effect of a positive externality in the production of a good.
C) the effect of an external benefit such as a subsidy granted to consumers of a good.
D) the effect of a negative externality in the production of a good.
Question
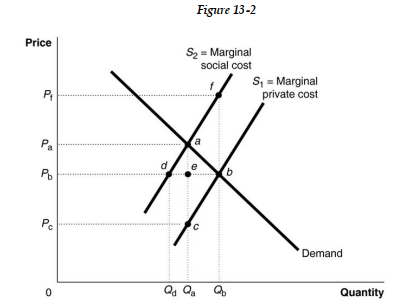 Figure 13-2 shows a market with a negative externality.
-Refer to Figure 13 -2. The efficient output level is
A) Qd.
B) Qa.
C) Qb -Qd.
D) Qb.
Question
Figure 13-2 shows a market with a negative externality.-Refer to Figure 13 -2. The private profit maximizing quantity for the firm is
A) Qd.
B) Qa.
C) Qb.
D) Qb -Qd.
Question
Question
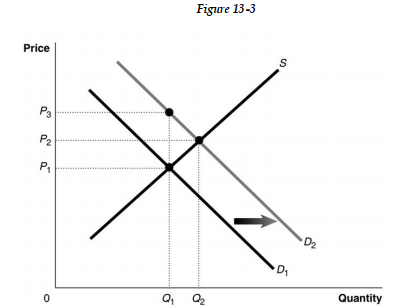 Figure 13-3 shows a market with an externality. The current market equilibrium output of Q1 is not the economically efficient output. The economically efficient output is Q2.
-Refer to Figure 13 -3. Suppose the current market equilibrium output of Q1 is not the economically efficient output because of an externality. The economically efficient output is Q2. In that case, diagram shows
A) the effect of a negative externality in the consumption of a good.
B) the effect of a subsidy granted to producers of a good.
C) the effect of an excess demand in a market.
D) the effect of a positive externality in the consumption of a good.
Question
Figure 13-3 shows a market with an externality. The current market equilibrium output of Q1 is not the economically efficient output. The economically efficient output is Q2.-Refer to Figure 13 -3. If, because of an externality, the economically efficient output is Q2 and not the current equilibrium output of Q1, what does What does D1 represent?
A) the demand curve reflecting external benefits
B) the demand curve reflecting the sum of private and social benefits
C) the demand curve reflecting private benefits
D) the demand curve reflecting social benefits
Question
Figure 13-3 shows a market with an externality. The current market equilibrium output of Q1 is not the economically efficient output. The economically efficient output is Q2.-Refer to Figure 13 -3. If, because of an externality, the economically efficient output is Q2 and not the current equilibrium output of Q1, what does What does D2 represent?
A) the demand curve reflecting external benefits
B) the demand curve reflecting social benefits
C) the demand curve reflecting the sum of social and external benefits
D) the demand curve reflecting private benefits
Question
Question
Question
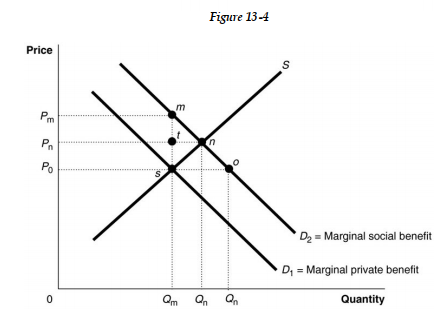 Figure 13-4 shows a market with a positive externality.
-Refer to Figure 13 -4. The efficient output level is
A) Qn.
B) Qo -Qm.
C) Qo.
D) Qm.
Question
Figure 13-4 shows a market with a positive externality.-Refer to Figure 13 -4. In the absence of any government intervention, the private market
A) under produces by Qn -Qm units.
B) under produces by Qo -Qm units.
C) over produces by Qo -Qm units.
D) over produces by Qn -Qm units.
Question
Figure 13-4 shows a market with a positive externality.-Refer to Figure 13 -4. At the competitive market equilibrium, for the last unit produced,
A) the size of the external cost is Pn -Po.
B) the size of the external cost is Pm -Po.
C) the size of the external benefit is Pn -Po.
D) the size of the external benefit is Pm -Po.
Question
Question
Question
Question
Question
Question
Question
Question
Question
Question
Question
Question
Question
Question
Question
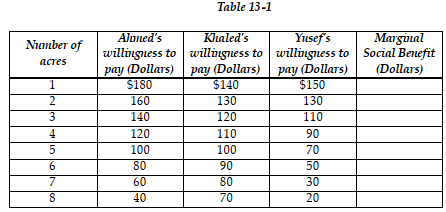 In an effort to maintain privacy and enhance property values, three homeowners, Ahmed, Khaled and Yusef, are considering leasing a portion of an adjoining vacant land for a private park. Table 13-1 shows each person's willingness to pay for each quantity of the land.
a. Complete the column in Table 13-1
b. Graph the marginal social benefit curve.
c. Suppose the landowner is willing to lease a portion of her land according to the following supply schedule given in Table 13-2. On the same diagram, graph the supply curve
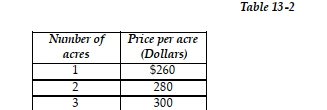
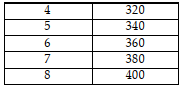 d. What is the optimal quantity of land that homeowners should lease? Explain your answer.
e. Explain why a park of 5 acres is not optimal

Unlock Deck
Sign up to unlock the cards in this deck!
Unlock Deck
Unlock Deck
1/35
Play
Full screen (f)
Deck 13: Externalities, Environmental Policy, and Public Goods
1
If an externality exists, it will be experienced by
A) the consumers of the product only.
B) the producers of the product only.
C) the government only.
D) some people not directly involved in the production or consumption of the product.
A) the consumers of the product only.
B) the producers of the product only.
C) the government only.
D) some people not directly involved in the production or consumption of the product.
some people not directly involved in the production or consumption of the product.
2
What is a market failure?
A) It refers to a situation where an entire sector of the economy (for example, the airline industry) collapses because of some unforeseen event.
B) It refers to the inability of the market to allocate resources efficiently up to the point where marginal social benefit equals marginal private cost.
C) It refers the inability of the market to allocate resources efficiently up to the point where marginal social benefit equals marginal social cost.
D) It refers to a breakdown in a market economy because of widespread corruption in government.
It refers the inability of the market to allocate resources efficiently up to the point where marginal social benefit equals marginal social cost.
3
Which of the following is an example of a negative externality?
A) not qualifying for financial aid because your parents make too much money
B) closing down a segment of a beach because of an oil spill
C) purchasing a home that has an unobstructed view of rolling hills
D) receiving a failing grade in a college course
A) not qualifying for financial aid because your parents make too much money
B) closing down a segment of a beach because of an oil spill
C) purchasing a home that has an unobstructed view of rolling hills
D) receiving a failing grade in a college course
closing down a segment of a beach because of an oil spill
4
If your neighbor burns auto tires in the yard and you can smell them and cannot see sunlight because of the black smoke, you are experiencing
A) a private benefit.
B) a private cost.
C) a positive externality.
D) a negative externality.
A) a private benefit.
B) a private cost.
C) a positive externality.
D) a negative externality.
Unlock Deck
Unlock for access to all 35 flashcards in this deck.
Unlock Deck
k this deck
5
An external cost can be calculated as the difference between
A) the social cost of production and the private cost of production.
B) the social cost of production and the social benefit of production.
C) the private cost of production and the social benefit of production.
D) a producer's cost of production and the price at which the good is sold.
A) the social cost of production and the private cost of production.
B) the social cost of production and the social benefit of production.
C) the private cost of production and the social benefit of production.
D) a producer's cost of production and the price at which the good is sold.
Unlock Deck
Unlock for access to all 35 flashcards in this deck.
Unlock Deck
k this deck
6
In 2006, Abu Dhabi Launched MASDAR in an attempt to reduce its carbon footprint and promote a more environment friendly culture around the UAE. Abu Dhabi is trying to solve the issue of
A) having too many petrodollars in its reserves.
B) negative externalities caused by carbon emissions.
C) unemployment in Abu Dhabi.
D) None of the above.
A) having too many petrodollars in its reserves.
B) negative externalities caused by carbon emissions.
C) unemployment in Abu Dhabi.
D) None of the above.
Unlock Deck
Unlock for access to all 35 flashcards in this deck.
Unlock Deck
k this deck
7
Which of the following represents the economic benefit of production when firms produce goods that create positive externalities?
A) the sum of private benefits from consumption
B) the difference between social benefits and private benefits created by the goods
C) the sum of private benefits and external benefits created by the goods
D) the external benefits created by the goods
A) the sum of private benefits from consumption
B) the difference between social benefits and private benefits created by the goods
C) the sum of private benefits and external benefits created by the goods
D) the external benefits created by the goods
Unlock Deck
Unlock for access to all 35 flashcards in this deck.
Unlock Deck
k this deck
8
When there is a positive externality, at the free market equilibrium,
A) the marginal private costs are minimized.
B) the marginal private benefit is equal to the marginal social benefit.
C) the marginal private benefit is less than the marginal social benefit.
D) the marginal private benefit is greater than the marginal social benefit.
A) the marginal private costs are minimized.
B) the marginal private benefit is equal to the marginal social benefit.
C) the marginal private benefit is less than the marginal social benefit.
D) the marginal private benefit is greater than the marginal social benefit.
Unlock Deck
Unlock for access to all 35 flashcards in this deck.
Unlock Deck
k this deck
9
Figure 13-1 shows a market with an externality. The current market equilibrium output of Q1 is not the economically efficient output. The economically efficient output is Q2.-Refer to Figure 13 -1. Suppose the current market equilibrium output of Q1 is not the economically efficient output because of an externality. The economically efficient output is Q2. In that case, diagram shows
A) the effect of an external cost imposed on a producer.
B) the effect of a positive externality in the production of a good.
C) the effect of an external benefit such as a subsidy granted to consumers of a good.
D) the effect of a negative externality in the production of a good.
Unlock Deck
Unlock for access to all 35 flashcards in this deck.
Unlock Deck
k this deck
10
Figure 13-2 shows a market with a negative externality.-Refer to Figure 13 -2. The efficient output level is
A) Qd.
B) Qa.
C) Qb -Qd.
D) Qb.
Unlock Deck
Unlock for access to all 35 flashcards in this deck.
Unlock Deck
k this deck
11
Figure 13-2 shows a market with a negative externality.-Refer to Figure 13 -2. The private profit maximizing quantity for the firm is
A) Qd.
B) Qa.
C) Qb.
D) Qb -Qd.
Unlock Deck
Unlock for access to all 35 flashcards in this deck.
Unlock Deck
k this deck
12
Which of the following is true when a negative external effect creates a deadweight loss?
A) The marginal benefit to consumers is above the marginal private cost of the last unit produced.
B) The marginal benefit to consumers is below the marginal social cost of the last unit produced.
C) The marginal benefit to consumers is equal to the marginal social cost of the last unit produced.
D) The marginal benefit to society is below the marginal private cost of the last unit produced.
Unlock Deck
Unlock for access to all 35 flashcards in this deck.
Unlock Deck
k this deck
13
Figure 13-3 shows a market with an externality. The current market equilibrium output of Q1 is not the economically efficient output. The economically efficient output is Q2.-Refer to Figure 13 -3. Suppose the current market equilibrium output of Q1 is not the economically efficient output because of an externality. The economically efficient output is Q2. In that case, diagram shows
A) the effect of a negative externality in the consumption of a good.
B) the effect of a subsidy granted to producers of a good.
C) the effect of an excess demand in a market.
D) the effect of a positive externality in the consumption of a good.
Unlock Deck
Unlock for access to all 35 flashcards in this deck.
Unlock Deck
k this deck
14
Figure 13-3 shows a market with an externality. The current market equilibrium output of Q1 is not the economically efficient output. The economically efficient output is Q2.-Refer to Figure 13 -3. If, because of an externality, the economically efficient output is Q2 and not the current equilibrium output of Q1, what does What does D1 represent?
A) the demand curve reflecting external benefits
B) the demand curve reflecting the sum of private and social benefits
C) the demand curve reflecting private benefits
D) the demand curve reflecting social benefits
Unlock Deck
Unlock for access to all 35 flashcards in this deck.
Unlock Deck
k this deck
15
Figure 13-3 shows a market with an externality. The current market equilibrium output of Q1 is not the economically efficient output. The economically efficient output is Q2.-Refer to Figure 13 -3. If, because of an externality, the economically efficient output is Q2 and not the current equilibrium output of Q1, what does What does D2 represent?
A) the demand curve reflecting external benefits
B) the demand curve reflecting social benefits
C) the demand curve reflecting the sum of social and external benefits
D) the demand curve reflecting private benefits
Unlock Deck
Unlock for access to all 35 flashcards in this deck.
Unlock Deck
k this deck
16
Which of the following statements is correct?
A) Private benefit equals external benefit minus social benefit.
B) External cost minus private cost equals social cost.
C) Private benefit plus external benefit equals social benefit.
D) Private cost equals external cost.
A) Private benefit equals external benefit minus social benefit.
B) External cost minus private cost equals social cost.
C) Private benefit plus external benefit equals social benefit.
D) Private cost equals external cost.
Unlock Deck
Unlock for access to all 35 flashcards in this deck.
Unlock Deck
k this deck
17
Which of the following statements is false?
A) Private costs are borne by the producer of the good or service.
B) Private benefits are received by the consumer of the good or service.
C) Social benefits are external benefits minus private benefits.
D) Social costs are private costs and any external costs.
A) Private costs are borne by the producer of the good or service.
B) Private benefits are received by the consumer of the good or service.
C) Social benefits are external benefits minus private benefits.
D) Social costs are private costs and any external costs.
Unlock Deck
Unlock for access to all 35 flashcards in this deck.
Unlock Deck
k this deck
18
Figure 13-4 shows a market with a positive externality.-Refer to Figure 13 -4. The efficient output level is
A) Qn.
B) Qo -Qm.
C) Qo.
D) Qm.
Unlock Deck
Unlock for access to all 35 flashcards in this deck.
Unlock Deck
k this deck
19
Figure 13-4 shows a market with a positive externality.-Refer to Figure 13 -4. In the absence of any government intervention, the private market
A) under produces by Qn -Qm units.
B) under produces by Qo -Qm units.
C) over produces by Qo -Qm units.
D) over produces by Qn -Qm units.
Unlock Deck
Unlock for access to all 35 flashcards in this deck.
Unlock Deck
k this deck
20
Figure 13-4 shows a market with a positive externality.-Refer to Figure 13 -4. At the competitive market equilibrium, for the last unit produced,
A) the size of the external cost is Pn -Po.
B) the size of the external cost is Pm -Po.
C) the size of the external benefit is Pn -Po.
D) the size of the external benefit is Pm -Po.
Unlock Deck
Unlock for access to all 35 flashcards in this deck.
Unlock Deck
k this deck
21
In which of these situations is there no deadweight loss?
A) free market production and consumption of a private good without any externalities
B) free market production of a private good with a negative externality
C) free market consumption of a private good with a positive externality
D) consumption of a common resource without government restrictions
A) free market production and consumption of a private good without any externalities
B) free market production of a private good with a negative externality
C) free market consumption of a private good with a positive externality
D) consumption of a common resource without government restrictions
Unlock Deck
Unlock for access to all 35 flashcards in this deck.
Unlock Deck
k this deck
22
One of the strategies of MASDAR, Abu Dhabi's green initiative, is to commercialize renewable energy and make it widely available. The purpose behind this strategy is
A) eliminating all dependency on oil.
B) making energy cheaper for car use.
C) profiting from the sale of these renewable energies.
D) None of the above.
A) eliminating all dependency on oil.
B) making energy cheaper for car use.
C) profiting from the sale of these renewable energies.
D) None of the above.
Unlock Deck
Unlock for access to all 35 flashcards in this deck.
Unlock Deck
k this deck
23
The Coase theorem states that
A) a free market equilibrium is the best solution to address externalities.
B) government intervention is always needed if externalities are present.
C) if transactions costs are low, private bargaining will result in an efficient solution to the problem of externalities.
D) assigning property rights is the only thing the government should do in a market economy.
Unlock Deck
Unlock for access to all 35 flashcards in this deck.
Unlock Deck
k this deck
24
Traditionally,in their attempts to control pollution, Arab governments
A) specified the total levels of pollution allowed.
B) specified the methods firms had to use to reduce pollution.
C) gave utility companies allowances to produce a target rate of pollution.
D) allowed firms to prove they were small enough to not have to reduce pollution.
A) specified the total levels of pollution allowed.
B) specified the methods firms had to use to reduce pollution.
C) gave utility companies allowances to produce a target rate of pollution.
D) allowed firms to prove they were small enough to not have to reduce pollution.
Unlock Deck
Unlock for access to all 35 flashcards in this deck.
Unlock Deck
k this deck
25
Issuing marketable emission allowance permits to polluting firms
A) encourages more pollution.
B) has the same impact as a subsidy on production.
C) gives the industry the right to a specific level of pollution.
D) generates income for the government.
A) encourages more pollution.
B) has the same impact as a subsidy on production.
C) gives the industry the right to a specific level of pollution.
D) generates income for the government.
Unlock Deck
Unlock for access to all 35 flashcards in this deck.
Unlock Deck
k this deck
26
Compared to the command and control approach to pollution control, the tradable emissions allowance system is
A) less efficient, because the tradable emissions allowance system gives firms the right to pollute a certain amount.
B) more efficient, because there are implementation and monitoring costs with the tradable emissions allowance system.
C) more efficient, because firms with low costs of pollution control would pollute the least and sell their extra permits to other firms with higher costs of pollution control.
D) less efficient, because it does not raise funds for the government whereas under the command and control approach, firms are penalized for non -compliance.
Unlock Deck
Unlock for access to all 35 flashcards in this deck.
Unlock Deck
k this deck
27
The 1997 Kyoto Treaty is an agreement among industrial nations to
A) impose a carbon tax by the year 2010 on all industries that emit carbon dioxide.
B) establish a tradable carbon emissions permit system.
C) reduce carbon dioxide emissions.
D) provide fast growing developing countries such as India and China with the technology to reduce their carbon emissions.
A) impose a carbon tax by the year 2010 on all industries that emit carbon dioxide.
B) establish a tradable carbon emissions permit system.
C) reduce carbon dioxide emissions.
D) provide fast growing developing countries such as India and China with the technology to reduce their carbon emissions.
Unlock Deck
Unlock for access to all 35 flashcards in this deck.
Unlock Deck
k this deck
28
There has been much debate about imposing a carbon tax on countries importing oil to reduce the carbon footprint world -wide and help protect the environment. What would be the impact of such a tax on the demand for oil and its price?
A) There would be no effect.
B) Demand would increase, prices would fall.
C) The demand for oil would fall, prices of oil would decrease.
D) None of the above.
A) There would be no effect.
B) Demand would increase, prices would fall.
C) The demand for oil would fall, prices of oil would decrease.
D) None of the above.
Unlock Deck
Unlock for access to all 35 flashcards in this deck.
Unlock Deck
k this deck
29
Suppose there is a government funded national health service that is available to citizens at no charge and that the service is funded to a level where shortages do not occur. In this situation, health care services is best classified as a
A) common resource.
B) public good.
C) quasi -public good.
D) national good.
A) common resource.
B) public good.
C) quasi -public good.
D) national good.
Unlock Deck
Unlock for access to all 35 flashcards in this deck.
Unlock Deck
k this deck
30
Countries like the United States differ from many Arab countries in that the majority of individuals who have private health insurance
A) purchase it directly from government subsidized heath insurance corporations.
B) purchase it out of their wage income and receive a tax credit for this expenditure.
C) purchase it out of their wage income and receive no tax credit for this expenditure.
D) receive it as part of a benefit package from their employers.
Unlock Deck
Unlock for access to all 35 flashcards in this deck.
Unlock Deck
k this deck
31
How does the construction of a market demand curve for a private good differ from that for a public good?
A) The market demand curve for a private good is determined by adding up the quantities demanded by each consumer at each price but the market demand curve for a public good is determined by adding up the price each consumer is willing to pay for each quantity of the good.
B) The market demand curve for a private good is determined by adding up the price each consumer is willing to pay for each quantity of the good but the market demand curve for a public good is determined by adding up but the quantities demanded by each consumer at each price.
C) There is no difference; in both cases the demand curve is determined by adding up the quantities demanded by each consumer at each price.
D) There is no difference; in both cases the demand curve is determined by adding up the price each consumer is willing to pay for each quantity of the good.
Unlock Deck
Unlock for access to all 35 flashcards in this deck.
Unlock Deck
k this deck
32
One difference between the demand for a private good and that for a public good is that
A) with a private good, each consumer chooses the quantity she wants to consume but with a public good, everyone consumes the same quantity.
B) with a private good, each consumer chooses the quantity she wants to consume but with a public good, each consumer chooses the price she is willing to pay for a fixed quantity.
C) with a private good, each consumer receives different amounts of benefit from consuming the product but with a public good, every consumer realizes the same amount of benefit from consuming the product.
D) the marginal benefit from consuming the last unit of a public good always exceeds the marginal benefit from consuming the last unit of a private good because there are externalities in the consumption of the former.
Unlock Deck
Unlock for access to all 35 flashcards in this deck.
Unlock Deck
k this deck
33
Mona and Salwa share an apartment and they are deciding whether or not to purchase a weekly housecleaning service. The value of the service to each of them is $50 and it costs $80 to hire a housecleaner. Suppose Salwa is lazy and a spendthrift and Mona suspects that Salwa will be willing to pay $80. What is Mona likely to do, given that she is as rational as any other person?
A) She might claim that she is not willing to pay for a housecleaner, hoping that Salwa would pay the entire $80.
B) She will correctly rationalize that Salwa's laziness and spendthrift ways are irrelevant to the decision at hand.
C) She will come clean and tell Salwa that since Salwa is lazy and a spendthrift she should pay a bigger share of the $80.
D) She might offer to do Salwa's housecleaning chores if salwa would pay her $50.
Unlock Deck
Unlock for access to all 35 flashcards in this deck.
Unlock Deck
k this deck
34
Global warming refers to the effect of global pollutants such as carbon dioxide on climates on the earth. Climate -induced changes in temperatures affect, among other things, agriculture. Which of the following is a reason why policymakers are still debating if this problem should be addressed and how it should be addressed?
A) There is much disagreement about all aspects of the problem: how much carbon emissions contribute to damage from climate change which in turn informs the benefits from reduction, and what methods to use which in turn determines the cost of reduction.
B) The marginal cost of reducing carbon emissions is not known with certainly but the marginal benefit from reduction is known with certainty.
C) The marginal cost of reducing carbon emissions is known with certainly but the marginal benefit from reduction is not known with certainty.
D) Scientists agree about the damage caused by carbon emissions but disagree about the methods of reducing emissions.
Unlock Deck
Unlock for access to all 35 flashcards in this deck.
Unlock Deck
k this deck
35
In an effort to maintain privacy and enhance property values, three homeowners, Ahmed, Khaled and Yusef, are considering leasing a portion of an adjoining vacant land for a private park. Table 13-1 shows each person's willingness to pay for each quantity of the land.a. Complete the column in Table 13-1
b. Graph the marginal social benefit curve.
c. Suppose the landowner is willing to lease a portion of her land according to the following supply schedule given in Table 13-2. On the same diagram, graph the supply curve
d. What is the optimal quantity of land that homeowners should lease? Explain your answer.e. Explain why a park of 5 acres is not optimal
Unlock Deck
Unlock for access to all 35 flashcards in this deck.
Unlock Deck
k this deck
Unlock Deck
Unlock for access to all 35 flashcards in this deck.


