Deck 6: Trade and Why Isnt the Whole World Developed
Full screen (f)
Question
Question
Question
The following figure depicts the production possibilities curve when Ann and Bob engage in trade. With all her resources, Ann can either produce two computer programs or one Web site. With all his resources, Bob can either produce one computer program or three Web sites.
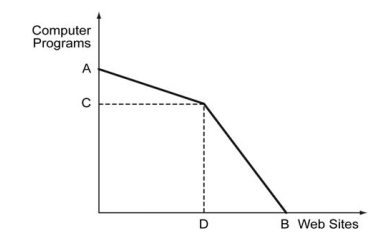
-Refer to the figure above. What is the value of A?
A) 1
B) 2
C) 3
D) 4
-Refer to the figure above. What is the value of A?
A) 1
B) 2
C) 3
D) 4
Question
The following figure depicts the production possibilities curve when Ann and Bob engage in trade. With all her resources, Ann can either produce two computer programs or one Web site. With all his resources, Bob can either produce one computer program or three Web sites.
-Refer to the figure above. What is the value of B?
A) 1
B) 2
C) 3
D) 4
-Refer to the figure above. What is the value of B?
A) 1
B) 2
C) 3
D) 4
Question
The following figure depicts the production possibilities curve when Ann and Bob engage in trade. With all her resources, Ann can either produce two computer programs or one Web site. With all his resources, Bob can either produce one computer program or three Web sites.
-Refer to the figure above. What should be the values of C and D?
A) C=3,D=4
B) C=4,D=3
C) C=1,D=1
D) C=2,D=3
-Refer to the figure above. What should be the values of C and D?
A) C=3,D=4
B) C=4,D=3
C) C=1,D=1
D) C=2,D=3
Question
The figure below shows production possibilities curves for tomatoes and oranges in two prefectures in a country.
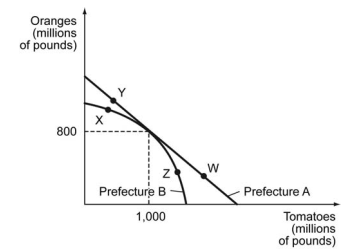
-Refer to the figure above. Suppose that Prefecture A produces at point W, while Prefecture B produces at point X. Could there be gains from trade (Prefecture A sells tomatoes to Prefecture B, and Prefecture B sells oranges to Prefecture B)? Why or why not?
A) Yes, because Prefecture A has a comparative advantage in tomato production beyond 1 billion pounds while Prefecture B has a comparative advantage in orange production beyond 800 million pounds.
B) Yes, because Prefecture A produces more tomatoes while Prefecture B produces more oranges.
C) No, because Prefecture A's opportunity cost of producing additional pounds of tomatoes at W is higher than Prefecture B's opportunity cost at X.
D) No, because Prefecture A's opportunity cost of producing additional pound of oranges at W is higher than Prefecture B's opportunity cost at X.
Question
The figure below shows production possibilities curves for tomatoes and oranges in two prefectures in a country.
-Refer to the figure above. Suppose that Prefecture A produces at point Y, while Prefecture B produces at point Z. Could there be gains from trade (Prefecture A sells oranges to Prefecture B, and Prefecture B sells tomatoes to Prefecture B)? Why or why not?
A) Yes, because Prefecture A has a comparative advantage in orange production up to 800 million pounds while Prefecture B has a comparative advantage in tomato production beyond 1 billion pounds.
B) Yes, because Prefecture A produces more oranges while Prefecture B produces more tomatoes.
C) No, because Prefecture A's opportunity cost of producing additional pound of tomatoes at W is higher than Prefecture B's opportunity cost at X.
D) No, because Prefecture A's opportunity cost of producing additional pound of oranges at W is higher than Prefecture B's opportunity cost at X.
Question
Suppose an economy produces only solar panels and coal. Between 2005 and 2015, the production possibilities curve (PPC) for this economy shifted out as characterized in the figure below.
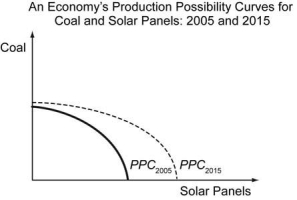 Which of the following statements best describes the shift in the PPC between 2005 and 2015?
A) Increases in the supply of inputs affected both the coal and solar panel industries equally.
B) Technological innovation had a larger positive effect on the production of solar panels.
C) Productivity gains had a larger positive effect on the production of coal.
D) Productivity gains had equal effects on the production of solar panels and coal.
Which of the following statements best describes the shift in the PPC between 2005 and 2015?A) Increases in the supply of inputs affected both the coal and solar panel industries equally.
B) Technological innovation had a larger positive effect on the production of solar panels.
C) Productivity gains had a larger positive effect on the production of coal.
D) Productivity gains had equal effects on the production of solar panels and coal.
Question
The U.S. wheat market is represented by the demand and supply curves shown in the figure below.
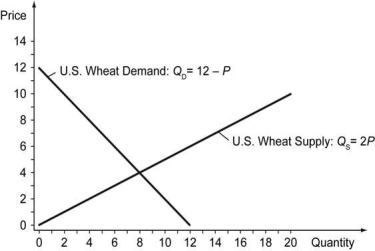 Initially, suppose there is no trade in wheat between the United States and the rest of the world. In this case, consumer surplus is represented by the area ________ and producer surplus is represented by the area ________ in the figure below.
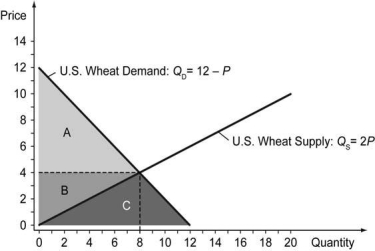
A) A; B
B) A+B+C;0
C) A;B+C
D) 0;A+B+C
Initially, suppose there is no trade in wheat between the United States and the rest of the world. In this case, consumer surplus is represented by the area ________ and producer surplus is represented by the area ________ in the figure below.A) A; B
B) A+B+C;0
C) A;B+C
D) 0;A+B+C
Question
The following figure shows the demand curve, D, and supply curve, S, for milk in Cadbia.
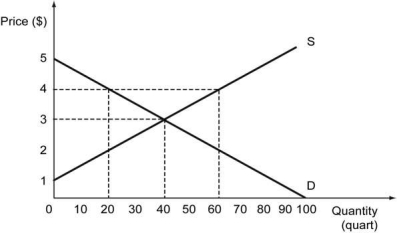 a) What is the consumer surplus, producer surplus, and total surplus if Cadbia does not engage in free trade?
b) If the world price of milk is $4 per quart, will Cadbia import or export milk?
c) What is the change in consumer surplus, producer surplus, and total surplus if Cadbia participates in free trade?
a) What is the consumer surplus, producer surplus, and total surplus if Cadbia does not engage in free trade?b) If the world price of milk is $4 per quart, will Cadbia import or export milk?
c) What is the change in consumer surplus, producer surplus, and total surplus if Cadbia participates in free trade?
Question
The following figure shows the demand curve, D, and the supply curve, S, for soap in Barylia.
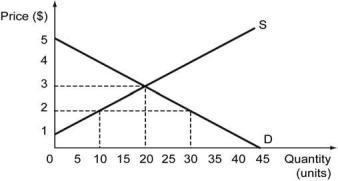 a) What is the consumer surplus, producer surplus, and total surplus in Barylia if the nation does not participate in free trade?
b) If the world price of soap is $2 per unit, will Barylia import or export soap?
c) What is the change in consumer surplus, producer surplus, and total surplus if Barylia participates in free trade?
a) What is the consumer surplus, producer surplus, and total surplus in Barylia if the nation does not participate in free trade?b) If the world price of soap is $2 per unit, will Barylia import or export soap?
c) What is the change in consumer surplus, producer surplus, and total surplus if Barylia participates in free trade?
Question
Question
Question
Question
Question

Unlock Deck
Sign up to unlock the cards in this deck!
Unlock Deck
Unlock Deck
1/16
Play
Full screen (f)
Deck 6: Trade and Why Isnt the Whole World Developed
1
Yasmin and Zeek are lawyers working at V, W, and X LLP. Yasmin works 48 hours a week, and Zeek also works 48 hours a week. They handle two types of cases, intellectual property (IP) cases and corporate fraud (CF) cases. It takes Yasmin 6 hours to handle each IP case and 4 hours to handle each CF case. Zeek can finish an IP case in 3 hours and a CF case in 6 hours.
-Refer to the scenario above. Suppose that the two lawyers' boss wants the total number of IP cases worked on by them to equal the total number of CF cases worked on by them. So long as the total number of IP cases equals the total number of CF cases, their boss does not care which lawyer works on how many of which type of case. So Yasmin and Zeek decide to take advantage of their comparative advantages. How would they divide the tasks?
A) Yasmin specializes in IP cases, while Zeek specializes in CF cases.
B) Yasmin specializes in CF cases, while Zeek specializes in IP cases.
C) Yasmin specializes in IP cases, while Zeek works on both types of cases.
D) Yasmin specializes in CF cases, while Zeek works on both types of cases.
Yasmin specializes in CF cases, while Zeek works on both types of cases.
2
Yasmin and Zeek are lawyers working at V, W, and X LLP. Yasmin works 48 hours a week, and Zeek also works 48 hours a week. They handle two types of cases, intellectual property (IP) cases and corporate fraud (CF) cases. It takes Yasmin 6 hours to handle each IP case and 4 hours to handle each CF case. Zeek can finish an IP case in 3 hours and a CF case in 6 hours.
-Refer to the scenario above. Suppose that the two lawyers' boss wants the total number of IP cases worked on by them to be equal the total number of CF cases worked on by them. So long as the total number of IP cases equals the total number of CF cases, their boss does not care which lawyer works on how many of which type of case. So Yasmin and Zeek decide to take advantage of their comparative advantages. How many IP and CF cases would they finish? (Hint: Assume that they can work on a fraction of a case.)
A) 12 and three halves of each type of case
B) 13 and a third of each type of case
C) 16 and a half of each type of case
D) 24 of each type of case
13 and a third of each type of case
3
The following figure depicts the production possibilities curve when Ann and Bob engage in trade. With all her resources, Ann can either produce two computer programs or one Web site. With all his resources, Bob can either produce one computer program or three Web sites.
-Refer to the figure above. What is the value of A?
A) 1
B) 2
C) 3
D) 4
-Refer to the figure above. What is the value of A?
A) 1
B) 2
C) 3
D) 4
3
4
The following figure depicts the production possibilities curve when Ann and Bob engage in trade. With all her resources, Ann can either produce two computer programs or one Web site. With all his resources, Bob can either produce one computer program or three Web sites.
-Refer to the figure above. What is the value of B?
A) 1
B) 2
C) 3
D) 4
-Refer to the figure above. What is the value of B?
A) 1
B) 2
C) 3
D) 4
Unlock Deck
Unlock for access to all 16 flashcards in this deck.
Unlock Deck
k this deck
5
The following figure depicts the production possibilities curve when Ann and Bob engage in trade. With all her resources, Ann can either produce two computer programs or one Web site. With all his resources, Bob can either produce one computer program or three Web sites.
-Refer to the figure above. What should be the values of C and D?
A) C=3,D=4
B) C=4,D=3
C) C=1,D=1
D) C=2,D=3
-Refer to the figure above. What should be the values of C and D?
A) C=3,D=4
B) C=4,D=3
C) C=1,D=1
D) C=2,D=3
Unlock Deck
Unlock for access to all 16 flashcards in this deck.
Unlock Deck
k this deck
6
The figure below shows production possibilities curves for tomatoes and oranges in two prefectures in a country.
-Refer to the figure above. Suppose that Prefecture A produces at point W, while Prefecture B produces at point X. Could there be gains from trade (Prefecture A sells tomatoes to Prefecture B, and Prefecture B sells oranges to Prefecture B)? Why or why not?
A) Yes, because Prefecture A has a comparative advantage in tomato production beyond 1 billion pounds while Prefecture B has a comparative advantage in orange production beyond 800 million pounds.
B) Yes, because Prefecture A produces more tomatoes while Prefecture B produces more oranges.
C) No, because Prefecture A's opportunity cost of producing additional pounds of tomatoes at W is higher than Prefecture B's opportunity cost at X.
D) No, because Prefecture A's opportunity cost of producing additional pound of oranges at W is higher than Prefecture B's opportunity cost at X.
Unlock Deck
Unlock for access to all 16 flashcards in this deck.
Unlock Deck
k this deck
7
The figure below shows production possibilities curves for tomatoes and oranges in two prefectures in a country.
-Refer to the figure above. Suppose that Prefecture A produces at point Y, while Prefecture B produces at point Z. Could there be gains from trade (Prefecture A sells oranges to Prefecture B, and Prefecture B sells tomatoes to Prefecture B)? Why or why not?
A) Yes, because Prefecture A has a comparative advantage in orange production up to 800 million pounds while Prefecture B has a comparative advantage in tomato production beyond 1 billion pounds.
B) Yes, because Prefecture A produces more oranges while Prefecture B produces more tomatoes.
C) No, because Prefecture A's opportunity cost of producing additional pound of tomatoes at W is higher than Prefecture B's opportunity cost at X.
D) No, because Prefecture A's opportunity cost of producing additional pound of oranges at W is higher than Prefecture B's opportunity cost at X.
Unlock Deck
Unlock for access to all 16 flashcards in this deck.
Unlock Deck
k this deck
8
Suppose an economy produces only solar panels and coal. Between 2005 and 2015, the production possibilities curve (PPC) for this economy shifted out as characterized in the figure below.
Which of the following statements best describes the shift in the PPC between 2005 and 2015?
A) Increases in the supply of inputs affected both the coal and solar panel industries equally.
B) Technological innovation had a larger positive effect on the production of solar panels.
C) Productivity gains had a larger positive effect on the production of coal.
D) Productivity gains had equal effects on the production of solar panels and coal.
Which of the following statements best describes the shift in the PPC between 2005 and 2015?A) Increases in the supply of inputs affected both the coal and solar panel industries equally.
B) Technological innovation had a larger positive effect on the production of solar panels.
C) Productivity gains had a larger positive effect on the production of coal.
D) Productivity gains had equal effects on the production of solar panels and coal.
Unlock Deck
Unlock for access to all 16 flashcards in this deck.
Unlock Deck
k this deck
9
The U.S. wheat market is represented by the demand and supply curves shown in the figure below.
Initially, suppose there is no trade in wheat between the United States and the rest of the world. In this case, consumer surplus is represented by the area ________ and producer surplus is represented by the area ________ in the figure below.
A) A; B
B) A+B+C;0
C) A;B+C
D) 0;A+B+C
Initially, suppose there is no trade in wheat between the United States and the rest of the world. In this case, consumer surplus is represented by the area ________ and producer surplus is represented by the area ________ in the figure below.A) A; B
B) A+B+C;0
C) A;B+C
D) 0;A+B+C
Unlock Deck
Unlock for access to all 16 flashcards in this deck.
Unlock Deck
k this deck
10
The following figure shows the demand curve, D, and supply curve, S, for milk in Cadbia.
a) What is the consumer surplus, producer surplus, and total surplus if Cadbia does not engage in free trade?
b) If the world price of milk is $4 per quart, will Cadbia import or export milk?
c) What is the change in consumer surplus, producer surplus, and total surplus if Cadbia participates in free trade?
a) What is the consumer surplus, producer surplus, and total surplus if Cadbia does not engage in free trade?b) If the world price of milk is $4 per quart, will Cadbia import or export milk?
c) What is the change in consumer surplus, producer surplus, and total surplus if Cadbia participates in free trade?
Unlock Deck
Unlock for access to all 16 flashcards in this deck.
Unlock Deck
k this deck
11
The following figure shows the demand curve, D, and the supply curve, S, for soap in Barylia.
a) What is the consumer surplus, producer surplus, and total surplus in Barylia if the nation does not participate in free trade?
b) If the world price of soap is $2 per unit, will Barylia import or export soap?
c) What is the change in consumer surplus, producer surplus, and total surplus if Barylia participates in free trade?
a) What is the consumer surplus, producer surplus, and total surplus in Barylia if the nation does not participate in free trade?b) If the world price of soap is $2 per unit, will Barylia import or export soap?
c) What is the change in consumer surplus, producer surplus, and total surplus if Barylia participates in free trade?
Unlock Deck
Unlock for access to all 16 flashcards in this deck.
Unlock Deck
k this deck
12
The following quote describes China?s effect on world labor markets. China?s emergence as a great economic power has induced an epochal shift in patterns of world trade. Simultaneously, it has challenged much of the received empirical wisdom about how labor markets adjust to trade shocks. Alongside the heralded consumer benefits of expanded trade are substantial adjustment costs and distributional consequences. These impacts are most visible in the local labor markets in which the industries exposed to foreign competition are concentrated. Adjustment in local labor markets is remarkably slow, with wages and labor-force participation rates remaining depressed and unemployment rates remaining elevated for at least a full decade after the China trade shock commences. Exposed workers experience greater job churning and reduced lifetime income. At the national level, employment has fallen in the US industries more exposed to import competition, as expected, but offsetting employment gains in other industries have yet to materialize. (The China Shock: Learning from Labor-Market Adjustment to Large Changes in Trade by David H. Autor, David Born, and Gordon H. Hanson, Annual Review of Economics Vol.8:1-635, October 2016)
-Refer to the scenario above. Which of the following statements stands in contrast to the impact of trade with China experienced by some U.S. workers described in this quote?
A) Many workers displaced because of NAFTA?s passage soon found gainful employment.
B) While U.S. manufacturing employment declined due partly to trade with China, trade with the United States has almost certainly been good for Chinese producers and consumers.
C) In recent years (beginning in the 1990s), trade has had a much more important effect on wages in the states than was observed before the 1990s.
D) Opening up an economy to trade clearly expands the pie, but some people might end up with a smaller piece than they used to have.
Unlock Deck
Unlock for access to all 16 flashcards in this deck.
Unlock Deck
k this deck
13
According to Samuel Huntington, South Korea's economy experienced rapid economic growth because South Koreans valued thrift, investment, education, and discipline. In contrast, Ghana's economy did not grow as fast because the country had different social values. This argument claims that ________.
A) culture is a fundamental cause of prosperity
B) institutions are a fundamental cause of prosperity
C) institutions are a proximate cause of prosperity
D) geographical location is a fundamental cause of prosperity
A) culture is a fundamental cause of prosperity
B) institutions are a fundamental cause of prosperity
C) institutions are a proximate cause of prosperity
D) geographical location is a fundamental cause of prosperity
Unlock Deck
Unlock for access to all 16 flashcards in this deck.
Unlock Deck
k this deck
14
Which of the following statements correctly highlights a difference between countries with extractive economic institutions and countries with inclusive economic institutions?
A) Entry barriers for new businesses are likely to be higher in countries with extractive economic institutions than in countries with inclusive economic institutions.
B) Entry barriers for new businesses are likely to be lower in countries with extractive economic institutions than in countries with inclusive economic institutions.
C) Countries with extractive economic institutions typically have worse geographical conditions compared to countries with inclusive economic institutions.
D) Countries with extractive economic institutions typically have better geographical conditions compared to countries with inclusive economic institutions.
Unlock Deck
Unlock for access to all 16 flashcards in this deck.
Unlock Deck
k this deck
15
Which of the following statements correctly highlights a difference between countries with extractive economic institutions and countries with inclusive economic institutions?
A) Innovation is more likely in countries with inclusive economic institutions than in countries with extractive economic institutions.
B) Innovation is less likely in countries with inclusive economic institutions than in countries with extractive economic institutions.
C) Countries with extractive economic institutions typically have worse climatic conditions than countries with inclusive economic institutions.
D) Countries with extractive economic institutions typically have better climatic conditions than countries with inclusive economic institutions.
Unlock Deck
Unlock for access to all 16 flashcards in this deck.
Unlock Deck
k this deck
16
Institutional reversal refers to the fact that ________.
A) Europeans established more extractive institutions in places that were previously more developed and set up more inclusive institutions that were previously less developed
B) Europeans established more extractive institutions in places that were previously less developed and set up more inclusive institutions that were previously more developed
C) the same institutions that were highly extractive in the year 1500 slowly changed into inclusive institutions as a result of modernization
D) the same institutions that were highly inclusive in the year 1500 slowly changed into extractive institutions as a result of modernization
Unlock Deck
Unlock for access to all 16 flashcards in this deck.
Unlock Deck
k this deck
Unlock Deck
Unlock for access to all 16 flashcards in this deck.


