Deck 3: Measures of Central Tendency and Dispersion
Full screen (f)
Question
Question
Question
Question
Question
Question
Question
Question
Question
Question
Question
Question
Question
Question
Question
Question
Question
Question
Question
Question
Question
Question
Question
Question
Question
Question
How does the standard deviation formula differ for samples and populations?
A) Xi is used to represent the score of a variable in the population; N is used to represent scores in a sample.
B) Xi is used to represent the score of a variable in the sample; N is used to represent scores in a population.
C) ì is used to represent the population mean; is used to represent a sample's mean.
D) Standard deviations can be calculated for samples only, not for populations.
A) Xi is used to represent the score of a variable in the population; N is used to represent scores in a sample.
B) Xi is used to represent the score of a variable in the sample; N is used to represent scores in a population.
C) ì is used to represent the population mean;
is used to represent a sample's mean.D) Standard deviations can be calculated for samples only, not for populations.
Question
Question
Question
What does the expression 
instruct us to do?
A) sum the scores
B) subtract every score from the mean
C) sum the scores and then subtract the mean
D) subtract the mean from each score and add up the deviations
instruct us to do?
A) sum the scores
B) subtract every score from the mean
C) sum the scores and then subtract the mean
D) subtract the mean from each score and add up the deviations
Question
Question
Question
Question
Question
Question
Question
Question
Question
Environmental violations for 16 companies ranged from values of 11 to 97. The variance was 14. How should we calculate the standard deviation for this distribution?
A) = 4
B) (97 - 11) × 14 = 1204
C) 142 = 196
D) = 3.74
A) = 4
B) (97 - 11) × 14 = 1204
C) 142 = 196
D) = 3.74
Question
Question
Question
Question
Question
Question
Question
Question
Question
Table 3.1 Data Set of Six Volunteers at a Charitable Organization
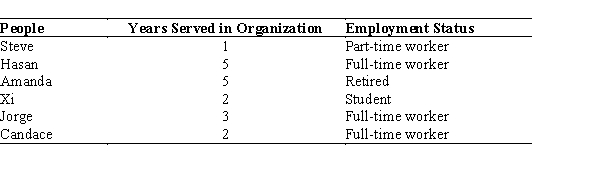
-Refer to Table 3.1. What is the mode of employment status?
A) student
B) part-time worker
C) full-time worker
D) There is no mode for this distribution.
-Refer to Table 3.1. What is the mode of employment status?
A) student
B) part-time worker
C) full-time worker
D) There is no mode for this distribution.
Question
Table 3.1 Data Set of Six Volunteers at a Charitable Organization
-Refer to Table 3.1. What is the median of employment status?
A) full-time worker
B) student
C) part-time worker
D) There is no valid median score.
-Refer to Table 3.1. What is the median of employment status?
A) full-time worker
B) student
C) part-time worker
D) There is no valid median score.
Question
Table 3.1 Data Set of Six Volunteers at a Charitable Organization
-Refer to Table 3.1. What is the mean of years served in the organization?
A) 2
B) 2.5
C) 3
D) 5
-Refer to Table 3.1. What is the mean of years served in the organization?
A) 2
B) 2.5
C) 3
D) 5
Question
Table 3.1 Data Set of Six Volunteers at a Charitable Organization
-Refer to Table 3.1. What is the median of years served in the organization?
A) 2
B) 2.5
C) 3
D) 5
-Refer to Table 3.1. What is the median of years served in the organization?
A) 2
B) 2.5
C) 3
D) 5
Question
Table 3.2 Park Space in Five Neighbourhoods of a Fictional City
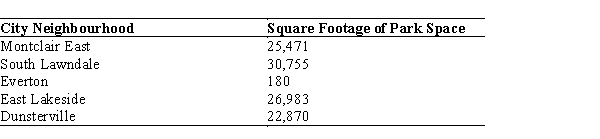
-Refer to Table 3.2. Which of the following describes the distribution of park space?
A) negatively skewed
B) positively skewed
C) symmetric
D) unclear from the information given
-Refer to Table 3.2. Which of the following describes the distribution of park space?
A) negatively skewed
B) positively skewed
C) symmetric
D) unclear from the information given
Question
Table 3.2 Park Space in Five Neighbourhoods of a Fictional City
-Refer to Table 3.2. What would be the most appropriate measure of central tendency for the distribution of park space?
A) the mode
B) the median
C) the mean
D) the interquartile range
-Refer to Table 3.2. What would be the most appropriate measure of central tendency for the distribution of park space?
A) the mode
B) the median
C) the mean
D) the interquartile range
Question
Table 3.3 Means and Standard Deviations in Monthly Accident Events for Two Mining Companies, 2014-2018
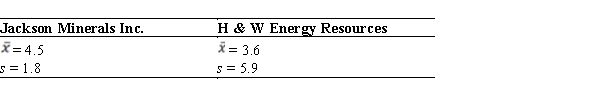
-Refer to Table 3.3. Which of the following could we conclude from these data?
A) Jackson Minerals started off with many accidents, but it is improving.
B) H & W Energy Resources had fewer accidents on average than Jackson Minerals, but it also had more month-to-month variation.
C) H & W Energy Resources had fewer accidents from 2014 to 2018, and varied less from one month to the next than Jackson Minerals.
D) Jackson Minerals had only about 1/3 as many accidents as H & W Energy Resources, but it had more month-to-month variation.Had more
Question
Table 3.3 Means and Standard Deviations in Monthly Accident Events for Two Mining Companies, 2014-2018
-Refer to Table 3.3. What is the value for the variance of H & W Energy Resources?
A) = 2.43
B) 5.9 - 3.6 = 2.3
C) 5.9 + 3.6 = 9.5
D) 5.92 = 34.81
-Refer to Table 3.3. What is the value for the variance of H & W Energy Resources?
A) = 2.43
B) 5.9 - 3.6 = 2.3
C) 5.9 + 3.6 = 9.5
D) 5.92 = 34.81
Question
Question
Question
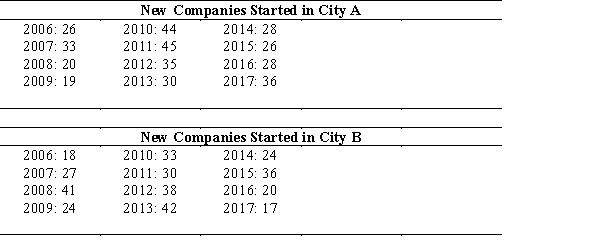
The mayor of a city (City A) was wondering whether her city has shown that more new companies start up in City A than in another city of similar size. She asked her staff to gather the number of new companies started annually in her city from 2006 to 2017. She obtained similar data from her comparison city (City B). Compute the mode, mean, median, range, and standard deviation for both cities.
Question
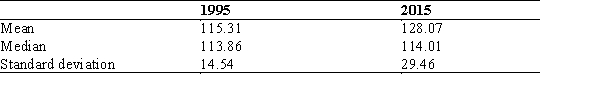
Below is a summary of data about violent crime rates (number of violent crimes per 100,000 population) for a sample of 20 cities in two different years. Describe this statistical information in words. What changes occurred in the overall shape of the distribution for this variable? In central tendency? In dispersion?

Unlock Deck
Sign up to unlock the cards in this deck!
Unlock Deck
Unlock Deck
1/58
Play
Full screen (f)
Deck 3: Measures of Central Tendency and Dispersion
1
What is the purpose of measures of central tendency?
A) to find the most typical value of a distribution of scores
B) to find the most surprising value of a distribution of scores
C) to find the most significant value of a distribution of scores
D) to find the most important value of a distribution of scores
A) to find the most typical value of a distribution of scores
B) to find the most surprising value of a distribution of scores
C) to find the most significant value of a distribution of scores
D) to find the most important value of a distribution of scores
to find the most typical value of a distribution of scores
2
Which of these statements tells why a researcher would report a measure of dispersion?
A) to indicate whether the sample was large enough for statistical inference
B) to indicate whether the sample was representative of the population
C) to indicate the amount of variety within the distribution of scores
D) to indicate what score was typical for the sample
A) to indicate whether the sample was large enough for statistical inference
B) to indicate whether the sample was representative of the population
C) to indicate the amount of variety within the distribution of scores
D) to indicate what score was typical for the sample
to indicate the amount of variety within the distribution of scores
3
Which set of scores shows the greatest level of dispersion?
A) 300, 310, 320
B) 255, 250, 244
C) 175.20, 164.50, 188.30
D) 2, 80, 99
A) 300, 310, 320
B) 255, 250, 244
C) 175.20, 164.50, 188.30
D) 2, 80, 99
2, 80, 99
4
Which measure of central tendency would be the most relevant for summarizing the central tendency of bank executives' gender?
A) mode
B) median
C) interquartile range
D) index of qualitative variation
A) mode
B) median
C) interquartile range
D) index of qualitative variation
Unlock Deck
Unlock for access to all 58 flashcards in this deck.
Unlock Deck
k this deck
5
Which of these statements best represents the index of qualitative variation?
A) the proportion of cases that fall within the category of the mode
B) the most commonly occurring value in the distribution
C) the distance between the highest score and the lowest score
D) the amount of variation observed in a distribution relative to how much variation there could be
A) the proportion of cases that fall within the category of the mode
B) the most commonly occurring value in the distribution
C) the distance between the highest score and the lowest score
D) the amount of variation observed in a distribution relative to how much variation there could be
Unlock Deck
Unlock for access to all 58 flashcards in this deck.
Unlock Deck
k this deck
6
According to the text, why is the mode sometimes not a good representation of the typical score in a distribution?
A) Ordinal and interval-ratio variables lack a mode.
B) The mode is sometimes different from the majority of other scores in the distribution.
C) The mode is sometimes equal to the value of the dispersion.
D) The mode tells us how much cases tend to differ from the middle value rather than reflecting what is most common.
Unlock Deck
Unlock for access to all 58 flashcards in this deck.
Unlock Deck
k this deck
7
Which of the following distributions most clearly illustrates a scenario where the mode fails to represent the central tendency of a distribution?
A) 115, 125, 132, 160, 185, 202
B) 80, 82, 82, 82, 83, 84
C) 315 488, 533, 696, 769, 769
D) 1, 87, 229, 229, 229, 229, 480, 534
A) 115, 125, 132, 160, 185, 202
B) 80, 82, 82, 82, 83, 84
C) 315 488, 533, 696, 769, 769
D) 1, 87, 229, 229, 229, 229, 480, 534
Unlock Deck
Unlock for access to all 58 flashcards in this deck.
Unlock Deck
k this deck
8
Which index of qualitative variation scores shows the least amount of variation in a distribution?
A) 0.08
B) 0.22
C) 0.50
D) 1.00
A) 0.08
B) 0.22
C) 0.50
D) 1.00
Unlock Deck
Unlock for access to all 58 flashcards in this deck.
Unlock Deck
k this deck
9
A researcher has collected data on the citizenship of children in a local preschool. What would be the correct statistic to indicate the diversity of the children in that sample?
A) the interquartile range
B) the index of qualitative variation
C) the median
D) the mode
A) the interquartile range
B) the index of qualitative variation
C) the median
D) the mode
Unlock Deck
Unlock for access to all 58 flashcards in this deck.
Unlock Deck
k this deck
10
A small-scale coffee producer sent out the following number of bags of coffee beans each week over the course of last June: 6, 8, 10, 17. What is the median weekly value for that month?
A) 6.5
B) 8
C) 9
D) 10
A) 6.5
B) 8
C) 9
D) 10
Unlock Deck
Unlock for access to all 58 flashcards in this deck.
Unlock Deck
k this deck
11
Suppose you rank-ordered a set of 49 scores. What would be the median?
A) the 25th case
B) the average of the 24th and 25th cases
C) the average of cases 1-24 added to the average of cases 25-49
D) the summation of each score divided by 49
A) the 25th case
B) the average of the 24th and 25th cases
C) the average of cases 1-24 added to the average of cases 25-49
D) the summation of each score divided by 49
Unlock Deck
Unlock for access to all 58 flashcards in this deck.
Unlock Deck
k this deck
12
A researcher asked 12 people in an apartment building what was their social class: upper-, middle-, or lower-class. What would be an appropriate measure of central tendency for this distribution?
A) range
B) mean
C) median
D) index of qualitative variation
A) range
B) mean
C) median
D) index of qualitative variation
Unlock Deck
Unlock for access to all 58 flashcards in this deck.
Unlock Deck
k this deck
13
A city block has 30 restaurants, all of which are Vietnamese, Korean, or Chinese eateries. What would an index of qualitative variation (IQV) score of 0.40 represent?
A) more dispersion than if the IQV had been 0.60
B) less dispersion than if the IQV had been 0.25
C) The block is 40% as diverse in its restaurants as it could be, given the three types of restaurants present.
D) The block is 60% as diverse in its restaurants as it could be, given the three types of restaurants present.
Unlock Deck
Unlock for access to all 58 flashcards in this deck.
Unlock Deck
k this deck
14
Which of the following is among the problems with using the range (R) as a measure of dispersion?
A) R can be used only for nominal-level variables.
B) R is very difficult to calculate.
C) R ignores the most extreme scores.
D) R is based on only the most extreme scores.
A) R can be used only for nominal-level variables.
B) R is very difficult to calculate.
C) R ignores the most extreme scores.
D) R is based on only the most extreme scores.
Unlock Deck
Unlock for access to all 58 flashcards in this deck.
Unlock Deck
k this deck
15
A researcher reports that $18,000 represents the first quartile of Canadians' incomes. Which of the following is another term he could use to describe that dollar value?
A) median
B) first percentile
C) second percentile
D) 25th percentile
A) median
B) first percentile
C) second percentile
D) 25th percentile
Unlock Deck
Unlock for access to all 58 flashcards in this deck.
Unlock Deck
k this deck
16
What value is equal to the median?
A) It is impossible to tell without knowing the actual scores in the distribution.
B) the first quartile
C) the second percentile
D) the fiftieth percentile
A) It is impossible to tell without knowing the actual scores in the distribution.
B) the first quartile
C) the second percentile
D) the fiftieth percentile
Unlock Deck
Unlock for access to all 58 flashcards in this deck.
Unlock Deck
k this deck
17
An army recruit scored in the 80th percentile of incoming soldiers for a fitness test. What can we conclude about that soldier?
A) The soldier scored higher than 80% of soldiers taking the test.
B) The soldier scored higher than 20% of solders taking the test.
C) The soldier scored 30 points higher on the test than the average soldier.
D) No matter how many soldiers took the test, the soldier beat 20 of them on it.
A) The soldier scored higher than 80% of soldiers taking the test.
B) The soldier scored higher than 20% of solders taking the test.
C) The soldier scored 30 points higher on the test than the average soldier.
D) No matter how many soldiers took the test, the soldier beat 20 of them on it.
Unlock Deck
Unlock for access to all 58 flashcards in this deck.
Unlock Deck
k this deck
18
Which of the following describes the symbol Q3?
A) the third quintile
B) the first quartile
C) the third quartile
D) the third percentile
A) the third quintile
B) the first quartile
C) the third quartile
D) the third percentile
Unlock Deck
Unlock for access to all 58 flashcards in this deck.
Unlock Deck
k this deck
19
The monthly costs of four different one-bedroom apartments are $1,200, $1,050, $1,320, $1,250. What is the median cost?
A) $1,200
B) $1,250
C) the average of $1,200 and $1,250
D) the average of $1,050 and $1,320
A) $1,200
B) $1,250
C) the average of $1,200 and $1,250
D) the average of $1,050 and $1,320
Unlock Deck
Unlock for access to all 58 flashcards in this deck.
Unlock Deck
k this deck
20
When would it be especially appropriate to rely on the interquartile range rather than the range to describe a sample's distribution?
A) when the distribution is symmetrical with no outlying values in the distribution
B) when the distribution is slightly negatively skewed with no outlying values in the distribution
C) when the distribution's mean, median, and mode are nearly equal
D) when there are outlying values in the distribution
Unlock Deck
Unlock for access to all 58 flashcards in this deck.
Unlock Deck
k this deck
21
What is one advantage of the interquartile range (Q) over the range (R)?
A) Q ignores the first and third quartiles.
B) Q can be used for nominal-level variables.
C) Q is based on only the middle 50% of the scores.
D) Q includes the most extreme scores.
A) Q ignores the first and third quartiles.
B) Q can be used for nominal-level variables.
C) Q is based on only the middle 50% of the scores.
D) Q includes the most extreme scores.
Unlock Deck
Unlock for access to all 58 flashcards in this deck.
Unlock Deck
k this deck
22
Which of these variables would be most appropriate for calculating the interquartile range?
A) very happy, somewhat happy, somewhat unhappy, very unhappy
B) left handed, right-handed, ambidextrous
C) political party preference
D) language preference: English, French, other
A) very happy, somewhat happy, somewhat unhappy, very unhappy
B) left handed, right-handed, ambidextrous
C) political party preference
D) language preference: English, French, other
Unlock Deck
Unlock for access to all 58 flashcards in this deck.
Unlock Deck
k this deck
23
What is the purpose of the expression ?(Xi)?
A) to direct the researcher to find the middle score
B) to direct the researcher to find the average of the scores
C) to direct the researcher to find the median of the scores
D) to direct the researcher to find the sum of the scores
A) to direct the researcher to find the middle score
B) to direct the researcher to find the average of the scores
C) to direct the researcher to find the median of the scores
D) to direct the researcher to find the sum of the scores
Unlock Deck
Unlock for access to all 58 flashcards in this deck.
Unlock Deck
k this deck
24
On a survey, age was divided into three categories: younger than 18 years, 18 to 21 years, and older than 21 years. The researcher computed the mean age of the respondents by adding up the scores and then dividing by the number of cases. Why was this a mistake?
A) because the data are interval-ratio and should not be treated as ordinal
B) because the data are only nominal and should not be treated as ordinal
C) because the data are continuous and should not be treated as discrete
D) because the data are ordinal and should not be treated as interval-ratio data
Unlock Deck
Unlock for access to all 58 flashcards in this deck.
Unlock Deck
k this deck
25
Suppose we have yearly unemployment data for OECD countries. Which measure of central tendency would be the most appropriate for this data set?
A) index of qualitative variation
B) dispersion ratio
C) mode
D) mean
A) index of qualitative variation
B) dispersion ratio
C) mode
D) mean
Unlock Deck
Unlock for access to all 58 flashcards in this deck.
Unlock Deck
k this deck
26
How does the standard deviation formula differ for samples and populations?
A) Xi is used to represent the score of a variable in the population; N is used to represent scores in a sample.
B) Xi is used to represent the score of a variable in the sample; N is used to represent scores in a population.
C) ì is used to represent the population mean; is used to represent a sample's mean.
D) Standard deviations can be calculated for samples only, not for populations.
A) Xi is used to represent the score of a variable in the population; N is used to represent scores in a sample.
B) Xi is used to represent the score of a variable in the sample; N is used to represent scores in a population.
C) ì is used to represent the population mean;
is used to represent a sample's mean.D) Standard deviations can be calculated for samples only, not for populations.
Unlock Deck
Unlock for access to all 58 flashcards in this deck.
Unlock Deck
k this deck
27
Which of these statements describes the "least squares" principle?
A) The mean is the point in a distribution around which the variation of the scores is minimized.
B) The range of an interval-ratio-level variable can never exceed the value of its mean.
C) The interquartile range will always contain a variable's median, but not necessarily the variable's mean.
D) Taking the square root of a variable's mean will create a more symmetrical distribution.
Unlock Deck
Unlock for access to all 58 flashcards in this deck.
Unlock Deck
k this deck
28
Which of the following always happens when the mean is subtracted from a set of numbers, and all the differences are summed?
A) The sum is 0.
B) The sum is 1.
C) The sum is equal to the mean.
D) The sum is equal to the variance.
A) The sum is 0.
B) The sum is 1.
C) The sum is equal to the mean.
D) The sum is equal to the variance.
Unlock Deck
Unlock for access to all 58 flashcards in this deck.
Unlock Deck
k this deck
29
What does the expression
instruct us to do?
A) sum the scores
B) subtract every score from the mean
C) sum the scores and then subtract the mean
D) subtract the mean from each score and add up the deviations
instruct us to do?
A) sum the scores
B) subtract every score from the mean
C) sum the scores and then subtract the mean
D) subtract the mean from each score and add up the deviations
Unlock Deck
Unlock for access to all 58 flashcards in this deck.
Unlock Deck
k this deck
30
The mean square footage of a 20-home Ontario suburban neighbourhood is 1,775 square feet. The developers are considering building a 13,500 square-foot mansion on the edge of the neighbourhood. What measure of the neighbourhood's central tendency would be most affected if the mansion was built?
A) the mode
B) the median
C) the mean
D) the variation ratio
A) the mode
B) the median
C) the mean
D) the variation ratio
Unlock Deck
Unlock for access to all 58 flashcards in this deck.
Unlock Deck
k this deck
31
The distribution of student test scores is severely left skewed. What would this mean?
A) that the mean of the distribution is less than the median
B) that the mode of the distribution is less than the median
C) that the median of the distribution is less than the mean
D) that the mode of the distribution is less than the mean
A) that the mean of the distribution is less than the median
B) that the mode of the distribution is less than the median
C) that the median of the distribution is less than the mean
D) that the mode of the distribution is less than the mean
Unlock Deck
Unlock for access to all 58 flashcards in this deck.
Unlock Deck
k this deck
32
A teacher examines the distribution of test scores from a calculus class. She calculates both the median and the mean and discovers that they are equal. What can she conclude?
A) The distribution is negatively skewed.
B) The mode is equal to the standard deviation.
C) The distribution is symmetrical.
D) The range is equal to the interquartile range.
A) The distribution is negatively skewed.
B) The mode is equal to the standard deviation.
C) The distribution is symmetrical.
D) The range is equal to the interquartile range.
Unlock Deck
Unlock for access to all 58 flashcards in this deck.
Unlock Deck
k this deck
33
What is the term for a distribution that has its peak on the left and a tail extending far to the right?
A) positively skewed
B) negatively skewed
C) normally distributed
D) bimodally distributed
A) positively skewed
B) negatively skewed
C) normally distributed
D) bimodally distributed
Unlock Deck
Unlock for access to all 58 flashcards in this deck.
Unlock Deck
k this deck
34
In an election campaign debate about the level of prosperity in Canada, the Prime Minister says, "Average income is $53,000." One of his opponents responds, "The average Canadian earns only $38,000." Both statements are true. Why is it possible that both statements are true?
A) because the opponent is using the mean
B) because the Prime Minister is using the mean
C) because the Prime Minister is citing the median
D) because the opponent is using the mode
A) because the opponent is using the mean
B) because the Prime Minister is using the mean
C) because the Prime Minister is citing the median
D) because the opponent is using the mode
Unlock Deck
Unlock for access to all 58 flashcards in this deck.
Unlock Deck
k this deck
35
Which of these terms is the preferred measure of central tendency for the variable income distribution, which almost always has a positive skew?
A) range
B) median
C) mode
D) mean
A) range
B) median
C) mode
D) mean
Unlock Deck
Unlock for access to all 58 flashcards in this deck.
Unlock Deck
k this deck
36
The mean height of a 22-member university women's hockey team is 175.2 cm. If we subtracted each of the 22 players' heights from the mean value and added these differences together, what would the overall sum of the deviations be?
A) It is impossible to tell from the information given.
B) 0
C) 175.20/2 = 87.60
D) 175.20
A) It is impossible to tell from the information given.
B) 0
C) 175.20/2 = 87.60
D) 175.20
Unlock Deck
Unlock for access to all 58 flashcards in this deck.
Unlock Deck
k this deck
37
The distribution of film genre preferences in a retirement community of 150 seniors is as follows: Drama-37%; Comedy-32%; Musicals-8%; Action-18%; Documentaries-5%. Why is it impossible to calculate a standard deviation for this variable?
A) The variable's categories are not mutually exclusive.
B) The variable's categories do not sum to 100%.
C) The variable is too skewed to calculate the variance.
D) The variable does not have a mean value.
A) The variable's categories are not mutually exclusive.
B) The variable's categories do not sum to 100%.
C) The variable is too skewed to calculate the variance.
D) The variable does not have a mean value.
Unlock Deck
Unlock for access to all 58 flashcards in this deck.
Unlock Deck
k this deck
38
Environmental violations for 16 companies ranged from values of 11 to 97. The variance was 14. How should we calculate the standard deviation for this distribution?
A) = 4
B) (97 - 11) × 14 = 1204
C) 142 = 196
D) = 3.74
A) = 4
B) (97 - 11) × 14 = 1204
C) 142 = 196
D) = 3.74
Unlock Deck
Unlock for access to all 58 flashcards in this deck.
Unlock Deck
k this deck
39
What would be an appropriate measure of dispersion for a set of values of people's ages, measured in years?
A) the mean
B) the mode
C) the standard quartile
D) the standard deviation
A) the mean
B) the mode
C) the standard quartile
D) the standard deviation
Unlock Deck
Unlock for access to all 58 flashcards in this deck.
Unlock Deck
k this deck
40
What can we conclude about a set of scores in which the mean is 18 and the standard deviation is 0?
A) The range is also 0.
B) The range is equal to 1.
C) The variance is smaller than the standard deviation.
D) The variance is larger than the standard deviation.
A) The range is also 0.
B) The range is equal to 1.
C) The variance is smaller than the standard deviation.
D) The variance is larger than the standard deviation.
Unlock Deck
Unlock for access to all 58 flashcards in this deck.
Unlock Deck
k this deck
41
Which of the following is the lowest valid score for a standard deviation?
A) -3
B) -1
C) 0
D) 0.5
A) -3
B) -1
C) 0
D) 0.5
Unlock Deck
Unlock for access to all 58 flashcards in this deck.
Unlock Deck
k this deck
42
Which of these statements describes the difference between variance and standard deviation?
A) Variance is an indicator of dispersion; standard deviation is an indicator of central tendency.
B) Standard deviations are more affected by outlying values than are variances.
C) Standard deviations are always smaller than variances when variance >1.
D) There are no differences: the terms are synonyms.
Unlock Deck
Unlock for access to all 58 flashcards in this deck.
Unlock Deck
k this deck
43
Suppose low variability in a runner's heart rate during a long distance run is a good indication of cardiopulmonary fitness. Which of these statistics measuring pulse rates during a 20 km run would be best?
A) standard deviation = 0.25 beats per minute
B) standard deviation = 0.75 beats per minute
C) standard deviation = 1.6 beats per minute
D) standard deviation = 2.2 beats per minute
A) standard deviation = 0.25 beats per minute
B) standard deviation = 0.75 beats per minute
C) standard deviation = 1.6 beats per minute
D) standard deviation = 2.2 beats per minute
Unlock Deck
Unlock for access to all 58 flashcards in this deck.
Unlock Deck
k this deck
44
Suppose a distribution has an outlying value far smaller than the other values in the distribution. What will happen to the standard deviation if the outlier is removed?
A) It will necessarily diminish.
B) It will not change.
C) It will necessarily increase.
D) It is impossible to say without knowing the actual values in the distribution.
A) It will necessarily diminish.
B) It will not change.
C) It will necessarily increase.
D) It is impossible to say without knowing the actual values in the distribution.
Unlock Deck
Unlock for access to all 58 flashcards in this deck.
Unlock Deck
k this deck
45
Researchers wish to compare the dispersion of student grades across eight universities of varying sizes. What strategy would allow them to properly compare grade dispersion across the eight distributions?
A) adding up the deviations for the smallest and the largest university
B) dividing the squared deviations by the number of cases (N) for each university
C) calculating the mode for each of the eight universities
D) calculating the median for each of the eight universities
A) adding up the deviations for the smallest and the largest university
B) dividing the squared deviations by the number of cases (N) for each university
C) calculating the mode for each of the eight universities
D) calculating the median for each of the eight universities
Unlock Deck
Unlock for access to all 58 flashcards in this deck.
Unlock Deck
k this deck
46
What is the one central tendency statistic that can be accurately calculated for nominal, ordinal, and interval-ratio variables?
A) mode
B) median
C) mean
D) variance
A) mode
B) median
C) mean
D) variance
Unlock Deck
Unlock for access to all 58 flashcards in this deck.
Unlock Deck
k this deck
47
Table 3.1 Data Set of Six Volunteers at a Charitable Organization
-Refer to Table 3.1. What is the mode of employment status?
A) student
B) part-time worker
C) full-time worker
D) There is no mode for this distribution.
-Refer to Table 3.1. What is the mode of employment status?
A) student
B) part-time worker
C) full-time worker
D) There is no mode for this distribution.
Unlock Deck
Unlock for access to all 58 flashcards in this deck.
Unlock Deck
k this deck
48
Table 3.1 Data Set of Six Volunteers at a Charitable Organization
-Refer to Table 3.1. What is the median of employment status?
A) full-time worker
B) student
C) part-time worker
D) There is no valid median score.
-Refer to Table 3.1. What is the median of employment status?
A) full-time worker
B) student
C) part-time worker
D) There is no valid median score.
Unlock Deck
Unlock for access to all 58 flashcards in this deck.
Unlock Deck
k this deck
49
Table 3.1 Data Set of Six Volunteers at a Charitable Organization
-Refer to Table 3.1. What is the mean of years served in the organization?
A) 2
B) 2.5
C) 3
D) 5
-Refer to Table 3.1. What is the mean of years served in the organization?
A) 2
B) 2.5
C) 3
D) 5
Unlock Deck
Unlock for access to all 58 flashcards in this deck.
Unlock Deck
k this deck
50
Table 3.1 Data Set of Six Volunteers at a Charitable Organization
-Refer to Table 3.1. What is the median of years served in the organization?
A) 2
B) 2.5
C) 3
D) 5
-Refer to Table 3.1. What is the median of years served in the organization?
A) 2
B) 2.5
C) 3
D) 5
Unlock Deck
Unlock for access to all 58 flashcards in this deck.
Unlock Deck
k this deck
51
Table 3.2 Park Space in Five Neighbourhoods of a Fictional City
-Refer to Table 3.2. Which of the following describes the distribution of park space?
A) negatively skewed
B) positively skewed
C) symmetric
D) unclear from the information given
-Refer to Table 3.2. Which of the following describes the distribution of park space?
A) negatively skewed
B) positively skewed
C) symmetric
D) unclear from the information given
Unlock Deck
Unlock for access to all 58 flashcards in this deck.
Unlock Deck
k this deck
52
Table 3.2 Park Space in Five Neighbourhoods of a Fictional City
-Refer to Table 3.2. What would be the most appropriate measure of central tendency for the distribution of park space?
A) the mode
B) the median
C) the mean
D) the interquartile range
-Refer to Table 3.2. What would be the most appropriate measure of central tendency for the distribution of park space?
A) the mode
B) the median
C) the mean
D) the interquartile range
Unlock Deck
Unlock for access to all 58 flashcards in this deck.
Unlock Deck
k this deck
53
Table 3.3 Means and Standard Deviations in Monthly Accident Events for Two Mining Companies, 2014-2018
-Refer to Table 3.3. Which of the following could we conclude from these data?
A) Jackson Minerals started off with many accidents, but it is improving.
B) H & W Energy Resources had fewer accidents on average than Jackson Minerals, but it also had more month-to-month variation.
C) H & W Energy Resources had fewer accidents from 2014 to 2018, and varied less from one month to the next than Jackson Minerals.
D) Jackson Minerals had only about 1/3 as many accidents as H & W Energy Resources, but it had more month-to-month variation.Had more
Unlock Deck
Unlock for access to all 58 flashcards in this deck.
Unlock Deck
k this deck
54
Table 3.3 Means and Standard Deviations in Monthly Accident Events for Two Mining Companies, 2014-2018
-Refer to Table 3.3. What is the value for the variance of H & W Energy Resources?
A) = 2.43
B) 5.9 - 3.6 = 2.3
C) 5.9 + 3.6 = 9.5
D) 5.92 = 34.81
-Refer to Table 3.3. What is the value for the variance of H & W Energy Resources?
A) = 2.43
B) 5.9 - 3.6 = 2.3
C) 5.9 + 3.6 = 9.5
D) 5.92 = 34.81
Unlock Deck
Unlock for access to all 58 flashcards in this deck.
Unlock Deck
k this deck
55
Describe what a boxplot portrays and explain what its "whiskers" are.
Unlock Deck
Unlock for access to all 58 flashcards in this deck.
Unlock Deck
k this deck
56
What is the difference between central tendency and dispersion in a distribution of data?
Unlock Deck
Unlock for access to all 58 flashcards in this deck.
Unlock Deck
k this deck
57
The mayor of a city (City A) was wondering whether her city has shown that more new companies start up in City A than in another city of similar size. She asked her staff to gather the number of new companies started annually in her city from 2006 to 2017. She obtained similar data from her comparison city (City B). Compute the mode, mean, median, range, and standard deviation for both cities.
Unlock Deck
Unlock for access to all 58 flashcards in this deck.
Unlock Deck
k this deck
58
Below is a summary of data about violent crime rates (number of violent crimes per 100,000 population) for a sample of 20 cities in two different years. Describe this statistical information in words. What changes occurred in the overall shape of the distribution for this variable? In central tendency? In dispersion?
Unlock Deck
Unlock for access to all 58 flashcards in this deck.
Unlock Deck
k this deck
Unlock Deck
Unlock for access to all 58 flashcards in this deck.


