Deck 4: Cost and Production
Full screen (f)
Question
Question
Question
Question
Question
Question
Question
Question
Question
Question
Question
Question
Question
Question
Question
Question
Question
Question
Question
Question
Question
Question
Question
Figure 4-2
The following figure shows the cost curves of a firm producing good X.
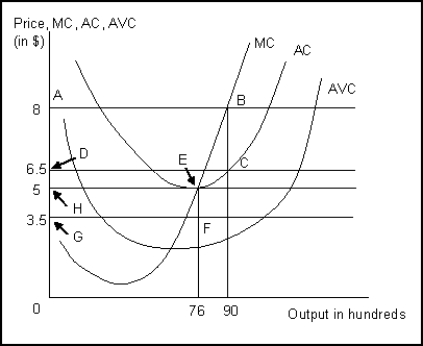
Refer to Figure 4-2.The area EFGH is:
A)the loss incurred by the firm when market price is $3.5.
B)the profit earned by the firm when the market price is $3.5.
C)the loss incurred by the firm when the market price is $5.
D)the revenue earned by the firm when the market price is $5.
The following figure shows the cost curves of a firm producing good X.
Refer to Figure 4-2.The area EFGH is:
A)the loss incurred by the firm when market price is $3.5.
B)the profit earned by the firm when the market price is $3.5.
C)the loss incurred by the firm when the market price is $5.
D)the revenue earned by the firm when the market price is $5.
Question
Question
Figure 4-1
The following figure shows the marginal cost curve (MC) for a firm producing fancy dolls for children.The market price for a doll is $4 per unit.
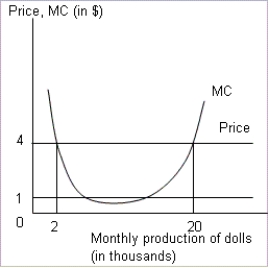
Refer to Figure 4-1.If the market price declined to $1 per doll, which of the following statements will be true?
A)The firm is unlikely to produce because the marginal cost of production is higher than $1.
B)The firm will produce less than 2,000 dolls in a month.
C)The profit from producing in the range where price is greater than marginal cost is unlikely to cover the loss of the initial levels of production.
D)The firm will earn high revenue as quantity demanded of dolls in the market rises substantially.
The following figure shows the marginal cost curve (MC) for a firm producing fancy dolls for children.The market price for a doll is $4 per unit.
Refer to Figure 4-1.If the market price declined to $1 per doll, which of the following statements will be true?
A)The firm is unlikely to produce because the marginal cost of production is higher than $1.
B)The firm will produce less than 2,000 dolls in a month.
C)The profit from producing in the range where price is greater than marginal cost is unlikely to cover the loss of the initial levels of production.
D)The firm will earn high revenue as quantity demanded of dolls in the market rises substantially.
Question
Question
Question
Question
Question
Question
Question
Figure 4-3
The following figure shows two isocost lines ( and
and  ) and two isoquants for the production of 200 and 350 tons of corn.The axes show the quantities of the two types of fertilizers used in corn production.
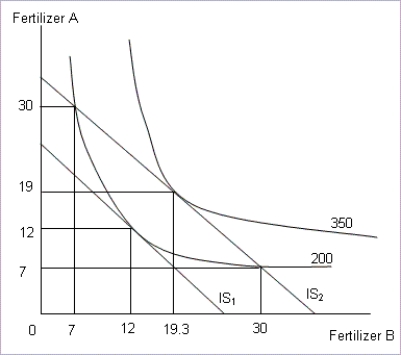
Refer to Figure 4-3.An increase in the slope of an isocost implies:
A)the firm is using more of the input measured on the X-axis.
B)the total cost incurred by the firm has declined.
C)the input measured on the X-axis has become costlier.
D)the price of both inputs has declined.
The following figure shows two isocost lines (
and ) and two isoquants for the production of 200 and 350 tons of corn.The axes show the quantities of the two types of fertilizers used in corn production.Refer to Figure 4-3.An increase in the slope of an isocost implies:
A)the firm is using more of the input measured on the X-axis.
B)the total cost incurred by the firm has declined.
C)the input measured on the X-axis has become costlier.
D)the price of both inputs has declined.
Question
Figure 4-1
The following figure shows the marginal cost curve (MC) for a firm producing fancy dolls for children.The market price for a doll is $4 per unit.
Refer to Figure 4-1.If the firm produces 2,000 dolls per month when the market price is $4:
A)it will incur a loss.
B)it will earn maximum profit.
C)it will minimize cost on inputs.
D)it will earn the highest revenue.
Question
Figure 4-3
The following figure shows two isocost lines ( and ) and two isoquants for the production of 200 and 350 tons of corn.The axes show the quantities of the two types of fertilizers used in corn production.
Refer to Figure 4-3.Identify the least-cost combinations of fertilizers A and B for producing 200 tons of corn.
A)30 units of fertilizer A and 7 units of fertilizer B
B)7 units of fertilizer A and 30 units of fertilizer B
C)19 units of fertilizer A and19.3 units of fertilizer B
D)12 units of fertilizer A and 12 units of fertilizer B
The following figure shows two isocost lines (
and ) and two isoquants for the production of 200 and 350 tons of corn.The axes show the quantities of the two types of fertilizers used in corn production.Refer to Figure 4-3.Identify the least-cost combinations of fertilizers A and B for producing 200 tons of corn.
A)30 units of fertilizer A and 7 units of fertilizer B
B)7 units of fertilizer A and 30 units of fertilizer B
C)19 units of fertilizer A and19.3 units of fertilizer B
D)12 units of fertilizer A and 12 units of fertilizer B
Question
Figure 4-2
The following figure shows the cost curves of a firm producing good X.
Refer to Figure 4-2.What does the area ABCD signify?
A)The total revenue earned when the market price is $8 per unit of X.
B)The total profit earned when the market price is $8 per unit of X.
C)The total revenue earned when the market price is $5 per unit of X.
D)The total profit earned when the market price is $5 per unit of X.
Question
Question
Figure 4-1
The following figure shows the marginal cost curve (MC) for a firm producing fancy dolls for children.The market price for a doll is $4 per unit.
Refer to Figure 4-1.Identify the correct statement from the following.Assume that the firm is trying to maximize profit and faces a $4 market price for dolls.
A)The firm will produce 2,000 dolls per month.
B)The firm's profit declines as the firm expands production beyond 2,000 dolls per month.
C)The firm's profit rises as the firm expands production beyond 20,000 dolls per month.
D)The firm will produce 20,000 dolls per month.
Question
Figure 4-2
The following figure shows the cost curves of a firm producing good X.
Refer to Figure 4-2.Identify the supply curve of the firm.
A)It is given by the MC curve.
B)It is given by the vertical axis for price below minimum AVC and the upward-sloping portion of the MC curve for prices above minimum AVC.
C)It is given by the vertical axis for price below minimum AC and the upward-sloping portion of the MC curve for prices above minimum AC.
D)It is given by the portion of the MC above point E.
Question
Figure 4-3
The following figure shows two isocost lines ( and ) and two isoquants for the production of 200 and 350 tons of corn.The axes show the quantities of the two types of fertilizers used in corn production.
Refer to Figure 4-3.Which of the following statements will be true?
A)No combination of fertilizers A and B on ɪs₁ can achieve a production level of 350 tons of corn.
B)All combinations of fertilizers on ɪs₂ can efficiently produce any level of output below 350 tons of corn.
C)The highest isocost ɪs₂ is more than just enough to produce 350 tons of corn.
D)The lowest isocost ɪs₁ is more than just enough to produce 200 tons of corn.
The following figure shows two isocost lines (
and ) and two isoquants for the production of 200 and 350 tons of corn.The axes show the quantities of the two types of fertilizers used in corn production.Refer to Figure 4-3.Which of the following statements will be true?
A)No combination of fertilizers A and B on ɪs₁ can achieve a production level of 350 tons of corn.
B)All combinations of fertilizers on ɪs₂ can efficiently produce any level of output below 350 tons of corn.
C)The highest isocost ɪs₂ is more than just enough to produce 350 tons of corn.
D)The lowest isocost ɪs₁ is more than just enough to produce 200 tons of corn.
Question
Question
Question
Figure 4-4
The following figure shows three different plant sizes and short-run average cost curves (SRAC), along with the long-run average cost curve (LRAC) for the industry.
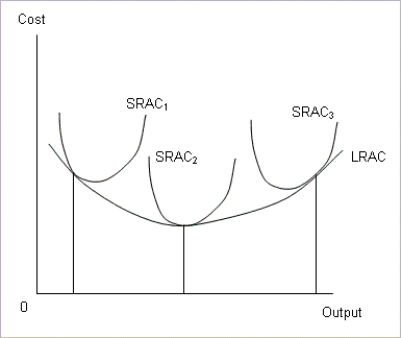
Refer to Figure 4-4.Which of the following statements is true?
A)is inefficiently large.
B)is inefficiently small for this market.
C)is likely to survive the competition with unchanged plant size.
D)and can improve their cost structures by resizing their plants to .
The following figure shows three different plant sizes and short-run average cost curves (SRAC), along with the long-run average cost curve (LRAC) for the industry.
Refer to Figure 4-4.Which of the following statements is true?
A)is inefficiently large.
B)is inefficiently small for this market.
C)is likely to survive the competition with unchanged plant size.
D)and can improve their cost structures by resizing their plants to .
Question
Question
Question
Question
Question
Question
Question
Question
Question
Question
Question
Question
Question
Question
Question
Question
Question
Question
Question
Question
Question
Question
Question
Question
Question

Unlock Deck
Sign up to unlock the cards in this deck!
Unlock Deck
Unlock Deck
1/67
Play
Full screen (f)
Deck 4: Cost and Production
1
If decreasing long-run average cost is inherent in an industry's technology, then only one supplier can satisfy the entire market.
True
2
You decide that it is time to buy a big family car.The opportunity cost you consider is:
A)the cost of the car.
B)the increase in comfort for your family while traveling.
C)the return this money would have earned if it was invested otherwise.
D)the inconvenience you and your family are bearing on account of your old car.
A)the cost of the car.
B)the increase in comfort for your family while traveling.
C)the return this money would have earned if it was invested otherwise.
D)the inconvenience you and your family are bearing on account of your old car.
C
3
An isoquant is the locus of the different combinations of inputs that produce the same level of output.
True
4
Burkes Inc.should stop production in the short run if the market price of its product is less than its average total cost of production.
Unlock Deck
Unlock for access to all 67 flashcards in this deck.
Unlock Deck
k this deck
5
The production function shows:
A)the total cost incurred to produce a certain level of output.
B)the changes in cost incurred as output level varies.
C)the relationship between inputs used and output produced.
D)the impact of a change in production on the firm's revenues.
A)the total cost incurred to produce a certain level of output.
B)the changes in cost incurred as output level varies.
C)the relationship between inputs used and output produced.
D)the impact of a change in production on the firm's revenues.
Unlock Deck
Unlock for access to all 67 flashcards in this deck.
Unlock Deck
k this deck
6
Gemma and Emily expect investments A and B to yield an annual return of 15 percent and 10 percent respectively.While Gemma invests in A, Emily invests in B.This implies that Gemma has a higher risk tolerance than Emily.
Unlock Deck
Unlock for access to all 67 flashcards in this deck.
Unlock Deck
k this deck
7
The increased participation of married women in the work force reflects the increasing opportunity cost of not working.
Unlock Deck
Unlock for access to all 67 flashcards in this deck.
Unlock Deck
k this deck
8
Which of the following statements is true about the total product curve?
A)If input usage expands uniformly throughout the stages of production, then the slope of the total product curve is one.
B)The total product curve is inverted U-shaped.
C)As input usage gradually expands from low levels, total output begins to rise at an increasing pace.
D)If the use of inputs is too high at the initial stage of production, then the total prod-uct curve becomes horizontal.
Unlock Deck
Unlock for access to all 67 flashcards in this deck.
Unlock Deck
k this deck
9
If a firm is minimizing the cost of producing its chosen level of output, the marginal product of the last dollar spent on each input should be equal.
Unlock Deck
Unlock for access to all 67 flashcards in this deck.
Unlock Deck
k this deck
10
The slope of the total variable cost curve gives the average cost of production.
Unlock Deck
Unlock for access to all 67 flashcards in this deck.
Unlock Deck
k this deck
11
You withdraw some of your savings to invest in a new business venture.Which of the following statements is true?
A)The return you will earn from this new investment is your opportunity cost.
B)The interest rate you would have earned in the bank is higher than the return from this investment.
C)The return you expect to earn from this new investment must exceed your opportunity cost.
D)The return you expect to earn from this new investment must equal your opportunity cost.
Unlock Deck
Unlock for access to all 67 flashcards in this deck.
Unlock Deck
k this deck
12
The relationship between inputs used by a firm and output produced is given by the cost function.
Unlock Deck
Unlock for access to all 67 flashcards in this deck.
Unlock Deck
k this deck
13
The expansion path shows the lowest cost combinations of inputs for producing different levels of output.
Unlock Deck
Unlock for access to all 67 flashcards in this deck.
Unlock Deck
k this deck
14
When average variable cost is at its minimum, it is equal to the marginal cost of production at that level of output.
Unlock Deck
Unlock for access to all 67 flashcards in this deck.
Unlock Deck
k this deck
15
A tax accountant categorizes costs in conformity with rules of the Securities and Exchange Commission and the Financial Accounting Standards Board so that investors can better compare the records and prospects of different companies.
Unlock Deck
Unlock for access to all 67 flashcards in this deck.
Unlock Deck
k this deck
16
The cost of two inputs A and B are $100 and $200 per unit per month.A firm can afford to invest $10,000 per month on these inputs.The firm uses 30 units of A.Given a linear isocost such that the entire budget is exhausted, the firm will use 10 units of B.
Unlock Deck
Unlock for access to all 67 flashcards in this deck.
Unlock Deck
k this deck
17
The downward-sloping portion of the marginal cost curve is the only portion that matters in production.
Unlock Deck
Unlock for access to all 67 flashcards in this deck.
Unlock Deck
k this deck
18
The marginal cost curve intersects the average total cost and average variable cost curves at their minimum points.
Unlock Deck
Unlock for access to all 67 flashcards in this deck.
Unlock Deck
k this deck
19
If all inputs are raised by equal percentages and output increases by a larger percentage, there are decreasing returns to scale.
Unlock Deck
Unlock for access to all 67 flashcards in this deck.
Unlock Deck
k this deck
20
Investments with _____ risk usually carry a _____ return.
A)higher; lower
B)lower; higher
C)zero; high
D)higher; higher
A)higher; lower
B)lower; higher
C)zero; high
D)higher; higher
Unlock Deck
Unlock for access to all 67 flashcards in this deck.
Unlock Deck
k this deck
21
Isoquants reflect the fact that in the long run:
A)inputs can be substituted for each other.
B)a fixed set of inputs can produce different levels of output.
C)inputs used in production are complementary in nature.
D)different levels of input can be used to satisfy a budget constraint.
A)inputs can be substituted for each other.
B)a fixed set of inputs can produce different levels of output.
C)inputs used in production are complementary in nature.
D)different levels of input can be used to satisfy a budget constraint.
Unlock Deck
Unlock for access to all 67 flashcards in this deck.
Unlock Deck
k this deck
22
Jeff owns a garage and has 3 mechanics to help him.With the tools used being fixed in the short run, his production function is given by 5 + 2L = Y , where L is the number of mechanics and Y is the number of cars they can fix.If Jeff hires a fourth mechanic, what will be the marginal product of the new mechanic hired?
A)11
B)13
C)2
D)7
A)11
B)13
C)2
D)7
Unlock Deck
Unlock for access to all 67 flashcards in this deck.
Unlock Deck
k this deck
23
Figure 4-2
The following figure shows the cost curves of a firm producing good X.
Refer to Figure 4-2.The area EFGH is:
A)the loss incurred by the firm when market price is $3.5.
B)the profit earned by the firm when the market price is $3.5.
C)the loss incurred by the firm when the market price is $5.
D)the revenue earned by the firm when the market price is $5.
Unlock Deck
Unlock for access to all 67 flashcards in this deck.
Unlock Deck
k this deck
24
A firm uses two inputs, labor (L) and capital (K) in the production of umbrellas.It can invest $50,000 in the purchase of the two inputs annually.The firm hires 5 units of capital at $1,000 per unit.If the going annual wage rate is $4,500, calculate the number of workers employed by the firm.(Assume that the firm spends the entire budget on K and L.)
A)10
B)5
C)15
D)9
A)10
B)5
C)15
D)9
Unlock Deck
Unlock for access to all 67 flashcards in this deck.
Unlock Deck
k this deck
25
Figure 4-1
The following figure shows the marginal cost curve (MC) for a firm producing fancy dolls for children.The market price for a doll is $4 per unit.
Refer to Figure 4-1.If the market price declined to $1 per doll, which of the following statements will be true?
A)The firm is unlikely to produce because the marginal cost of production is higher than $1.
B)The firm will produce less than 2,000 dolls in a month.
C)The profit from producing in the range where price is greater than marginal cost is unlikely to cover the loss of the initial levels of production.
D)The firm will earn high revenue as quantity demanded of dolls in the market rises substantially.
Unlock Deck
Unlock for access to all 67 flashcards in this deck.
Unlock Deck
k this deck
26
_____ gives the slope of an isocost line where labor (L) and capital (K) are the two inputs measured on the X and Y axes respectively.
A)The ratio of the marginal product of capital to the marginal product of labor, with a negative sign,
B)The ratio of price of labor to the price of capital, with a negative sign,
C)The ratio of the price of capital to the price of labor
D)The ratio of the marginal product of labor to the marginal product of capital
Unlock Deck
Unlock for access to all 67 flashcards in this deck.
Unlock Deck
k this deck
27
The gap between average total cost and average variable cost:
A)is constant at all ranges of output.
B)is high at high levels of production.
C)declines as output expands.
D)depends on the production technology.
A)is constant at all ranges of output.
B)is high at high levels of production.
C)declines as output expands.
D)depends on the production technology.
Unlock Deck
Unlock for access to all 67 flashcards in this deck.
Unlock Deck
k this deck
28
The market price of the product produced by Jones Inc., is $6 per unit, which is higher than the average cost of $4 per unit at the profit maximizing output level.The average variable cost of production is $3.5 per unit.If demand for its product declines due to introduction of cheaper substitutes and the market price of the product falls to $3.8 per unit, which of the following statements will be true?
A)The firm will close down in the short run.
B)The firm will continue production as long as the market price is above average variable cost.
C)The firm will continue production as long as the market price exceeds fixed cost.
D)The firm will minimize it losses by producing where average variable cost equals $3.8.
Unlock Deck
Unlock for access to all 67 flashcards in this deck.
Unlock Deck
k this deck
29
At outputs less than the minimum of average variable cost:
A)marginal cost is greater than average variable cost.
B)marginal cost is less than average variable cost.
C)marginal cost is equal to average variable cost.
D)marginal cost is parallel to average variable cost.
A)marginal cost is greater than average variable cost.
B)marginal cost is less than average variable cost.
C)marginal cost is equal to average variable cost.
D)marginal cost is parallel to average variable cost.
Unlock Deck
Unlock for access to all 67 flashcards in this deck.
Unlock Deck
k this deck
30
The average cost of production at the profit maximizing output level for Jones Inc., is $4 per unit.The average variable cost of production is $3.5 per unit at this output level.The introduction of cheaper substitutes reduces the demand drastically and the market price falls to $1.5 per unit.If the minimum average variable cost the firm must incur is $2.5, identify the correct statement from the following.
A)There are output levels where revenue exceeds variable cost when the price is $1.5 per unit.
B)The firm will continue to operate in the short run.
C)The firm will breakeven at the price of $1.5 per unit.
D)The firm will shut down.
A)There are output levels where revenue exceeds variable cost when the price is $1.5 per unit.
B)The firm will continue to operate in the short run.
C)The firm will breakeven at the price of $1.5 per unit.
D)The firm will shut down.
Unlock Deck
Unlock for access to all 67 flashcards in this deck.
Unlock Deck
k this deck
31
If the slope of the rays from the origin to the total variable cost curve declines along the curve, it implies:
A)the average variable cost is falling.
B)the marginal cost is falling.
C)the average variable cost is rising.
D)the marginal cost is rising.
A)the average variable cost is falling.
B)the marginal cost is falling.
C)the average variable cost is rising.
D)the marginal cost is rising.
Unlock Deck
Unlock for access to all 67 flashcards in this deck.
Unlock Deck
k this deck
32
Figure 4-3
The following figure shows two isocost lines ( and ) and two isoquants for the production of 200 and 350 tons of corn.The axes show the quantities of the two types of fertilizers used in corn production.
Refer to Figure 4-3.An increase in the slope of an isocost implies:
A)the firm is using more of the input measured on the X-axis.
B)the total cost incurred by the firm has declined.
C)the input measured on the X-axis has become costlier.
D)the price of both inputs has declined.
The following figure shows two isocost lines (
and ) and two isoquants for the production of 200 and 350 tons of corn.The axes show the quantities of the two types of fertilizers used in corn production.Refer to Figure 4-3.An increase in the slope of an isocost implies:
A)the firm is using more of the input measured on the X-axis.
B)the total cost incurred by the firm has declined.
C)the input measured on the X-axis has become costlier.
D)the price of both inputs has declined.
Unlock Deck
Unlock for access to all 67 flashcards in this deck.
Unlock Deck
k this deck
33
Figure 4-1
The following figure shows the marginal cost curve (MC) for a firm producing fancy dolls for children.The market price for a doll is $4 per unit.
Refer to Figure 4-1.If the firm produces 2,000 dolls per month when the market price is $4:
A)it will incur a loss.
B)it will earn maximum profit.
C)it will minimize cost on inputs.
D)it will earn the highest revenue.
Unlock Deck
Unlock for access to all 67 flashcards in this deck.
Unlock Deck
k this deck
34
Figure 4-3
The following figure shows two isocost lines ( and ) and two isoquants for the production of 200 and 350 tons of corn.The axes show the quantities of the two types of fertilizers used in corn production.
Refer to Figure 4-3.Identify the least-cost combinations of fertilizers A and B for producing 200 tons of corn.
A)30 units of fertilizer A and 7 units of fertilizer B
B)7 units of fertilizer A and 30 units of fertilizer B
C)19 units of fertilizer A and19.3 units of fertilizer B
D)12 units of fertilizer A and 12 units of fertilizer B
The following figure shows two isocost lines (
and ) and two isoquants for the production of 200 and 350 tons of corn.The axes show the quantities of the two types of fertilizers used in corn production.Refer to Figure 4-3.Identify the least-cost combinations of fertilizers A and B for producing 200 tons of corn.
A)30 units of fertilizer A and 7 units of fertilizer B
B)7 units of fertilizer A and 30 units of fertilizer B
C)19 units of fertilizer A and19.3 units of fertilizer B
D)12 units of fertilizer A and 12 units of fertilizer B
Unlock Deck
Unlock for access to all 67 flashcards in this deck.
Unlock Deck
k this deck
35
Figure 4-2
The following figure shows the cost curves of a firm producing good X.
Refer to Figure 4-2.What does the area ABCD signify?
A)The total revenue earned when the market price is $8 per unit of X.
B)The total profit earned when the market price is $8 per unit of X.
C)The total revenue earned when the market price is $5 per unit of X.
D)The total profit earned when the market price is $5 per unit of X.
Unlock Deck
Unlock for access to all 67 flashcards in this deck.
Unlock Deck
k this deck
36
An isocost line depicts:
A)the minimum cost required to produce a certain level of output, given input prices.
B)the input combination to produce a certain level of output.
C)the input combinations that satisfy a budget constraint, given input prices.
D)the maximum output that can be produced by a firm given its budget constraint.
Unlock Deck
Unlock for access to all 67 flashcards in this deck.
Unlock Deck
k this deck
37
Figure 4-1
The following figure shows the marginal cost curve (MC) for a firm producing fancy dolls for children.The market price for a doll is $4 per unit.
Refer to Figure 4-1.Identify the correct statement from the following.Assume that the firm is trying to maximize profit and faces a $4 market price for dolls.
A)The firm will produce 2,000 dolls per month.
B)The firm's profit declines as the firm expands production beyond 2,000 dolls per month.
C)The firm's profit rises as the firm expands production beyond 20,000 dolls per month.
D)The firm will produce 20,000 dolls per month.
Unlock Deck
Unlock for access to all 67 flashcards in this deck.
Unlock Deck
k this deck
38
Figure 4-2
The following figure shows the cost curves of a firm producing good X.
Refer to Figure 4-2.Identify the supply curve of the firm.
A)It is given by the MC curve.
B)It is given by the vertical axis for price below minimum AVC and the upward-sloping portion of the MC curve for prices above minimum AVC.
C)It is given by the vertical axis for price below minimum AC and the upward-sloping portion of the MC curve for prices above minimum AC.
D)It is given by the portion of the MC above point E.
Unlock Deck
Unlock for access to all 67 flashcards in this deck.
Unlock Deck
k this deck
39
Figure 4-3
The following figure shows two isocost lines ( and ) and two isoquants for the production of 200 and 350 tons of corn.The axes show the quantities of the two types of fertilizers used in corn production.
Refer to Figure 4-3.Which of the following statements will be true?
A)No combination of fertilizers A and B on ɪs₁ can achieve a production level of 350 tons of corn.
B)All combinations of fertilizers on ɪs₂ can efficiently produce any level of output below 350 tons of corn.
C)The highest isocost ɪs₂ is more than just enough to produce 350 tons of corn.
D)The lowest isocost ɪs₁ is more than just enough to produce 200 tons of corn.
The following figure shows two isocost lines (
and ) and two isoquants for the production of 200 and 350 tons of corn.The axes show the quantities of the two types of fertilizers used in corn production.Refer to Figure 4-3.Which of the following statements will be true?
A)No combination of fertilizers A and B on ɪs₁ can achieve a production level of 350 tons of corn.
B)All combinations of fertilizers on ɪs₂ can efficiently produce any level of output below 350 tons of corn.
C)The highest isocost ɪs₂ is more than just enough to produce 350 tons of corn.
D)The lowest isocost ɪs₁ is more than just enough to produce 200 tons of corn.
Unlock Deck
Unlock for access to all 67 flashcards in this deck.
Unlock Deck
k this deck
40
Which of the following is a property of an isoquant?
A)It is concave to the origin.
B)Its slope is given by the ratio of the marginal products, for example, (marginal product of capital) ÷ (marginal product of labor), where capital and labor are measured on the Y and X-axes respectively.
C)It gives the lowest-cost way of producing a certain level of output.
D)Isoquants cannot intersect each other.
Unlock Deck
Unlock for access to all 67 flashcards in this deck.
Unlock Deck
k this deck
41
The greater the curvature of the isoquant:
A)the greater the degree of substitutability between the inputs.
B)the lower the possibility of substitution between inputs.
C)the higher the impact of a change in relative prices of inputs.
D)the lower the prices of inputs.
A)the greater the degree of substitutability between the inputs.
B)the lower the possibility of substitution between inputs.
C)the higher the impact of a change in relative prices of inputs.
D)the lower the prices of inputs.
Unlock Deck
Unlock for access to all 67 flashcards in this deck.
Unlock Deck
k this deck
42
Figure 4-4
The following figure shows three different plant sizes and short-run average cost curves (SRAC), along with the long-run average cost curve (LRAC) for the industry.
Refer to Figure 4-4.Which of the following statements is true?
A)is inefficiently large.
B)is inefficiently small for this market.
C)is likely to survive the competition with unchanged plant size.
D)and can improve their cost structures by resizing their plants to .
Unlock Deck
Unlock for access to all 67 flashcards in this deck.
Unlock Deck
k this deck
43
Discuss the relation between average variable cost (AVC) and marginal cost (MC) curves.
Unlock Deck
Unlock for access to all 67 flashcards in this deck.
Unlock Deck
k this deck
44
Which of the following cases exhibit increasing returns to scale?
A)Output increases by 5 percent when inputs are increased by 6 percent.
B)Output increases by 6 percent when inputs are increased by 5 percent.
C)Output increases by 7 percent when inputs are increased by 7 percent.
D)Output declines by 2 percent when inputs are increased by 1 percent.
A)Output increases by 5 percent when inputs are increased by 6 percent.
B)Output increases by 6 percent when inputs are increased by 5 percent.
C)Output increases by 7 percent when inputs are increased by 7 percent.
D)Output declines by 2 percent when inputs are increased by 1 percent.
Unlock Deck
Unlock for access to all 67 flashcards in this deck.
Unlock Deck
k this deck
45
In an industry characterized by a natural monopoly, which of the following characteristics will be observed?
A)The long-run average cost curve will be upward sloping.
B)The market price of the product will be very low.
C)Competition is both impossible and inefficient.
D)Number of producers operating in this market will be low.
A)The long-run average cost curve will be upward sloping.
B)The market price of the product will be very low.
C)Competition is both impossible and inefficient.
D)Number of producers operating in this market will be low.
Unlock Deck
Unlock for access to all 67 flashcards in this deck.
Unlock Deck
k this deck
46
The profit-maximizing rule of production is to produce the level of output where price is equal to marginal cost.Since the marginal cost (MC) curve is U-shaped, the price line running horizontal to the X-axis intersects the MC curve at two points.How is the profit maximization rule applied in this case?
Unlock Deck
Unlock for access to all 67 flashcards in this deck.
Unlock Deck
k this deck
47
Which of the following is consistent with increasing returns to scale?
A)An upward sloping marginal cost curve
B)A downward sloping marginal cost curve
C)An upward sloping long-run average cost curve
D)A downward sloping long-run average cost curve
A)An upward sloping marginal cost curve
B)A downward sloping marginal cost curve
C)An upward sloping long-run average cost curve
D)A downward sloping long-run average cost curve
Unlock Deck
Unlock for access to all 67 flashcards in this deck.
Unlock Deck
k this deck
48
Let the marginal product of labor and capital be denoted by MPL and MPK respectively.The price of labor and capital are given by PL and PK respectively.Which of the following equations gives the condition for producing a given level of output at the least cost combination of inputs?
A)PL × PK = MPL × MPK
B)PL × MPL = PK × MPK
C)MPL ÷ PK = MPK ÷ PL
D)PL ÷ PK = MPL ÷ MPK
A)PL × PK = MPL × MPK
B)PL × MPL = PK × MPK
C)MPL ÷ PK = MPK ÷ PL
D)PL ÷ PK = MPL ÷ MPK
Unlock Deck
Unlock for access to all 67 flashcards in this deck.
Unlock Deck
k this deck
49
What is a production function?
Unlock Deck
Unlock for access to all 67 flashcards in this deck.
Unlock Deck
k this deck
50
Define opportunity cost.
Unlock Deck
Unlock for access to all 67 flashcards in this deck.
Unlock Deck
k this deck
51
_____ is the locus of the minimum points of various short-run average cost curves depicting different plant sizes.
A)Long-run marginal cost
B)Expansion path
C)Long-run average cost
D)Isocost
A)Long-run marginal cost
B)Expansion path
C)Long-run average cost
D)Isocost
Unlock Deck
Unlock for access to all 67 flashcards in this deck.
Unlock Deck
k this deck
52
A manufacturer of towels finds that his returns to scale are constant.Which of the following conclusions can be drawn?
A)The long-run total cost curve is horizontal.
B)The long-run average cost curve is horizontal.
C)The long-run total cost curve is downward sloping.
D)The long-run average cost curve is downward sloping.
A)The long-run total cost curve is horizontal.
B)The long-run average cost curve is horizontal.
C)The long-run total cost curve is downward sloping.
D)The long-run average cost curve is downward sloping.
Unlock Deck
Unlock for access to all 67 flashcards in this deck.
Unlock Deck
k this deck
53
What is marginal cost?
Unlock Deck
Unlock for access to all 67 flashcards in this deck.
Unlock Deck
k this deck
54
A firm's cost can decrease for each of the following reasons, EXCEPT:
A)an increase in productivity due to experience.
B)an improvement in productivity of capital employed.
C)an improvement in work environment and quality of management.
D)an increase in input prices.
A)an increase in productivity due to experience.
B)an improvement in productivity of capital employed.
C)an improvement in work environment and quality of management.
D)an increase in input prices.
Unlock Deck
Unlock for access to all 67 flashcards in this deck.
Unlock Deck
k this deck
55
The introduction of new technology and changes in organization are:
A)likely to shift the LRAC curve.
B)unlikely to help in the short-run.
C)likely to shift the SRAC upward.
D)unlikely to affect a firm's cost curves in the long-run.
A)likely to shift the LRAC curve.
B)unlikely to help in the short-run.
C)likely to shift the SRAC upward.
D)unlikely to affect a firm's cost curves in the long-run.
Unlock Deck
Unlock for access to all 67 flashcards in this deck.
Unlock Deck
k this deck
56
The cheapest way to produce a certain amount of output may vary between the short and long-run because:
A)all inputs can be adjusted in the long run.
B)all inputs can be adjusted in the short run.
C)input prices are fixed in the short run.
D)prices increase over the long-run.
A)all inputs can be adjusted in the long run.
B)all inputs can be adjusted in the short run.
C)input prices are fixed in the short run.
D)prices increase over the long-run.
Unlock Deck
Unlock for access to all 67 flashcards in this deck.
Unlock Deck
k this deck
57
In an industry, when the cost curve of a firm is upward sloping at low levels of output relative to the market, it implies:
A)the industry is characterized by constant returns to scale.
B)the industry has a high degree of competition.
C)not many firms can operate together in this industry.
D)the firm can charge a price lower than competition and still cover its costs.
A)the industry is characterized by constant returns to scale.
B)the industry has a high degree of competition.
C)not many firms can operate together in this industry.
D)the firm can charge a price lower than competition and still cover its costs.
Unlock Deck
Unlock for access to all 67 flashcards in this deck.
Unlock Deck
k this deck
58
Let the marginal product of capital (MPK ) be 6; the marginal product of labor (MPL) be 2; the price of labor is given by $10.What will be the price of capital such that the isocost and the isoquant are tangent to each other?
A)$30
B)$3
C)$60
D)$6
A)$30
B)$3
C)$60
D)$6
Unlock Deck
Unlock for access to all 67 flashcards in this deck.
Unlock Deck
k this deck
59
Identify the difference between the short-run and the long-run.
Unlock Deck
Unlock for access to all 67 flashcards in this deck.
Unlock Deck
k this deck
60
The usage of computers on a large scale facilitated widespread changes in organizations in the twentieth century.Given this, which of the following statements will be true?
A)The LRAC of a firm operating with the old organizational structure is likely to be lower than the firms with the new structure.
B)After adopting a new organizational structure that can effectively manage large-scale operations, a firm is likely to have lower LRAC whose minimum is at a higher output.
C)The LRAC of a firm with a new organizational structure will be higher and to the right of a firm operating with the old organizational structure.
D)After adopting a new organizational structure that can effectively manage large-scale operations, a firm's LRAC is likely to shift downward to the left.
Unlock Deck
Unlock for access to all 67 flashcards in this deck.
Unlock Deck
k this deck
61
How is the optimal level of input usage to produce a certain output identified with the help of isocosts and isoquants?
Unlock Deck
Unlock for access to all 67 flashcards in this deck.
Unlock Deck
k this deck
62
Explain the reason behind the declining gap between average cost (AC) and average variable cost (AVC) curves at higher levels of output.
Unlock Deck
Unlock for access to all 67 flashcards in this deck.
Unlock Deck
k this deck
63
Explain how isocosts allow firms to arrive at the most efficient input mix for producing a particular level of output.
Unlock Deck
Unlock for access to all 67 flashcards in this deck.
Unlock Deck
k this deck
64
Suppose the price level of a product is gradually declining due to fall in demand.When will a producer of this product decide to shut down in the short run?
Unlock Deck
Unlock for access to all 67 flashcards in this deck.
Unlock Deck
k this deck
65
Define returns to scale.
Unlock Deck
Unlock for access to all 67 flashcards in this deck.
Unlock Deck
k this deck
66
Explain with examples the reasoning behind the positive slope of the LRAC curve at higher levels of output.
Unlock Deck
Unlock for access to all 67 flashcards in this deck.
Unlock Deck
k this deck
67
What is a natural monopoly?
Unlock Deck
Unlock for access to all 67 flashcards in this deck.
Unlock Deck
k this deck
Unlock Deck
Unlock for access to all 67 flashcards in this deck.


