Deck 10: Consumer Surplus and Deadweight Loss
Full screen (f)
Question
Question
Question
Question
Question
Question
Question
Question
Question
Question
Question
Question
Question
Question
Question
Question
Question
Question
Question
Question
Question
Question
Question
Question
Question
Question
The following graph applies to a consumer for whom good x is an inferior good.The price of x falls from p to p', and one of the curves below represents the consumer's (uncompensated) demand curve while the other represents the consumer's compensated demand (or MWTP) curve. 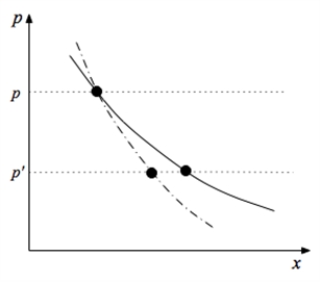
a.Which curve is which? (Explain.)
b.What is it about these curves that makes them intersect at the original price p?
c.Once the consumer has optimized at the new price p', illustrate the new (uncompensated) demand and the new MWTP curve.
d.For curves that have shifted, explain why; for curves that have not shifted, explain why as well.
Question
Question

Unlock Deck
Sign up to unlock the cards in this deck!
Unlock Deck
Unlock Deck
1/28
Play
Full screen (f)
Deck 10: Consumer Surplus and Deadweight Loss
1
When tastes are not quasilinear, the positive economist will introduce error into the analysis if he uses the uncompensated (rather than the compensated) demand curve to predict behavior.
False
2
Suppose x is an inferior good.Then we will overestimate the deadweight loss from taxes on consumption good x if we use the uncompensated demand curve rather than the marginal willingness to pay (or compensated demand) curve.
False
3
When tastes are not quasilinear, the positive economist will introduce error into the analysis if he uses the uncompensated (rather than the compensated) demand curve to analyze changes in consumer surplus.
True
4
Consumer surplus is accurately measured along (uncompensated) demand curves when tastes are quasilinear.
Unlock Deck
Unlock for access to all 28 flashcards in this deck.
Unlock Deck
k this deck
5
If a person's compensated demand (or MWTP) curve is perfectly vertical, the good is borderline between regular inferior and Giffen for this consumer.
Unlock Deck
Unlock for access to all 28 flashcards in this deck.
Unlock Deck
k this deck
6
As tax rates rise linearly, DWL also rises linearly.
Unlock Deck
Unlock for access to all 28 flashcards in this deck.
Unlock Deck
k this deck
7
As we move to higher indifference curves, compensated demand (or MWTP) curves shift to the right.
Unlock Deck
Unlock for access to all 28 flashcards in this deck.
Unlock Deck
k this deck
8
There is a compensated demand (or MWTP) curve for every indifference curve just as there is an uncompensated demand curve for every income level.
Unlock Deck
Unlock for access to all 28 flashcards in this deck.
Unlock Deck
k this deck
9
An increase in income causes compensated demand curves to shift inward and regular demand curves to shift outward.
Unlock Deck
Unlock for access to all 28 flashcards in this deck.
Unlock Deck
k this deck
10
Indirect utility functions are homogeneous of degree 1 in income.
Unlock Deck
Unlock for access to all 28 flashcards in this deck.
Unlock Deck
k this deck
11
If tastes are homothetic, there exists a utility function that represents those tastes and that gives rise to an expenditure function which is homogeneous of degree 1 in utility.
Unlock Deck
Unlock for access to all 28 flashcards in this deck.
Unlock Deck
k this deck
12
Which of the following must be true about functions in the duality picture:
A)The utility function is homogeneous of degree 1.
B)The indirect utility function is homogeneous of degree 1 in income.
C)The uncompensated demand functions are homogeneous of degree 1.
D)Both (a) and (b).
E)Both (b) and (c).
F)Both (a) and (c)
G)All of the above.
H)None of the above.
A)The utility function is homogeneous of degree 1.
B)The indirect utility function is homogeneous of degree 1 in income.
C)The uncompensated demand functions are homogeneous of degree 1.
D)Both (a) and (b).
E)Both (b) and (c).
F)Both (a) and (c)
G)All of the above.
H)None of the above.
Unlock Deck
Unlock for access to all 28 flashcards in this deck.
Unlock Deck
k this deck
13
Which of the following have to be true about functions in the duality picture:
A)The expenditure function is homogeneous of degree 1 in prices.
B)The compensated demand functions are homogeneous of degree 1 in prices.
C)The uncompensated demand functions are homogeneous of degree 1 in prices.
D)Both (a) and (b).
E)Both (b) and (c).
F)Both (a) and (c).
G)All of the above.
H)None of the above.
Unlock Deck
Unlock for access to all 28 flashcards in this deck.
Unlock Deck
k this deck
14
Whenever indifference curves have kinks, marginal willingness to pay curves have horizontal "flat spots".
Unlock Deck
Unlock for access to all 28 flashcards in this deck.
Unlock Deck
k this deck
15
Price subsidies have no deadweight losses so long as the (uncompensated) demand curve is vertical.
Unlock Deck
Unlock for access to all 28 flashcards in this deck.
Unlock Deck
k this deck
16
When a taxed good is normal, using the (uncompensated) demand curve to estimate deadweight loss will over-state the actual deadweight loss.
Unlock Deck
Unlock for access to all 28 flashcards in this deck.
Unlock Deck
k this deck
17
A policy which gains the winners more than the losers lose, in principle, could never result in unanimous approval of the policy.
Unlock Deck
Unlock for access to all 28 flashcards in this deck.
Unlock Deck
k this deck
18
If tastes are homothetic, there exists a utility function (that represents those tastes) such that the indirect utility function is homogeneous of degree 1 in income.
Unlock Deck
Unlock for access to all 28 flashcards in this deck.
Unlock Deck
k this deck
19
Which of the following are true about functions in the duality picture:
A)Compensated demand functions are homogeneous of degree zero in prices.
B)Uncompensated demand functions are homogeneous of degree zero.
C)Expenditure functions are homogeneous of degree zero.
D)Both (a) and (b).
E)Both (b) and (c).
F)Both (a) and (c).
G)All of the above.
H)None of the above.
A)Compensated demand functions are homogeneous of degree zero in prices.
B)Uncompensated demand functions are homogeneous of degree zero.
C)Expenditure functions are homogeneous of degree zero.
D)Both (a) and (b).
E)Both (b) and (c).
F)Both (a) and (c).
G)All of the above.
H)None of the above.
Unlock Deck
Unlock for access to all 28 flashcards in this deck.
Unlock Deck
k this deck
20
For perfect complements, the (uncompensated) demand curve slopes down and the compensated demand (or MWTP) curve is perfectly vertical.
Unlock Deck
Unlock for access to all 28 flashcards in this deck.
Unlock Deck
k this deck
21
Which of the following must be true about homothetic tastes:
A)Utility functions that represent those tastes are homogeneous of degree 1.
B)There exists a utility function that represents those tastes and is homogeneous of degree 1.
C)There exists a utility function that represents those tastes such that the expenditure function is homogeneous of degree 1.
D)The indirect utility function is homogeneous of degree zero.
E)Both (a) and (c).
F)Both (b) and (c).
G)Both (b) and (d)
H)None of the above.
Unlock Deck
Unlock for access to all 28 flashcards in this deck.
Unlock Deck
k this deck
22
Suppose Coke and Pepsi are perfect substitutes.
a.Derive the shape of the (uncompensated) demand curve.
b.Derive the shape of the compensated demand (or MWTP) curve.
a.Derive the shape of the (uncompensated) demand curve.
b.Derive the shape of the compensated demand (or MWTP) curve.
Unlock Deck
Unlock for access to all 28 flashcards in this deck.
Unlock Deck
k this deck
23
Consider a household with income I and two goods to choose from - square feet of housing (x1) and dollars of other consumption (x2).The annual price per square foot of housing is p, and the household's tastes can be described by the utility function u(x1,x2)= x10.25x20.75.
a.How much housing and other goods will the household demand as a function of p and I.
b.Suppose income is $100,000 and the price of housing is $10 per square foot.Then the government introduces a subsidy that lowers the housing price to $5 per square foot.In the attached graph, let the solid lines denote the budget lines of the household before and after the subsidy.What are the values of the intercept terms a, b and c in the graph?
c.How much of each good does the household consume at bundle A - i.e.what are the values of d and e in the graph.How much would the household consume of each good after the subsidy?
d.Answer this part in terms of letters on the vertical axis of the graph.What is the most this household would be willing to pay in cash to get this price subsidy? If a household already had the subsidy (without having paid any cash to get it), what is the least that we would have to pay the household in cash for the household to be willing to give up the subsidy?
e.The expenditure function for this household is approximately E(p,u)=1.755p0.25u.Calculate dollar values for the first question in part (d).f.What is the dollar value for the second question in part (d)?
g.If the subsidy is put in place (without the household making any cash payments to get it), how much will the subsidy cost the government? Express this as a distance in the graph as well as a dollar value.h.Explain intuitively why there is a deadweight loss of implementing the subsidy - and then calculate the dollar value of the deadweight loss.i.Calculate the bundles C and D in the graph - i.e.calculate the values for f, g, h and i.(Hint: You can do this a number of different ways - but the quickest way would be to use your answers to parts (e) and (f).)
Unlock Deck
Unlock for access to all 28 flashcards in this deck.
Unlock Deck
k this deck
24
The recent crisis in the U.S.housing market was in part precipitated by the fact that many consumers bought houses using "sub-prime mortgage contracts".These contracts specified an initially below-market interest rate that would adjust upward in the future depending on how market interest rates moved.Then market interest rates went up - which substantially increased the cost of housing for consumers who were holding sub-prime mortgage contracts - in some cases making it unaffordable for consumers to remain in the house they purchased earlier.For purposes of this problem, use the attached graph for such a consumer to answer the question.(Caution: Don't think of housing as an endowment in this problem - but rather treat the cost of housing as if the consumer were simply renting square feet of housing, with the "rent" having increased as a result of higher interest rates.) The two solid budget lines represent the budget before and after the increase in interest rates that led to an increased cost of housing for this consumer.Before the current crisis, this consumer optimized at bundle C.Assume throughout this problem that all consumer tastes are homothetic.
a.In principle, could this consumer continue to stay in his current house?
b.In the absence of any policy intervention, will this consumer consume more or less in non-housing consumption given the current crisis?
c.It turns out that some consumers have increased current consumption and others have decreased it as a result of the housing crisis.Assuming that all consumers have homothetic tastes, what is the crucial difference between the tastes of these consumers?
d.Suppose the government intervenes and subsidizes housing in such a way that (per square feet) housing costs remain unchanged despite the housing crisis.How much will this policy cost for the consumer graphed in the attached graph?
e.Suppose that, instead of lowering the cost of housing to the pre-crisis level, the government gave a tax credit to this consumer (which is equivalent to giving the consumer cash).How much of a tax credit would it need to give to make the consumer indifferent between this and the previous policy?
f.How much of a deadweight loss does society incur from the policy that reduces the cost of housing to the pre-crisis level?
g.On the lower graph (on the attached page), indicate where this consumer's demand curve lies.Then indicate where the marginal willingness to pay curve you would use to derive deadweight loss lies.h.Suppose the government only has estimates of (regular) demand curves.As a result, it uses the demand curve (and not the marginal willingness to pay curve) to estimate the deadweight loss from the policy that lowers housing costs to pre-crisis levels.Will this be an over or under-estimate of the true deadweight loss?
Unlock Deck
Unlock for access to all 28 flashcards in this deck.
Unlock Deck
k this deck
25
Explain the following statement: "People hate taxes primarily because of income effects while economists hate taxes primarily because of substitution effects."
Unlock Deck
Unlock for access to all 28 flashcards in this deck.
Unlock Deck
k this deck
26
The following graph applies to a consumer for whom good x is an inferior good.The price of x falls from p to p', and one of the curves below represents the consumer's (uncompensated) demand curve while the other represents the consumer's compensated demand (or MWTP) curve.
a.Which curve is which? (Explain.)
b.What is it about these curves that makes them intersect at the original price p?
c.Once the consumer has optimized at the new price p', illustrate the new (uncompensated) demand and the new MWTP curve.
d.For curves that have shifted, explain why; for curves that have not shifted, explain why as well.
Unlock Deck
Unlock for access to all 28 flashcards in this deck.
Unlock Deck
k this deck
27
Consider a worker who consumes a composite consumption good (on the vertical axis) and leisure hours (on the horizontal axis).
a.Suppose the worker has 80 hours of leisure per week and can earn a wage of $50 per hour.Illustrate the worker's weekly budget constraint.
b.In order to close the deficit, the government introduces a broad-based consumption tax on all consumer goods -- raising the price of the consumption good by 20%.Illustrate the new budget constraint faced by our worker.
c.On your graph, indicate the level of tax revenue raised by this broad-based consumption tax.
d.Using your graph, discuss why this tax is inefficient.
e.In this model is there any difference between the consumption tax and a wage tax? What is different about the real world that would change your conclusion about this?
Unlock Deck
Unlock for access to all 28 flashcards in this deck.
Unlock Deck
k this deck
28
Why is the following statement incorrect: "A tax on all consumption goods is efficient because it equally taxes all goods and therefore does not distort their prices."
Unlock Deck
Unlock for access to all 28 flashcards in this deck.
Unlock Deck
k this deck
Unlock Deck
Unlock for access to all 28 flashcards in this deck.


