Deck 9: Aggregate Demand and Aggregate Supply Analysis
Full screen (f)
Question
Question
Question
Question
Question
Question
Question
Question
Question
Question
Question
Question
Question
Question
Question
Question
Question
Question
Question
Question
Question
Figure 9.1 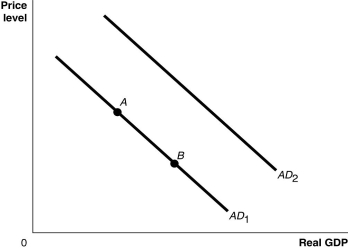 Alt text for Figure 9.1: In figure 9.1, a graph comparing real GDP and price level.
Long description for Figure 9.1: The x-axis is labelled, real GDP, and the y-axis is labelled, price level, with 0 at the vertex.Line AD1 begins in the top left corner and slopes down to the bottom center.Line AD2 follows the same slope as line AD1 but is plotted to the right.Points A and B are plotted along line AD1.Point A is a little less than half way along the left side of the line, and point B is little more than half way on the right side of the line.
Refer to Figure 9.1.Ceteris paribus, an increase in personal income taxes would be represented by a movement from
A)AD1 to AD2.
B)AD2 to AD1.
C)point A to point B.
D)point B to point A.
Alt text for Figure 9.1: In figure 9.1, a graph comparing real GDP and price level.Long description for Figure 9.1: The x-axis is labelled, real GDP, and the y-axis is labelled, price level, with 0 at the vertex.Line AD1 begins in the top left corner and slopes down to the bottom center.Line AD2 follows the same slope as line AD1 but is plotted to the right.Points A and B are plotted along line AD1.Point A is a little less than half way along the left side of the line, and point B is little more than half way on the right side of the line.
Refer to Figure 9.1.Ceteris paribus, an increase in personal income taxes would be represented by a movement from
A)AD1 to AD2.
B)AD2 to AD1.
C)point A to point B.
D)point B to point A.
Question
Figure 9.1 Alt text for Figure 9.1: In figure 9.1, a graph comparing real GDP and price level.
Long description for Figure 9.1: The x-axis is labelled, real GDP, and the y-axis is labelled, price level, with 0 at the vertex.Line AD1 begins in the top left corner and slopes down to the bottom center.Line AD2 follows the same slope as line AD1 but is plotted to the right.Points A and B are plotted along line AD1.Point A is a little less than half way along the left side of the line, and point B is little more than half way on the right side of the line.
Refer to Figure 9.1.Ceteris paribus, an increase in the price level would be represented by a movement from
A)AD1 to AD2.
B)AD2 to AD1.
C)point A to point B.
D)point B to point A.
Alt text for Figure 9.1: In figure 9.1, a graph comparing real GDP and price level.Long description for Figure 9.1: The x-axis is labelled, real GDP, and the y-axis is labelled, price level, with 0 at the vertex.Line AD1 begins in the top left corner and slopes down to the bottom center.Line AD2 follows the same slope as line AD1 but is plotted to the right.Points A and B are plotted along line AD1.Point A is a little less than half way along the left side of the line, and point B is little more than half way on the right side of the line.
Refer to Figure 9.1.Ceteris paribus, an increase in the price level would be represented by a movement from
A)AD1 to AD2.
B)AD2 to AD1.
C)point A to point B.
D)point B to point A.
Question
Figure 9.1 Alt text for Figure 9.1: In figure 9.1, a graph comparing real GDP and price level.
Long description for Figure 9.1: The x-axis is labelled, real GDP, and the y-axis is labelled, price level, with 0 at the vertex.Line AD1 begins in the top left corner and slopes down to the bottom center.Line AD2 follows the same slope as line AD1 but is plotted to the right.Points A and B are plotted along line AD1.Point A is a little less than half way along the left side of the line, and point B is little more than half way on the right side of the line.
Refer to Figure 9.1.Ceteris paribus, an increase in interest rates would be represented by a movement from
A)AD1 to AD2.
B)AD2 to AD1.
C)point A to point B.
D)point B to point A.
Alt text for Figure 9.1: In figure 9.1, a graph comparing real GDP and price level.Long description for Figure 9.1: The x-axis is labelled, real GDP, and the y-axis is labelled, price level, with 0 at the vertex.Line AD1 begins in the top left corner and slopes down to the bottom center.Line AD2 follows the same slope as line AD1 but is plotted to the right.Points A and B are plotted along line AD1.Point A is a little less than half way along the left side of the line, and point B is little more than half way on the right side of the line.
Refer to Figure 9.1.Ceteris paribus, an increase in interest rates would be represented by a movement from
A)AD1 to AD2.
B)AD2 to AD1.
C)point A to point B.
D)point B to point A.
Question
Question
Question
Question
Question
Question
Question
Question
Figure 9.1 Alt text for Figure 9.1: In figure 9.1, a graph comparing real GDP and price level.
Long description for Figure 9.1: The x-axis is labelled, real GDP, and the y-axis is labelled, price level, with 0 at the vertex.Line AD1 begins in the top left corner and slopes down to the bottom center.Line AD2 follows the same slope as line AD1 but is plotted to the right.Points A and B are plotted along line AD1.Point A is a little less than half way along the left side of the line, and point B is little more than half way on the right side of the line.
Refer to Figure 9.1.Ceteris paribus, a decrease in the growth rate of domestic GDP relative to the growth rate of foreign GDP would be represented by a movement from
A)AD1 to AD2.
B)AD2 to AD1.
C)point A to point B.
D)point B to point A.
Alt text for Figure 9.1: In figure 9.1, a graph comparing real GDP and price level.Long description for Figure 9.1: The x-axis is labelled, real GDP, and the y-axis is labelled, price level, with 0 at the vertex.Line AD1 begins in the top left corner and slopes down to the bottom center.Line AD2 follows the same slope as line AD1 but is plotted to the right.Points A and B are plotted along line AD1.Point A is a little less than half way along the left side of the line, and point B is little more than half way on the right side of the line.
Refer to Figure 9.1.Ceteris paribus, a decrease in the growth rate of domestic GDP relative to the growth rate of foreign GDP would be represented by a movement from
A)AD1 to AD2.
B)AD2 to AD1.
C)point A to point B.
D)point B to point A.
Question
Question
Figure 9.1 Alt text for Figure 9.1: In figure 9.1, a graph comparing real GDP and price level.
Long description for Figure 9.1: The x-axis is labelled, real GDP, and the y-axis is labelled, price level, with 0 at the vertex.Line AD1 begins in the top left corner and slopes down to the bottom center.Line AD2 follows the same slope as line AD1 but is plotted to the right.Points A and B are plotted along line AD1.Point A is a little less than half way along the left side of the line, and point B is little more than half way on the right side of the line.
Refer to Figure 9.1.Ceteris paribus, a decrease in firms' expectations of the future profitability of investment spending would be represented by a movement from
A)AD1 to AD2.
B)AD2 to AD1.
C)point A to point B.
D)point B to point A.
Alt text for Figure 9.1: In figure 9.1, a graph comparing real GDP and price level.Long description for Figure 9.1: The x-axis is labelled, real GDP, and the y-axis is labelled, price level, with 0 at the vertex.Line AD1 begins in the top left corner and slopes down to the bottom center.Line AD2 follows the same slope as line AD1 but is plotted to the right.Points A and B are plotted along line AD1.Point A is a little less than half way along the left side of the line, and point B is little more than half way on the right side of the line.
Refer to Figure 9.1.Ceteris paribus, a decrease in firms' expectations of the future profitability of investment spending would be represented by a movement from
A)AD1 to AD2.
B)AD2 to AD1.
C)point A to point B.
D)point B to point A.
Question
Question
Figure 9.1 Alt text for Figure 9.1: In figure 9.1, a graph comparing real GDP and price level.
Long description for Figure 9.1: The x-axis is labelled, real GDP, and the y-axis is labelled, price level, with 0 at the vertex.Line AD1 begins in the top left corner and slopes down to the bottom center.Line AD2 follows the same slope as line AD1 but is plotted to the right.Points A and B are plotted along line AD1.Point A is a little less than half way along the left side of the line, and point B is little more than half way on the right side of the line.
Refer to Figure 9.1.Ceteris paribus, an increase in the value of the domestic currency relative to foreign currencies would be represented by a movement from
A)AD1 to AD2.
B)AD2 to AD1.
C)point A to point B.
D)point B to point A.
Alt text for Figure 9.1: In figure 9.1, a graph comparing real GDP and price level.Long description for Figure 9.1: The x-axis is labelled, real GDP, and the y-axis is labelled, price level, with 0 at the vertex.Line AD1 begins in the top left corner and slopes down to the bottom center.Line AD2 follows the same slope as line AD1 but is plotted to the right.Points A and B are plotted along line AD1.Point A is a little less than half way along the left side of the line, and point B is little more than half way on the right side of the line.
Refer to Figure 9.1.Ceteris paribus, an increase in the value of the domestic currency relative to foreign currencies would be represented by a movement from
A)AD1 to AD2.
B)AD2 to AD1.
C)point A to point B.
D)point B to point A.
Question
Figure 9.1 Alt text for Figure 9.1: In figure 9.1, a graph comparing real GDP and price level.
Long description for Figure 9.1: The x-axis is labelled, real GDP, and the y-axis is labelled, price level, with 0 at the vertex.Line AD1 begins in the top left corner and slopes down to the bottom center.Line AD2 follows the same slope as line AD1 but is plotted to the right.Points A and B are plotted along line AD1.Point A is a little less than half way along the left side of the line, and point B is little more than half way on the right side of the line.
Refer to Figure 9.1.Ceteris paribus, an increase in households' expectations of their future income would be represented by a movement from
A)AD1 to AD2.
B)AD2 to AD1.
C)point A to point B.
D)point B to point A.
Alt text for Figure 9.1: In figure 9.1, a graph comparing real GDP and price level.Long description for Figure 9.1: The x-axis is labelled, real GDP, and the y-axis is labelled, price level, with 0 at the vertex.Line AD1 begins in the top left corner and slopes down to the bottom center.Line AD2 follows the same slope as line AD1 but is plotted to the right.Points A and B are plotted along line AD1.Point A is a little less than half way along the left side of the line, and point B is little more than half way on the right side of the line.
Refer to Figure 9.1.Ceteris paribus, an increase in households' expectations of their future income would be represented by a movement from
A)AD1 to AD2.
B)AD2 to AD1.
C)point A to point B.
D)point B to point A.
Question
Question
Question
Figure 9.1 Alt text for Figure 9.1: In figure 9.1, a graph comparing real GDP and price level.
Long description for Figure 9.1: The x-axis is labelled, real GDP, and the y-axis is labelled, price level, with 0 at the vertex.Line AD1 begins in the top left corner and slopes down to the bottom center.Line AD2 follows the same slope as line AD1 but is plotted to the right.Points A and B are plotted along line AD1.Point A is a little less than half way along the left side of the line, and point B is little more than half way on the right side of the line.
Refer to Figure 9.1.Ceteris paribus, a decrease in government spending would be represented by a movement from
A)AD1 to AD2.
B)AD2 to AD1.
C)point A to point B.
D)point B to point A.
Alt text for Figure 9.1: In figure 9.1, a graph comparing real GDP and price level.Long description for Figure 9.1: The x-axis is labelled, real GDP, and the y-axis is labelled, price level, with 0 at the vertex.Line AD1 begins in the top left corner and slopes down to the bottom center.Line AD2 follows the same slope as line AD1 but is plotted to the right.Points A and B are plotted along line AD1.Point A is a little less than half way along the left side of the line, and point B is little more than half way on the right side of the line.
Refer to Figure 9.1.Ceteris paribus, a decrease in government spending would be represented by a movement from
A)AD1 to AD2.
B)AD2 to AD1.
C)point A to point B.
D)point B to point A.
Question
Question
Question
Question
Question
Question
Question
Question
Question
Question
Question
Question
Question
Question
Question
Question
Question
Question
Question
Question
Question
Question
Question
Question
Question
Question
Question
Question
Question
Question
Question
Question
Question
Question
Question
Question
Question
Question
Question
Question
Question

Unlock Deck
Sign up to unlock the cards in this deck!
Unlock Deck
Unlock Deck
1/246
Play
Full screen (f)
Deck 9: Aggregate Demand and Aggregate Supply Analysis
1
An increase in the price level will
A)shift the aggregate demand curve to the left.
B)shift the aggregate demand curve to the right.
C)move the economy up along a stationary aggregate demand curve.
D)move the economy down along a stationary aggregate demand curve.
E)shift the aggregate supply curve to the right.
A)shift the aggregate demand curve to the left.
B)shift the aggregate demand curve to the right.
C)move the economy up along a stationary aggregate demand curve.
D)move the economy down along a stationary aggregate demand curve.
E)shift the aggregate supply curve to the right.
move the economy up along a stationary aggregate demand curve.
2
Because of the slope of the aggregate demand curve, we can say that
A)a decrease in the price level leads to a lower level of real GDP demanded.
B)an increase in the price level leads to no change in the level of real GDP demanded.
C)a decrease in the price level leads to a higher level of real GDP demanded.
D)an increase in the price level leads to a higher level of real GDP demanded.
E)an increase in the price level increases household wealth.
a decrease in the price level leads to a higher level of real GDP demanded.
3
Which of the following is one explanation as to why the aggregate demand curve slopes downward?
A)Decreases in the price level raise the interest rate and increase consumption spending.
B)Decreases in the price level raise the interest rate and increase investment spending.
C)Decreases in the Canada price level relative to the price level in other countries lower net exports.
D)Decreases in the price level raise real wealth and increase consumption spending.
E)Decreases in the price level raise the value of the multiplier.
Decreases in the price level raise real wealth and increase consumption spending.
4
Deflation will
A)increase aggregate demand.
B)increase the quantity of real GDP demanded.
C)decrease aggregate demand.
D)decrease the quantity of real GDP demanded.
E)have no impact on the quantity of real GDP demanded.
A)increase aggregate demand.
B)increase the quantity of real GDP demanded.
C)decrease aggregate demand.
D)decrease the quantity of real GDP demanded.
E)have no impact on the quantity of real GDP demanded.
Unlock Deck
Unlock for access to all 246 flashcards in this deck.
Unlock Deck
k this deck
5
Canadian National Railways (CN)plays such a large role in moving goods around the country that there is usually a close relationship between fluctuations in CN's business and fluctuations in GDP.When CN sees an increase in demand for its services, we can likely expect
A)a decrease in GDP.
B)an increase in GDP.
C)a drop in the exchange rate.
D)an increase in unemployment.
E)a decrease in the price level.
A)a decrease in GDP.
B)an increase in GDP.
C)a drop in the exchange rate.
D)an increase in unemployment.
E)a decrease in the price level.
Unlock Deck
Unlock for access to all 246 flashcards in this deck.
Unlock Deck
k this deck
6
Higher personal income taxes
A)increase aggregate demand.
B)increase disposable income.
C)decrease aggregate demand.
D)increase aggregate supply.
E)decrease aggregate supply.
A)increase aggregate demand.
B)increase disposable income.
C)decrease aggregate demand.
D)increase aggregate supply.
E)decrease aggregate supply.
Unlock Deck
Unlock for access to all 246 flashcards in this deck.
Unlock Deck
k this deck
7
The "interest rate effect" can be described as an increase in the price level that raises the interest rate and chokes off
A)government spending.
B)government spending and unplanned investment.
C)investment and consumption spending.
D)net exports.
E)household savings.
A)government spending.
B)government spending and unplanned investment.
C)investment and consumption spending.
D)net exports.
E)household savings.
Unlock Deck
Unlock for access to all 246 flashcards in this deck.
Unlock Deck
k this deck
8
The basic aggregate demand and aggregate supply curve model helps explain
A)short-term fluctuations in real GDP and the price level.
B)long-term growth.
C)price fluctuations in an individual market.
D)output fluctuations in an individual market.
E)which workers will lose their jobs during a recession.
A)short-term fluctuations in real GDP and the price level.
B)long-term growth.
C)price fluctuations in an individual market.
D)output fluctuations in an individual market.
E)which workers will lose their jobs during a recession.
Unlock Deck
Unlock for access to all 246 flashcards in this deck.
Unlock Deck
k this deck
9
Spending on the peace keeping missions is essentially categorized as government purchases.How do increases in spending on peace keeping affect the aggregate demand curve?
A)They will move the economy up along a stationary aggregate demand curve.
B)They will move the economy down along a stationary aggregate demand curve.
C)They will shift the aggregate demand curve to the left.
D)They will shift the aggregate demand curve to the right.
E)This form of government spending will have no impact on the economy.
Unlock Deck
Unlock for access to all 246 flashcards in this deck.
Unlock Deck
k this deck
10
The international trade effect states that
A)an increase in the price level will raise net exports.
B)an increase in the price level will lower net exports.
C)an increase in the price level will raise exports.
D)an increase in the price level will lower imports.
E)an increase in the price level will rise domestic GDP.
A)an increase in the price level will raise net exports.
B)an increase in the price level will lower net exports.
C)an increase in the price level will raise exports.
D)an increase in the price level will lower imports.
E)an increase in the price level will rise domestic GDP.
Unlock Deck
Unlock for access to all 246 flashcards in this deck.
Unlock Deck
k this deck
11
If the Canadian dollar decreases in value relative to other currencies, how does this affect the aggregate demand curve?
A)This will move the economy up along a stationary aggregate demand curve.
B)This will move the economy down along a stationary aggregate demand curve.
C)This will shift the aggregate demand curve to the left.
D)This will shift the aggregate demand curve to the right.
E)This will not affect the Canadian economy.
Unlock Deck
Unlock for access to all 246 flashcards in this deck.
Unlock Deck
k this deck
12
When the price level in Canada falls relative to the price level of other countries, ________ will fall, ________ will rise, and ________ will rise.
A)imports; exports; net exports
B)exports; imports; net exports
C)net exports; exports; imports
D)net exports; imports; exports
E)net exports; incomes; exports
A)imports; exports; net exports
B)exports; imports; net exports
C)net exports; exports; imports
D)net exports; imports; exports
E)net exports; incomes; exports
Unlock Deck
Unlock for access to all 246 flashcards in this deck.
Unlock Deck
k this deck
13
An increase in the price level results in a(n)________ in the quantity of real GDP demanded because ________.
A)decrease; a higher price level reduces consumption, investment, and net exports
B)increase; a higher price level reduces consumption, investment, and net exports
C)decrease; a higher price level increases consumption, investment, and net exports
D)increase; a higher price level increases consumption, investment, and net exports
E)increase; a higher price level reduces consumption, investment and government spending
Unlock Deck
Unlock for access to all 246 flashcards in this deck.
Unlock Deck
k this deck
14
Sales of large pickup trucks built in Ontario were hurt in 2016 as a result of the economic slow down in Alberta.How would this decrease in affect Ontario's aggregate demand curve?
A)Ontario's aggregate demand curve would have shifted to the right.
B)Ontario's aggregate demand curve would not have shifted, but there would have been a movement up Ontario's aggregate demand curve.
C)Ontario's aggregate demand curve would not have shifted, but there would have been a movement down Ontario's aggregate demand curve.
D)Ontario's aggregate demand curve would have shifted to the left.
E)Ontario's aggregate demand curve would have shifted to the right and there would have been a movement up Ontario's aggregate demand curve.
Unlock Deck
Unlock for access to all 246 flashcards in this deck.
Unlock Deck
k this deck
15
The recession of 2008-2009 made many firms pessimistic about the future profitability of investments.How does this increased pessimism affect the aggregate demand curve?
A)This will move the economy up along a stationary aggregate demand curve.
B)This will move the economy down along a stationary aggregate demand curve.
C)This will shift the aggregate demand curve to the left.
D)This will shift the aggregate demand curve to the right.
E)This will shift the aggregate supply curve to the right.
Unlock Deck
Unlock for access to all 246 flashcards in this deck.
Unlock Deck
k this deck
16
When the economy enters into a recession, your employer is ________ to reduce your wages because ________.
A)unlikely; output and input prices generally fall during recession
B)unlikely; lower wages reduce productivity and morale
C)likely; output prices always fall during recession
D)likely; aggregate demand is vertical in the long run
E)likely; labour demand increases during recessions
A)unlikely; output and input prices generally fall during recession
B)unlikely; lower wages reduce productivity and morale
C)likely; output prices always fall during recession
D)likely; aggregate demand is vertical in the long run
E)likely; labour demand increases during recessions
Unlock Deck
Unlock for access to all 246 flashcards in this deck.
Unlock Deck
k this deck
17
The ________ shows the relationship between the price level and quantity of real GDP demanded.
A)consumer price index
B)aggregate expenditure line
C)45-degree line
D)aggregate demand curve
E)consumption function
A)consumer price index
B)aggregate expenditure line
C)45-degree line
D)aggregate demand curve
E)consumption function
Unlock Deck
Unlock for access to all 246 flashcards in this deck.
Unlock Deck
k this deck
18
All of the following would be considered a positive addition to household wealth except
A)the equity in one's home.
B)500 shares of Google stock.
C)the balance in your savings account.
D)a credit card balance.
E)a decrease in the price level.
A)the equity in one's home.
B)500 shares of Google stock.
C)the balance in your savings account.
D)a credit card balance.
E)a decrease in the price level.
Unlock Deck
Unlock for access to all 246 flashcards in this deck.
Unlock Deck
k this deck
19
Which of the following best describes the "wealth effect"?
A)When the price level falls, the real value of household wealth falls.
B)When the price level falls, the nominal value of household wealth falls.
C)When the price level falls, the nominal value of household wealth rises.
D)When the price level falls, the real value of household wealth rises.
E)When the price level falls, the value of stocks rise.
Unlock Deck
Unlock for access to all 246 flashcards in this deck.
Unlock Deck
k this deck
20
Which of the following will shift the aggregate demand curve to the right, ceteris paribus?
A)an increase in interest rates
B)a decrease in disposable income
C)a decrease in expected profits for firms
D)an increase in net exports
E)an decrease in government spending
A)an increase in interest rates
B)a decrease in disposable income
C)a decrease in expected profits for firms
D)an increase in net exports
E)an decrease in government spending
Unlock Deck
Unlock for access to all 246 flashcards in this deck.
Unlock Deck
k this deck
21
Figure 9.1 Alt text for Figure 9.1: In figure 9.1, a graph comparing real GDP and price level.
Long description for Figure 9.1: The x-axis is labelled, real GDP, and the y-axis is labelled, price level, with 0 at the vertex.Line AD1 begins in the top left corner and slopes down to the bottom center.Line AD2 follows the same slope as line AD1 but is plotted to the right.Points A and B are plotted along line AD1.Point A is a little less than half way along the left side of the line, and point B is little more than half way on the right side of the line.
Refer to Figure 9.1.Ceteris paribus, an increase in personal income taxes would be represented by a movement from
A)AD1 to AD2.
B)AD2 to AD1.
C)point A to point B.
D)point B to point A.
Alt text for Figure 9.1: In figure 9.1, a graph comparing real GDP and price level.Long description for Figure 9.1: The x-axis is labelled, real GDP, and the y-axis is labelled, price level, with 0 at the vertex.Line AD1 begins in the top left corner and slopes down to the bottom center.Line AD2 follows the same slope as line AD1 but is plotted to the right.Points A and B are plotted along line AD1.Point A is a little less than half way along the left side of the line, and point B is little more than half way on the right side of the line.
Refer to Figure 9.1.Ceteris paribus, an increase in personal income taxes would be represented by a movement from
A)AD1 to AD2.
B)AD2 to AD1.
C)point A to point B.
D)point B to point A.
Unlock Deck
Unlock for access to all 246 flashcards in this deck.
Unlock Deck
k this deck
22
Figure 9.1 Alt text for Figure 9.1: In figure 9.1, a graph comparing real GDP and price level.
Long description for Figure 9.1: The x-axis is labelled, real GDP, and the y-axis is labelled, price level, with 0 at the vertex.Line AD1 begins in the top left corner and slopes down to the bottom center.Line AD2 follows the same slope as line AD1 but is plotted to the right.Points A and B are plotted along line AD1.Point A is a little less than half way along the left side of the line, and point B is little more than half way on the right side of the line.
Refer to Figure 9.1.Ceteris paribus, an increase in the price level would be represented by a movement from
A)AD1 to AD2.
B)AD2 to AD1.
C)point A to point B.
D)point B to point A.
Alt text for Figure 9.1: In figure 9.1, a graph comparing real GDP and price level.Long description for Figure 9.1: The x-axis is labelled, real GDP, and the y-axis is labelled, price level, with 0 at the vertex.Line AD1 begins in the top left corner and slopes down to the bottom center.Line AD2 follows the same slope as line AD1 but is plotted to the right.Points A and B are plotted along line AD1.Point A is a little less than half way along the left side of the line, and point B is little more than half way on the right side of the line.
Refer to Figure 9.1.Ceteris paribus, an increase in the price level would be represented by a movement from
A)AD1 to AD2.
B)AD2 to AD1.
C)point A to point B.
D)point B to point A.
Unlock Deck
Unlock for access to all 246 flashcards in this deck.
Unlock Deck
k this deck
23
Figure 9.1 Alt text for Figure 9.1: In figure 9.1, a graph comparing real GDP and price level.
Long description for Figure 9.1: The x-axis is labelled, real GDP, and the y-axis is labelled, price level, with 0 at the vertex.Line AD1 begins in the top left corner and slopes down to the bottom center.Line AD2 follows the same slope as line AD1 but is plotted to the right.Points A and B are plotted along line AD1.Point A is a little less than half way along the left side of the line, and point B is little more than half way on the right side of the line.
Refer to Figure 9.1.Ceteris paribus, an increase in interest rates would be represented by a movement from
A)AD1 to AD2.
B)AD2 to AD1.
C)point A to point B.
D)point B to point A.
Alt text for Figure 9.1: In figure 9.1, a graph comparing real GDP and price level.Long description for Figure 9.1: The x-axis is labelled, real GDP, and the y-axis is labelled, price level, with 0 at the vertex.Line AD1 begins in the top left corner and slopes down to the bottom center.Line AD2 follows the same slope as line AD1 but is plotted to the right.Points A and B are plotted along line AD1.Point A is a little less than half way along the left side of the line, and point B is little more than half way on the right side of the line.
Refer to Figure 9.1.Ceteris paribus, an increase in interest rates would be represented by a movement from
A)AD1 to AD2.
B)AD2 to AD1.
C)point A to point B.
D)point B to point A.
Unlock Deck
Unlock for access to all 246 flashcards in this deck.
Unlock Deck
k this deck
24
An increase in imports increases aggregate demand.
Unlock Deck
Unlock for access to all 246 flashcards in this deck.
Unlock Deck
k this deck
25
The Liberal government raised income taxes for individuals earning very high incomes.Explain how these higher income taxes will affect the aggregate demand curve.
Unlock Deck
Unlock for access to all 246 flashcards in this deck.
Unlock Deck
k this deck
26
Suppose Canadian GDP growth rate is faster relative to other countries' GDP growth rates.This will
A)move the economy up along a stationary aggregate demand curve.
B)move the economy down along a stationary aggregate demand curve.
C)shift the aggregate demand curve to the left.
D)shift the aggregate demand curve to the right.
E)have no impact on Canada's aggregate demand curve.
A)move the economy up along a stationary aggregate demand curve.
B)move the economy down along a stationary aggregate demand curve.
C)shift the aggregate demand curve to the left.
D)shift the aggregate demand curve to the right.
E)have no impact on Canada's aggregate demand curve.
Unlock Deck
Unlock for access to all 246 flashcards in this deck.
Unlock Deck
k this deck
27
Using an aggregate demand graph, illustrate the impact of an increase in the price level on aggregate demand.
Unlock Deck
Unlock for access to all 246 flashcards in this deck.
Unlock Deck
k this deck
28
In September of 2007, the Bank of Canada dramatically reduced interest rates.Explain how lower interest rates affect the aggregate demand curve.
Unlock Deck
Unlock for access to all 246 flashcards in this deck.
Unlock Deck
k this deck
29
How do lower income taxes affect aggregate demand?
A)They increase disposable income, consumption, and aggregate demand.
B)They reduce disposable income, consumption, and aggregate demand.
C)They increase corporate investment and aggregate demand.
D)They increase aggregate supply and thus increase aggregate demand as well.
E)They reduce the price level relative to other countries, thus reducing aggregate demand.
Unlock Deck
Unlock for access to all 246 flashcards in this deck.
Unlock Deck
k this deck
30
Last week, six Swedish kronor could purchase one Canadian dollar.This week, it takes eight Swedish kronor to purchase one Canadian dollar.This change in the value of the dollar will ________ exports from Canada to Sweden and ________ Canadian aggregate demand.
A)increase; increase
B)decrease; decrease
C)increase; decrease
D)decrease; increase
A)increase; increase
B)decrease; decrease
C)increase; decrease
D)decrease; increase
Unlock Deck
Unlock for access to all 246 flashcards in this deck.
Unlock Deck
k this deck
31
Figure 9.1 Alt text for Figure 9.1: In figure 9.1, a graph comparing real GDP and price level.
Long description for Figure 9.1: The x-axis is labelled, real GDP, and the y-axis is labelled, price level, with 0 at the vertex.Line AD1 begins in the top left corner and slopes down to the bottom center.Line AD2 follows the same slope as line AD1 but is plotted to the right.Points A and B are plotted along line AD1.Point A is a little less than half way along the left side of the line, and point B is little more than half way on the right side of the line.
Refer to Figure 9.1.Ceteris paribus, a decrease in the growth rate of domestic GDP relative to the growth rate of foreign GDP would be represented by a movement from
A)AD1 to AD2.
B)AD2 to AD1.
C)point A to point B.
D)point B to point A.
Alt text for Figure 9.1: In figure 9.1, a graph comparing real GDP and price level.Long description for Figure 9.1: The x-axis is labelled, real GDP, and the y-axis is labelled, price level, with 0 at the vertex.Line AD1 begins in the top left corner and slopes down to the bottom center.Line AD2 follows the same slope as line AD1 but is plotted to the right.Points A and B are plotted along line AD1.Point A is a little less than half way along the left side of the line, and point B is little more than half way on the right side of the line.
Refer to Figure 9.1.Ceteris paribus, a decrease in the growth rate of domestic GDP relative to the growth rate of foreign GDP would be represented by a movement from
A)AD1 to AD2.
B)AD2 to AD1.
C)point A to point B.
D)point B to point A.
Unlock Deck
Unlock for access to all 246 flashcards in this deck.
Unlock Deck
k this deck
32
An increase in the price level shifts the aggregate demand curve to the left.
Unlock Deck
Unlock for access to all 246 flashcards in this deck.
Unlock Deck
k this deck
33
Figure 9.1 Alt text for Figure 9.1: In figure 9.1, a graph comparing real GDP and price level.
Long description for Figure 9.1: The x-axis is labelled, real GDP, and the y-axis is labelled, price level, with 0 at the vertex.Line AD1 begins in the top left corner and slopes down to the bottom center.Line AD2 follows the same slope as line AD1 but is plotted to the right.Points A and B are plotted along line AD1.Point A is a little less than half way along the left side of the line, and point B is little more than half way on the right side of the line.
Refer to Figure 9.1.Ceteris paribus, a decrease in firms' expectations of the future profitability of investment spending would be represented by a movement from
A)AD1 to AD2.
B)AD2 to AD1.
C)point A to point B.
D)point B to point A.
Alt text for Figure 9.1: In figure 9.1, a graph comparing real GDP and price level.Long description for Figure 9.1: The x-axis is labelled, real GDP, and the y-axis is labelled, price level, with 0 at the vertex.Line AD1 begins in the top left corner and slopes down to the bottom center.Line AD2 follows the same slope as line AD1 but is plotted to the right.Points A and B are plotted along line AD1.Point A is a little less than half way along the left side of the line, and point B is little more than half way on the right side of the line.
Refer to Figure 9.1.Ceteris paribus, a decrease in firms' expectations of the future profitability of investment spending would be represented by a movement from
A)AD1 to AD2.
B)AD2 to AD1.
C)point A to point B.
D)point B to point A.
Unlock Deck
Unlock for access to all 246 flashcards in this deck.
Unlock Deck
k this deck
34
A decrease in disposable income will shift the aggregate demand curve to the left.
Unlock Deck
Unlock for access to all 246 flashcards in this deck.
Unlock Deck
k this deck
35
Figure 9.1 Alt text for Figure 9.1: In figure 9.1, a graph comparing real GDP and price level.
Long description for Figure 9.1: The x-axis is labelled, real GDP, and the y-axis is labelled, price level, with 0 at the vertex.Line AD1 begins in the top left corner and slopes down to the bottom center.Line AD2 follows the same slope as line AD1 but is plotted to the right.Points A and B are plotted along line AD1.Point A is a little less than half way along the left side of the line, and point B is little more than half way on the right side of the line.
Refer to Figure 9.1.Ceteris paribus, an increase in the value of the domestic currency relative to foreign currencies would be represented by a movement from
A)AD1 to AD2.
B)AD2 to AD1.
C)point A to point B.
D)point B to point A.
Alt text for Figure 9.1: In figure 9.1, a graph comparing real GDP and price level.Long description for Figure 9.1: The x-axis is labelled, real GDP, and the y-axis is labelled, price level, with 0 at the vertex.Line AD1 begins in the top left corner and slopes down to the bottom center.Line AD2 follows the same slope as line AD1 but is plotted to the right.Points A and B are plotted along line AD1.Point A is a little less than half way along the left side of the line, and point B is little more than half way on the right side of the line.
Refer to Figure 9.1.Ceteris paribus, an increase in the value of the domestic currency relative to foreign currencies would be represented by a movement from
A)AD1 to AD2.
B)AD2 to AD1.
C)point A to point B.
D)point B to point A.
Unlock Deck
Unlock for access to all 246 flashcards in this deck.
Unlock Deck
k this deck
36
Figure 9.1 Alt text for Figure 9.1: In figure 9.1, a graph comparing real GDP and price level.
Long description for Figure 9.1: The x-axis is labelled, real GDP, and the y-axis is labelled, price level, with 0 at the vertex.Line AD1 begins in the top left corner and slopes down to the bottom center.Line AD2 follows the same slope as line AD1 but is plotted to the right.Points A and B are plotted along line AD1.Point A is a little less than half way along the left side of the line, and point B is little more than half way on the right side of the line.
Refer to Figure 9.1.Ceteris paribus, an increase in households' expectations of their future income would be represented by a movement from
A)AD1 to AD2.
B)AD2 to AD1.
C)point A to point B.
D)point B to point A.
Alt text for Figure 9.1: In figure 9.1, a graph comparing real GDP and price level.Long description for Figure 9.1: The x-axis is labelled, real GDP, and the y-axis is labelled, price level, with 0 at the vertex.Line AD1 begins in the top left corner and slopes down to the bottom center.Line AD2 follows the same slope as line AD1 but is plotted to the right.Points A and B are plotted along line AD1.Point A is a little less than half way along the left side of the line, and point B is little more than half way on the right side of the line.
Refer to Figure 9.1.Ceteris paribus, an increase in households' expectations of their future income would be represented by a movement from
A)AD1 to AD2.
B)AD2 to AD1.
C)point A to point B.
D)point B to point A.
Unlock Deck
Unlock for access to all 246 flashcards in this deck.
Unlock Deck
k this deck
37
If you noticed that fashion models were wearing longer skirts, the local store was sold out of lipstick, and skinny ties were all you saw for sale, it might be reasonable to assume
A)the aggregate demand curve was shifting left.
B)the aggregate demand curve was shifting right.
C)the federal government was in control of fashion.
D)the aggregate demand had a positive slope.
E)the aggregate supply curve was shifting left.
A)the aggregate demand curve was shifting left.
B)the aggregate demand curve was shifting right.
C)the federal government was in control of fashion.
D)the aggregate demand had a positive slope.
E)the aggregate supply curve was shifting left.
Unlock Deck
Unlock for access to all 246 flashcards in this deck.
Unlock Deck
k this deck
38
The mini recession that Canada experienced at the beginning of 2015 was most likely caused by
A)a drop in investment spending.
B)a drop in consumption spending.
C)a drop in government spending.
D)a drop in net exports.
E)a drop in aggregate supply.
A)a drop in investment spending.
B)a drop in consumption spending.
C)a drop in government spending.
D)a drop in net exports.
E)a drop in aggregate supply.
Unlock Deck
Unlock for access to all 246 flashcards in this deck.
Unlock Deck
k this deck
39
Figure 9.1 Alt text for Figure 9.1: In figure 9.1, a graph comparing real GDP and price level.
Long description for Figure 9.1: The x-axis is labelled, real GDP, and the y-axis is labelled, price level, with 0 at the vertex.Line AD1 begins in the top left corner and slopes down to the bottom center.Line AD2 follows the same slope as line AD1 but is plotted to the right.Points A and B are plotted along line AD1.Point A is a little less than half way along the left side of the line, and point B is little more than half way on the right side of the line.
Refer to Figure 9.1.Ceteris paribus, a decrease in government spending would be represented by a movement from
A)AD1 to AD2.
B)AD2 to AD1.
C)point A to point B.
D)point B to point A.
Alt text for Figure 9.1: In figure 9.1, a graph comparing real GDP and price level.Long description for Figure 9.1: The x-axis is labelled, real GDP, and the y-axis is labelled, price level, with 0 at the vertex.Line AD1 begins in the top left corner and slopes down to the bottom center.Line AD2 follows the same slope as line AD1 but is plotted to the right.Points A and B are plotted along line AD1.Point A is a little less than half way along the left side of the line, and point B is little more than half way on the right side of the line.
Refer to Figure 9.1.Ceteris paribus, a decrease in government spending would be represented by a movement from
A)AD1 to AD2.
B)AD2 to AD1.
C)point A to point B.
D)point B to point A.
Unlock Deck
Unlock for access to all 246 flashcards in this deck.
Unlock Deck
k this deck
40
If aggregate demand just increased, which of the following may have caused the increase?
A)an increase in government purchases
B)an increase in the interest rate
C)an increase in the price level
D)an increase in imports
E)an increase in taxes
A)an increase in government purchases
B)an increase in the interest rate
C)an increase in the price level
D)an increase in imports
E)an increase in taxes
Unlock Deck
Unlock for access to all 246 flashcards in this deck.
Unlock Deck
k this deck
41
Canada suffered a mini recession in the first half of 2015 due to
A)falling consumer confidence.
B)falling government spending.
C)the rising value of the Canadian dollar.
D)falling investment spending.
E)rising imports from China.
A)falling consumer confidence.
B)falling government spending.
C)the rising value of the Canadian dollar.
D)falling investment spending.
E)rising imports from China.
Unlock Deck
Unlock for access to all 246 flashcards in this deck.
Unlock Deck
k this deck
42
Which of the following is the most likely explanation for Canada's mini recession in 2015?
A)Ontario car makers became more optimistic about export opportunities in the United States.
B)Households became more concerned about their future incomes.
C)The government was rapidly cutting spending in attempt to balance the budget.
D)Falling oil prices made investing new oil rigs and processing facilities less attractive investments.
E)Canada entered into a trade war with Europe.
Unlock Deck
Unlock for access to all 246 flashcards in this deck.
Unlock Deck
k this deck
43
When the price level in Canada rises relative to the price level of other countries, ________ will rise, ________ will fall, and ________ will fall.
A)imports; exports; net exports
B)exports; imports; net exports
C)net exports; exports; imports
D)net exports; imports; exports
E)exports; net exports; imports
A)imports; exports; net exports
B)exports; imports; net exports
C)net exports; exports; imports
D)net exports; imports; exports
E)exports; net exports; imports
Unlock Deck
Unlock for access to all 246 flashcards in this deck.
Unlock Deck
k this deck
44
Why is the business cycle so important to Canadian National Railway?
A)Canadian National Railway plays a key role in setting the price level.
B)Fewer goods are shipped by rail now than in the past.
C)Consumer spending rises and falls with the business cycle, which causes demand for shipping services to rise and fall.
D)The business cycle causes consumers to permanently increase their consumption of services, permanently reducing the demand for shipping by rail.
E)The business cycle causes the federal government to invest more in upgrading the railway system.
Unlock Deck
Unlock for access to all 246 flashcards in this deck.
Unlock Deck
k this deck
45
Using an aggregate demand graph, illustrate the impact of an increase in the interest rate.
Unlock Deck
Unlock for access to all 246 flashcards in this deck.
Unlock Deck
k this deck
46
Lower personal income taxes
A)increase aggregate demand.
B)decrease disposable income.
C)decrease aggregate demand.
D)increase transfer payments.
E)reduce household wealth.
A)increase aggregate demand.
B)decrease disposable income.
C)decrease aggregate demand.
D)increase transfer payments.
E)reduce household wealth.
Unlock Deck
Unlock for access to all 246 flashcards in this deck.
Unlock Deck
k this deck
47
According to the "wealth effect," when the ________ falls, the ________ rises.
A)inflation rate; nominal value of household assets
B)unemployment rate; average level of household income
C)price level; the nominal value of household wealth
D)price level; the real value of household wealth
E)the return of savings; the nominal value of household savings
A)inflation rate; nominal value of household assets
B)unemployment rate; average level of household income
C)price level; the nominal value of household wealth
D)price level; the real value of household wealth
E)the return of savings; the nominal value of household savings
Unlock Deck
Unlock for access to all 246 flashcards in this deck.
Unlock Deck
k this deck
48
A decrease in the price level will
A)shift the aggregate demand curve to the left.
B)shift the aggregate demand curve to the right.
C)move the economy up along a stationary aggregate demand curve.
D)move the economy down along a stationary aggregate demand curve.
E)have no impact on the economy.
A)shift the aggregate demand curve to the left.
B)shift the aggregate demand curve to the right.
C)move the economy up along a stationary aggregate demand curve.
D)move the economy down along a stationary aggregate demand curve.
E)have no impact on the economy.
Unlock Deck
Unlock for access to all 246 flashcards in this deck.
Unlock Deck
k this deck
49
The international trade effect states that a(n)________ in the price level will ________ net exports.
A)increase; increase
B)increase; decrease
C)decrease; decrease
D)decrease; not affect
A)increase; increase
B)increase; decrease
C)decrease; decrease
D)decrease; not affect
Unlock Deck
Unlock for access to all 246 flashcards in this deck.
Unlock Deck
k this deck
50
Which of the following best describes the "interest rate effect"?
A)An increase in the price level raises the interest rate and chokes off government spending.
B)An increase in the price level lowers the interest rate and chokes off government spending.
C)An increase in the price level raises the interest rate and chokes off investment and consumption spending.
D)An increase in the price level lowers the interest rate and chokes off investment and consumption spending.
E)An increase in the price level raises the unemployment rate and chokes of interest in participating the in labour market.
Unlock Deck
Unlock for access to all 246 flashcards in this deck.
Unlock Deck
k this deck
51
Which of the following is one explanation as to why the aggregate demand curve slopes downward?
A)Increases in the price level lower the interest rate and decrease consumption spending.
B)Increases in the price level lower the interest rate and decrease investment spending.
C)Increases in the Canadian price level relative to the price level in other countries lower net exports.
D)Increases in the price level raise real wealth and lower consumption spending.
E)Increasing prices reduce nominal interest rates and spur additional government spending.
Unlock Deck
Unlock for access to all 246 flashcards in this deck.
Unlock Deck
k this deck
52
Falling oil prices made consumers in Alberta very pessimistic about their future incomes.How will this increased pessimism affect the aggregate demand curve?
A)It will move the economy up along a stationary aggregate demand curve.
B)It will move the economy down along a stationary aggregate demand curve.
C)It will shift the aggregate demand curve to the left.
D)It will shift the aggregate demand curve to the right.
E)It will shift aggregate supply to the left.
Unlock Deck
Unlock for access to all 246 flashcards in this deck.
Unlock Deck
k this deck
53
Inflation will
A)increase aggregate demand.
B)increase the quantity of real GDP demanded.
C)decrease aggregate demand.
D)decrease the quantity of real GDP demanded.
E)increase aggregate supply.
A)increase aggregate demand.
B)increase the quantity of real GDP demanded.
C)decrease aggregate demand.
D)decrease the quantity of real GDP demanded.
E)increase aggregate supply.
Unlock Deck
Unlock for access to all 246 flashcards in this deck.
Unlock Deck
k this deck
54
Spending on the military is essentially categorized as government purchases.How do increases in spending on a military campaign affect the aggregate demand curve?
A)They will move the economy down along a stationary aggregate demand curve.
B)They will move the economy up along a stationary aggregate demand curve.
C)They will shift the aggregate demand curve to the right.
D)They will shift the aggregate demand curve to the left.
E)As military personnel are not considered part of the labour force, a military campaign will have no impact on the economy.
Unlock Deck
Unlock for access to all 246 flashcards in this deck.
Unlock Deck
k this deck
55
The aggregate demand curve shows the relationship between the ________ and ________.
A)inflation rate; quantity of real GDP demanded
B)real interest rate; quantity of real GDP supplied
C)nominal interest rate; quantity of real GDP demanded
D)price level; quantity of real GDP demanded
E)inflation rate; unemployment
A)inflation rate; quantity of real GDP demanded
B)real interest rate; quantity of real GDP supplied
C)nominal interest rate; quantity of real GDP demanded
D)price level; quantity of real GDP demanded
E)inflation rate; unemployment
Unlock Deck
Unlock for access to all 246 flashcards in this deck.
Unlock Deck
k this deck
56
The basic aggregate demand and aggregate supply curve model helps explain ________ fluctuations in real GDP and the price level.
A)short-term
B)long-term
C)both short-term and long-term
D)unrelated
E)government caused
A)short-term
B)long-term
C)both short-term and long-term
D)unrelated
E)government caused
Unlock Deck
Unlock for access to all 246 flashcards in this deck.
Unlock Deck
k this deck
57
A decrease in the price level results in a(n)________ in the quantity of real GDP demanded because a lower price level ________ consumption, investment, and net exports.
A)decrease; increases
B)increase; increases
C)decrease; decreases
D)increase; decreases
A)decrease; increases
B)increase; increases
C)decrease; decreases
D)increase; decreases
Unlock Deck
Unlock for access to all 246 flashcards in this deck.
Unlock Deck
k this deck
58
Which of the following will shift the aggregate demand curve to the left, ceteris paribus?
A)an increase in interest rates
B)an increase in disposable income
C)an increase in expected profits for firms
D)an increase in net exports
E)an increase in the price level
A)an increase in interest rates
B)an increase in disposable income
C)an increase in expected profits for firms
D)an increase in net exports
E)an increase in the price level
Unlock Deck
Unlock for access to all 246 flashcards in this deck.
Unlock Deck
k this deck
59
Which of the following would not be considered a positive addition to household wealth?
A)the equity in one's home
B)1000 shares of Bank of Montreal stock
C)a credit card balance
D)the balance in your chequing account
E)a drop in the price level
A)the equity in one's home
B)1000 shares of Bank of Montreal stock
C)a credit card balance
D)the balance in your chequing account
E)a drop in the price level
Unlock Deck
Unlock for access to all 246 flashcards in this deck.
Unlock Deck
k this deck
60
Because of the slope(s)of the ________, we can say that a decrease in the price level leads to a higher level of real GDP demanded.
A)aggregate demand curve
B)short-run aggregate supply curve
C)long-run aggregate supply curve
D)short-run and long-run aggregate supply curves
E)consumption function
A)aggregate demand curve
B)short-run aggregate supply curve
C)long-run aggregate supply curve
D)short-run and long-run aggregate supply curves
E)consumption function
Unlock Deck
Unlock for access to all 246 flashcards in this deck.
Unlock Deck
k this deck
61
On the long-run aggregate supply curve,
A)a decrease in the price level decreases the level of potential GDP.
B)a decrease in the price level increases the aggregate quantity of GDP supplied.
C)a decrease in the price level decreases the aggregate quantity of GDP supplied.
D)a decrease in the price level has no effect on the aggregate quantity of GDP supplied.
E)only decreases in the price level caused by shifts in aggregate demand increase the aggregate quantity of GDP supplied.
Unlock Deck
Unlock for access to all 246 flashcards in this deck.
Unlock Deck
k this deck
62
Using an aggregate demand graph, illustrate the impact of an increase in the growth rate of Canadian GDP relative to the growth rate of foreign GDP.
Unlock Deck
Unlock for access to all 246 flashcards in this deck.
Unlock Deck
k this deck
63
An increase in the price level causes a movement down the aggregate demand curve.
Unlock Deck
Unlock for access to all 246 flashcards in this deck.
Unlock Deck
k this deck
64
How do changes in income tax policies affect aggregate demand?
A)Higher taxes increase disposable income, consumption, and aggregate demand.
B)Higher taxes reduce disposable income, consumption, and aggregate demand.
C)Higher taxes increase corporate investment and aggregate demand.
D)Higher taxes increase aggregate supply and thus increase aggregate demand as well.
E)Higher taxes increase government revenue, which makes consumers more confident in the future, which increases aggregate demand.
Unlock Deck
Unlock for access to all 246 flashcards in this deck.
Unlock Deck
k this deck
65
An increase in disposable income will shift the aggregate demand curve to the right.
Unlock Deck
Unlock for access to all 246 flashcards in this deck.
Unlock Deck
k this deck
66
Full-employment GDP is also known as
A)realized GDP.
B)potential GDP.
C)politico-economic GDP.
D)balanced-budget GDP.
E)zero unemployment GDP.
A)realized GDP.
B)potential GDP.
C)politico-economic GDP.
D)balanced-budget GDP.
E)zero unemployment GDP.
Unlock Deck
Unlock for access to all 246 flashcards in this deck.
Unlock Deck
k this deck
67
The level of aggregate supply in the long run is not affected by
A)changes in technology.
B)changes in the capital stock.
C)changes in the price level.
D)changes in the number of workers.
E)changes in the availability of natural resources.
A)changes in technology.
B)changes in the capital stock.
C)changes in the price level.
D)changes in the number of workers.
E)changes in the availability of natural resources.
Unlock Deck
Unlock for access to all 246 flashcards in this deck.
Unlock Deck
k this deck
68
If aggregate demand just decreased, which of the following may have caused the decrease?
A)a decrease in exports
B)a decrease in the interest rate
C)a decrease in the price level
D)a decrease in imports
E)a decrease in the income tax rate
A)a decrease in exports
B)a decrease in the interest rate
C)a decrease in the price level
D)a decrease in imports
E)a decrease in the income tax rate
Unlock Deck
Unlock for access to all 246 flashcards in this deck.
Unlock Deck
k this deck
69
Explain the three reasons the aggregate demand curve slopes downward.
Unlock Deck
Unlock for access to all 246 flashcards in this deck.
Unlock Deck
k this deck
70
Explain how each of the following events would affect the aggregate demand curve.
a.lower interest rates
b.a decrease in net exports
c.a decrease in the price level
d.slower income growth in other countries
e.a decrease in imports
a.lower interest rates
b.a decrease in net exports
c.a decrease in the price level
d.slower income growth in other countries
e.a decrease in imports
Unlock Deck
Unlock for access to all 246 flashcards in this deck.
Unlock Deck
k this deck
71
Suppose the Canadian GDP growth rate is slower relative to other countries' GDP growth rates.This will
A)move the economy up along a stationary aggregate demand curve.
B)move the economy down along a stationary aggregate demand curve.
C)shift the aggregate demand curve to the left.
D)shift the aggregate demand curve to the right.
E)have no impact on aggregate demand.
A)move the economy up along a stationary aggregate demand curve.
B)move the economy down along a stationary aggregate demand curve.
C)shift the aggregate demand curve to the left.
D)shift the aggregate demand curve to the right.
E)have no impact on aggregate demand.
Unlock Deck
Unlock for access to all 246 flashcards in this deck.
Unlock Deck
k this deck
72
If stricter immigration laws are imposed and many foreign workers in Canada are forced to go back to their home countries,
A)the long-run aggregate supply curve will shift to the right.
B)the long-run aggregate supply curve will shift to the left.
C)we will move up along the long-run aggregate supply curve.
D)we will move down along the long-run aggregate supply curve.
E)the short-run aggregate supply curve will shift to the right.
Unlock Deck
Unlock for access to all 246 flashcards in this deck.
Unlock Deck
k this deck
73
Last week, 16 Mexican pesos could purchase one Canadian dollar.This week, it takes 14 Mexican pesos to purchase one Canadian dollar.This change in the value of the dollar will ________ exports from Canada to Mexico and ________ Canadian aggregate demand.
A)increase; increase
B)decrease; decrease
C)increase; decrease
D)decrease; increase
A)increase; increase
B)decrease; decrease
C)increase; decrease
D)decrease; increase
Unlock Deck
Unlock for access to all 246 flashcards in this deck.
Unlock Deck
k this deck
74
The long-run aggregate supply curve shows the relationship between the ________ and ________.
A)inflation rate; quantity of real GDP demanded
B)real interest rate; quantity of real GDP supplied
C)nominal interest rate; quantity of real GDP supplied
D)price level; quantity of real GDP supplied
E)inflation rate; labour supply
A)inflation rate; quantity of real GDP demanded
B)real interest rate; quantity of real GDP supplied
C)nominal interest rate; quantity of real GDP supplied
D)price level; quantity of real GDP supplied
E)inflation rate; labour supply
Unlock Deck
Unlock for access to all 246 flashcards in this deck.
Unlock Deck
k this deck
75
If the Canadian dollar increases in value relative to other currencies, how does this affect the aggregate demand curve?
A)This will move the economy up along a stationary aggregate demand curve.
B)This will move the economy down along a stationary aggregate demand curve.
C)This will shift the aggregate demand curve to the left.
D)This will shift the aggregate demand curve to the right.
E)This will shift the aggregate supply curve to the left as the result of foreign direct investment.
Unlock Deck
Unlock for access to all 246 flashcards in this deck.
Unlock Deck
k this deck
76
The long-run aggregate supply curve
A)has a negative slope.
B)has a steep but positive slope.
C)is horizontal.
D)is vertical.
E)has steep by negative slope.
A)has a negative slope.
B)has a steep but positive slope.
C)is horizontal.
D)is vertical.
E)has steep by negative slope.
Unlock Deck
Unlock for access to all 246 flashcards in this deck.
Unlock Deck
k this deck
77
Potential GDP refers to the level of
A)real GDP in the long run.
B)nominal GDP in the long run.
C)real GDP in the short run.
D)nominal GDP in the short run.
E)the maximum real GDP possible.
A)real GDP in the long run.
B)nominal GDP in the long run.
C)real GDP in the short run.
D)nominal GDP in the short run.
E)the maximum real GDP possible.
Unlock Deck
Unlock for access to all 246 flashcards in this deck.
Unlock Deck
k this deck
78
What is potential GDP?
A)It is the level of real GDP in the long run.
B)It is the difference between current GDP and maximum GDP.
C)It is the level of real GDP in the short run.
D)It is the level of GDP at which inflation is constant.
E)It is the maximum output possible in a period of time.
A)It is the level of real GDP in the long run.
B)It is the difference between current GDP and maximum GDP.
C)It is the level of real GDP in the short run.
D)It is the level of GDP at which inflation is constant.
E)It is the maximum output possible in a period of time.
Unlock Deck
Unlock for access to all 246 flashcards in this deck.
Unlock Deck
k this deck
79
The federal government lowered income taxes for individuals in 2009.Explain how lower income taxes affect the aggregate demand curve.
Unlock Deck
Unlock for access to all 246 flashcards in this deck.
Unlock Deck
k this deck
80
An increase in exports decreases aggregate demand.
Unlock Deck
Unlock for access to all 246 flashcards in this deck.
Unlock Deck
k this deck
Unlock Deck
Unlock for access to all 246 flashcards in this deck.


