Deck 4: Simple Linear Regression
Full screen (f)
Question
Question
Suppose you determine the estimated sample regression function to be 
You would conclude that
A)yi is estimated to equal 473.65 when xi = 0.
B)yi is estimated to increase by 473.65 for every one unit increase in xi.
C)yi is estimated to decrease by 473.65 for every one unit increase in xi.
D)yi is estimated to increase by 1,016.82 for every one unit increase in xi.
You would conclude that
A)yi is estimated to equal 473.65 when xi = 0.
B)yi is estimated to increase by 473.65 for every one unit increase in xi.
C)yi is estimated to decrease by 473.65 for every one unit increase in xi.
D)yi is estimated to increase by 1,016.82 for every one unit increase in xi.
Question
Question
Question
Question
The estimated slope coefficient is
A)the estimated marginal effect of x on y.
B)the estimated value of y when x equals 0.
C)equal to the population slope coefficient.
D) .
.
A)the estimated marginal effect of x on y.
B)the estimated value of y when x equals 0.
C)equal to the population slope coefficient.
D)
. Question
Suppose you determine the estimated sample regression function to be 
You would conclude that
A)yi is estimated to increase by 687.51 for every one unit increase in xi.
B)yi is estimated to increase by 3,212.97 for every one unit increase in xi.
C)yi is estimated to decrease by 3,212.97 for every one unit increase in xi.
D) is estimated to equal 3,212.97 when xi = 0.
You would conclude that
A)yi is estimated to increase by 687.51 for every one unit increase in xi.
B)yi is estimated to increase by 3,212.97 for every one unit increase in xi.
C)yi is estimated to decrease by 3,212.97 for every one unit increase in xi.
D)
is estimated to equal 3,212.97 when xi = 0. Question
Question
Question
Suppose you determine the estimated sample regression function to be 
You would conclude that
A) is estimated to equal 687.51 when xi = 0.
B)yi is estimated to increase by 3,212.97 for every one unit increase in xi.
C)yi is estimated to decrease by 687.51 for every one unit increase in xi.
D)yi is estimated to equal 3,212.97 when xi = 0.
You would conclude that
A)
is estimated to equal 687.51 when xi = 0.B)yi is estimated to increase by 3,212.97 for every one unit increase in xi.
C)yi is estimated to decrease by 687.51 for every one unit increase in xi.
D)yi is estimated to equal 3,212.97 when xi = 0.
Question
Question
Question
Question
The estimated intercept
A)is the estimated marginal effect of x on y.
B)is the estimated value of y when x equals 0.
C)is equal to the population intercept.
D)is .
.
A)is the estimated marginal effect of x on y.
B)is the estimated value of y when x equals 0.
C)is equal to the population intercept.
D)is
. Question
Question
Question
Question
Question
Question
Question
Figure: 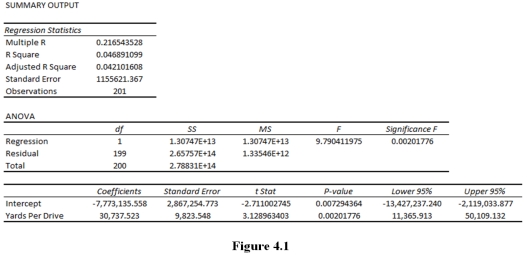
Suppose you are given the Excel output in Figure 4.1.You would conclude that each additional Yard Per Drive is estimated to be associated with
A)a $7,773,135.558 decrease in annual earnings.
B)a $2,867,254.773 increase in annual earnings.
C)a $30,737.523 increase in annual earnings.
D)a $9,823.548 increase in annual earnings.
Question
Question
In general,a larger 
Tends to suggest that
A)the estimated sample regression function explains a greater percentage of the total variation in y.
B)the estimated sample regression function is more accurate.
C)the data points fall closer to the best-fit line.
D)the data points fall further from the best-fit line.
Tends to suggest that
A)the estimated sample regression function explains a greater percentage of the total variation in y.
B)the estimated sample regression function is more accurate.
C)the data points fall closer to the best-fit line.
D)the data points fall further from the best-fit line.
Question
Question
Question
Question
Question
The standard error of the estimated sample regression function 
Is
A)the square root of the unexplained sum of squares.
B)the square root of the explained sum of squares.
C)the square root of the unexplained sum of squares divided by the degree of freedom of the regression.
D)the square root of the explained sum of squares divided by the degree of freedom.
Is
A)the square root of the unexplained sum of squares.
B)the square root of the explained sum of squares.
C)the square root of the unexplained sum of squares divided by the degree of freedom of the regression.
D)the square root of the explained sum of squares divided by the degree of freedom.
Question
Question
Question
Question
Question
Question
Question
Figure:
Suppose you are given the Excel output in 4.1.You would conclude that the estimated sample regression function explains
A)21.65 percent of the total variation in annual earnings.
B)4.69 percent of the total variation in annual earnings.
C)4.21 percent of the total variation in annual earnings.
D)0.02 percent of the total variation in annual earnings.
Question
Question
Figure:
Suppose you are given the Excel output in 4.1.You would conclude that the standard error of the estimated sample regression function
Is
A)0.2165.
B)0.0469.
C)1,155,621.367.
D)201.
Suppose you are given the Excel output in 4.1.You would conclude that the standard error of the estimated sample regression function
Is
A)0.2165.
B)0.0469.
C)1,155,621.367.
D)201.
Question
Question
Question
Question
Question
Suppose that you regress the total number of medals that a country won in the 2008 Olympics on GDP per capita and that you get the results in Figure 4.2. 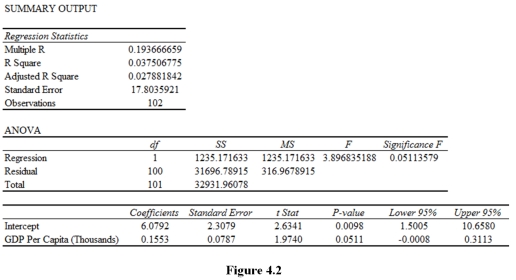
How would you interpret these results? What would you say about the Goodness-of-Fit of the regression? Explain.
What would be the predicted number of medals for a country with a GDP per capita of $25,000? $40,000? Show your work.
How would you interpret these results? What would you say about the Goodness-of-Fit of the regression? Explain.
What would be the predicted number of medals for a country with a GDP per capita of $25,000? $40,000? Show your work.
Question
Suppose you regress the number of days that individuals report having hunted in the past year on years of education and that you get the results in Figure 4.3. 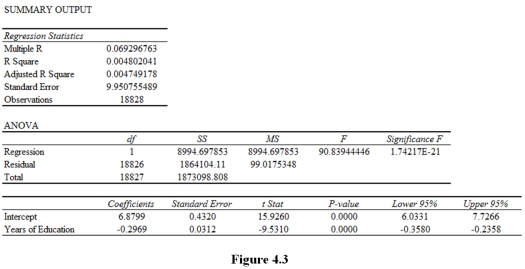
How would you interpret these results? What would you say about the Goodness-of-Fit of the regression? Explain.
What would be the predicted number of hunting days for an individual with 12 years of education? 16 years of education? Show your work.
How would you interpret these results? What would you say about the Goodness-of-Fit of the regression? Explain.
What would be the predicted number of hunting days for an individual with 12 years of education? 16 years of education? Show your work.
Question
A counselor working with teenagers is interested in the relationship between anxiety and depression.The counselor administers a depression and anxiety test to each teenager.The scores obtained from the administration of the two inventories are given below. 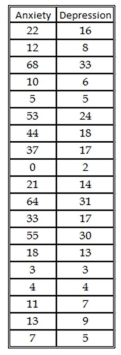
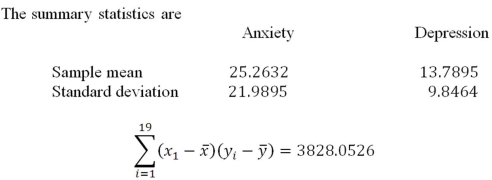
a.If anxiety is the independent variable and depression is the dependent variable,what is the sample regression function? What do the estimated slope and intercept mean in context of this problem?
b.What is R-squared and what does it mean?
c.If an individual had an anxiety score of 40,what is their predicted level of depression?

Unlock Deck
Sign up to unlock the cards in this deck!
Unlock Deck
Unlock Deck
1/44
Play
Full screen (f)
Deck 4: Simple Linear Regression
1
The estimated slope coefficient is
A)the ratio of the variance of y to the variance of x.
B)the ratio of the variance of x to the variance of y.
C)the ratio of the covariance between x and y to the variance of x.
D)the covariance between x and y.
A)the ratio of the variance of y to the variance of x.
B)the ratio of the variance of x to the variance of y.
C)the ratio of the covariance between x and y to the variance of x.
D)the covariance between x and y.
C
2
Suppose you determine the estimated sample regression function to be
You would conclude that
A)yi is estimated to equal 473.65 when xi = 0.
B)yi is estimated to increase by 473.65 for every one unit increase in xi.
C)yi is estimated to decrease by 473.65 for every one unit increase in xi.
D)yi is estimated to increase by 1,016.82 for every one unit increase in xi.
You would conclude that
A)yi is estimated to equal 473.65 when xi = 0.
B)yi is estimated to increase by 473.65 for every one unit increase in xi.
C)yi is estimated to decrease by 473.65 for every one unit increase in xi.
D)yi is estimated to increase by 1,016.82 for every one unit increase in xi.
B
3
The estimated slope coefficient
A)is the true value of the population slope coefficient.
B)is found in the population regression model.
C)is found by minimizing the sum of squared residuals.
D)is the predicted value of the dependent variable.
A)is the true value of the population slope coefficient.
B)is found in the population regression model.
C)is found by minimizing the sum of squared residuals.
D)is the predicted value of the dependent variable.
C
4
The term "goodness-of-fit" refers to
A)the accuracy of the estimated sample regression function.
B)whether or not the estimated sample regression function is correct.
C)method by which we determine the best-fit line.
D)the extent to which observed data match the values expected by theory.
A)the accuracy of the estimated sample regression function.
B)whether or not the estimated sample regression function is correct.
C)method by which we determine the best-fit line.
D)the extent to which observed data match the values expected by theory.
Unlock Deck
Unlock for access to all 44 flashcards in this deck.
Unlock Deck
k this deck
5
In simple linear regression analysis,the independent variable is
A)the variable that changes in response to changes in an independent variable.
B)the variable whose changes affect the dependent variable.
C)the left-hand side variable.
D)can be either variable.
A)the variable that changes in response to changes in an independent variable.
B)the variable whose changes affect the dependent variable.
C)the left-hand side variable.
D)can be either variable.
Unlock Deck
Unlock for access to all 44 flashcards in this deck.
Unlock Deck
k this deck
6
The estimated slope coefficient is
A)the estimated marginal effect of x on y.
B)the estimated value of y when x equals 0.
C)equal to the population slope coefficient.
D) .
A)the estimated marginal effect of x on y.
B)the estimated value of y when x equals 0.
C)equal to the population slope coefficient.
D)
. Unlock Deck
Unlock for access to all 44 flashcards in this deck.
Unlock Deck
k this deck
7
Suppose you determine the estimated sample regression function to be
You would conclude that
A)yi is estimated to increase by 687.51 for every one unit increase in xi.
B)yi is estimated to increase by 3,212.97 for every one unit increase in xi.
C)yi is estimated to decrease by 3,212.97 for every one unit increase in xi.
D) is estimated to equal 3,212.97 when xi = 0.
You would conclude that
A)yi is estimated to increase by 687.51 for every one unit increase in xi.
B)yi is estimated to increase by 3,212.97 for every one unit increase in xi.
C)yi is estimated to decrease by 3,212.97 for every one unit increase in xi.
D)
is estimated to equal 3,212.97 when xi = 0. Unlock Deck
Unlock for access to all 44 flashcards in this deck.
Unlock Deck
k this deck
8
The explained variation in y is
A)the distance between the best-fit line and the data points.
B)the distance between the mean and the predicted value of y.
C)the distance between the mean and the data points.
D)the distance between the observed and predicted values of y.
A)the distance between the best-fit line and the data points.
B)the distance between the mean and the predicted value of y.
C)the distance between the mean and the data points.
D)the distance between the observed and predicted values of y.
Unlock Deck
Unlock for access to all 44 flashcards in this deck.
Unlock Deck
k this deck
9
The residual is
A)the difference between the observed value of the dependent variable and the observed value of the independent variable.
B)the difference between the observed value of the dependent variable and the predicted value of the dependent variable.
C)the difference between the predicted value of the dependent variable and the predicted value of the independent variable.
D)the difference between the predicted value of the independent variable and the observed value of the independent variable.
Unlock Deck
Unlock for access to all 44 flashcards in this deck.
Unlock Deck
k this deck
10
Suppose you determine the estimated sample regression function to be
You would conclude that
A) is estimated to equal 687.51 when xi = 0.
B)yi is estimated to increase by 3,212.97 for every one unit increase in xi.
C)yi is estimated to decrease by 687.51 for every one unit increase in xi.
D)yi is estimated to equal 3,212.97 when xi = 0.
You would conclude that
A)
is estimated to equal 687.51 when xi = 0.B)yi is estimated to increase by 3,212.97 for every one unit increase in xi.
C)yi is estimated to decrease by 687.51 for every one unit increase in xi.
D)yi is estimated to equal 3,212.97 when xi = 0.
Unlock Deck
Unlock for access to all 44 flashcards in this deck.
Unlock Deck
k this deck
11
A marginal effect indicates
A)the predicted value of the dependent variable,holding all else constant.
B)the effect that a one-unit change in the independent variable is expected to have on the dependent variable,holding all else constant.
C)the effect that a one-unit change in the dependent variable is expected to have on the independent variable,holding all else constant.
D)the predicted value of the dependent variable when the independent variable equals 0,holding all else constant.
Unlock Deck
Unlock for access to all 44 flashcards in this deck.
Unlock Deck
k this deck
12
The residual is
A)the vertical distance between the observed value of y and the mean value of y.
B)the vertical distance between the predicted value of y and the mean value of y.
C)the vertical distance between the observed value of y and the probabilistic value of y.
D)the vertical distance between the observed value of y and the predicted value of y.
Unlock Deck
Unlock for access to all 44 flashcards in this deck.
Unlock Deck
k this deck
13
We determine the estimated sample regression function by
A)minimizing the total deviations from the mean.
B)maximizing the sum of squared residuals.
C)minimizing the sum of squared residuals.
D)minimizing the least absolute deviations from the mean.
A)minimizing the total deviations from the mean.
B)maximizing the sum of squared residuals.
C)minimizing the sum of squared residuals.
D)minimizing the least absolute deviations from the mean.
Unlock Deck
Unlock for access to all 44 flashcards in this deck.
Unlock Deck
k this deck
14
The estimated intercept
A)is the estimated marginal effect of x on y.
B)is the estimated value of y when x equals 0.
C)is equal to the population intercept.
D)is .
A)is the estimated marginal effect of x on y.
B)is the estimated value of y when x equals 0.
C)is equal to the population intercept.
D)is
. Unlock Deck
Unlock for access to all 44 flashcards in this deck.
Unlock Deck
k this deck
15
Simple linear regression analysis determines
A)the true value of the population slope coefficient.
B)the linear relationship between two random variables.
C)the linear relationship between many different random variables.
D)the true value of the population intercept.
A)the true value of the population slope coefficient.
B)the linear relationship between two random variables.
C)the linear relationship between many different random variables.
D)the true value of the population intercept.
Unlock Deck
Unlock for access to all 44 flashcards in this deck.
Unlock Deck
k this deck
16
In simple linear regression analysis,the dependent variable
A)is the variable that changes in response to changes in an independent variable.
B)is the variable whose changes affect the dependent variable.
C)is on the right-hand side variable.
D)can be either variable.
A)is the variable that changes in response to changes in an independent variable.
B)is the variable whose changes affect the dependent variable.
C)is on the right-hand side variable.
D)can be either variable.
Unlock Deck
Unlock for access to all 44 flashcards in this deck.
Unlock Deck
k this deck
17
The population regression model includes all of the following except
A)the random error component.
B)the population slope coefficient.
C)the population intercept.
D)the estimated slope coefficient.
A)the random error component.
B)the population slope coefficient.
C)the population intercept.
D)the estimated slope coefficient.
Unlock Deck
Unlock for access to all 44 flashcards in this deck.
Unlock Deck
k this deck
18
The error term includes all of the following except
A)omitted variables.
B)deterministic relationships.
C)incorrect functional form.
D)measurement error.
A)omitted variables.
B)deterministic relationships.
C)incorrect functional form.
D)measurement error.
Unlock Deck
Unlock for access to all 44 flashcards in this deck.
Unlock Deck
k this deck
19
The predicted value of yi is
A)the value that yi takes on when xiequals 0.
B)the effect that a one-unit change in the dependent variable is expected to have on the independent variable,holding all else constant.
C)the value of yi when the slope is multiplied a specific xi and then that value is added to the intercept.
D)the observed value of the dependent variable that is associated with a specific value of the independent variable.
Unlock Deck
Unlock for access to all 44 flashcards in this deck.
Unlock Deck
k this deck
20
A probabilistic relationship is one for which
A)the value of the dependent variable is perfectly determined by the value of the independent variable.
B)all data points fall on the same line.
C)there is no random error component.
D)the value of the dependent variable is related to the value of the independent variable but the data points do not fall on the same line.
Unlock Deck
Unlock for access to all 44 flashcards in this deck.
Unlock Deck
k this deck
21
Figure:
Suppose you are given the Excel output in Figure 4.1.You would conclude that each additional Yard Per Drive is estimated to be associated with
A)a $7,773,135.558 decrease in annual earnings.
B)a $2,867,254.773 increase in annual earnings.
C)a $30,737.523 increase in annual earnings.
D)a $9,823.548 increase in annual earnings.
Unlock Deck
Unlock for access to all 44 flashcards in this deck.
Unlock Deck
k this deck
22
The number of degrees of freedom
A)is always n - k - 1.
B)is always n - 1.
C)is the number of values in the final calculation that are free to vary.
D)is the number of values in the final calculation that are not free to vary.
A)is always n - k - 1.
B)is always n - 1.
C)is the number of values in the final calculation that are free to vary.
D)is the number of values in the final calculation that are not free to vary.
Unlock Deck
Unlock for access to all 44 flashcards in this deck.
Unlock Deck
k this deck
23
In general,a larger
Tends to suggest that
A)the estimated sample regression function explains a greater percentage of the total variation in y.
B)the estimated sample regression function is more accurate.
C)the data points fall closer to the best-fit line.
D)the data points fall further from the best-fit line.
Tends to suggest that
A)the estimated sample regression function explains a greater percentage of the total variation in y.
B)the estimated sample regression function is more accurate.
C)the data points fall closer to the best-fit line.
D)the data points fall further from the best-fit line.
Unlock Deck
Unlock for access to all 44 flashcards in this deck.
Unlock Deck
k this deck
24
Suppose you wish to determine the degree to which annual earnings of PGA tour players (Earnings)are related to driving distance (Yards Per Drive).In such a case,
A)you should define Yards Per Drive as the dependent variable.
B)you should define Earnings as the dependent variable.
C)it does not matter which variable you define as the dependent variable.
D)you should define Earnings as the independent variable.
A)you should define Yards Per Drive as the dependent variable.
B)you should define Earnings as the dependent variable.
C)it does not matter which variable you define as the dependent variable.
D)you should define Earnings as the independent variable.
Unlock Deck
Unlock for access to all 44 flashcards in this deck.
Unlock Deck
k this deck
25
The explained sum of squares is
A)the sum of the squared values of the predicted value of y minus the mean value of y.
B)the sum of the squared values of the predicted value of y minus the observed value of y.
C)the sum of the squared values of the observed value of y minus the mean value of y.
D)the sum of the squared values of the observed value of y minus the predicted value of y.
Unlock Deck
Unlock for access to all 44 flashcards in this deck.
Unlock Deck
k this deck
26
How do you calculate the estimated simple linear sample regression function by Ordinary Least Squares (OLS)? Explain.
Unlock Deck
Unlock for access to all 44 flashcards in this deck.
Unlock Deck
k this deck
27
Suppose you are given the Excel output in 4.1.You would conclude that explained sum of squares is
A)1.307E + 13.
B)2.658E + 14.
C)2.788E + 14.
D)1.308E + 14.
A)1.307E + 13.
B)2.658E + 14.
C)2.788E + 14.
D)1.308E + 14.
Unlock Deck
Unlock for access to all 44 flashcards in this deck.
Unlock Deck
k this deck
28
The standard error of the estimated sample regression function
Is
A)the square root of the unexplained sum of squares.
B)the square root of the explained sum of squares.
C)the square root of the unexplained sum of squares divided by the degree of freedom of the regression.
D)the square root of the explained sum of squares divided by the degree of freedom.
Is
A)the square root of the unexplained sum of squares.
B)the square root of the explained sum of squares.
C)the square root of the unexplained sum of squares divided by the degree of freedom of the regression.
D)the square root of the explained sum of squares divided by the degree of freedom.
Unlock Deck
Unlock for access to all 44 flashcards in this deck.
Unlock Deck
k this deck
29
The unexplained variation in y is
A)the distance between the observed and predicted values of y.
B)the distance between the mean and the best-fit line.
C)the distance between the mean and the data points.
D)the distance between the mean and the predicted value of y.
A)the distance between the observed and predicted values of y.
B)the distance between the mean and the best-fit line.
C)the distance between the mean and the data points.
D)the distance between the mean and the predicted value of y.
Unlock Deck
Unlock for access to all 44 flashcards in this deck.
Unlock Deck
k this deck
30
Suppose you are given the Excel output in 4.1.You would conclude that number of degrees of freedom of the regression is
A)1.
B)199.
C)200.
D)201.
A)1.
B)199.
C)200.
D)201.
Unlock Deck
Unlock for access to all 44 flashcards in this deck.
Unlock Deck
k this deck
31
The fact that two variables are correlated tells us that
A)a linear relationship exists between two variables.
B)a quadratic relationship exists between two variables.
C)a positive relationship exists between two variables.
D)changes in one variable cause changes in the other variable.
A)a linear relationship exists between two variables.
B)a quadratic relationship exists between two variables.
C)a positive relationship exists between two variables.
D)changes in one variable cause changes in the other variable.
Unlock Deck
Unlock for access to all 44 flashcards in this deck.
Unlock Deck
k this deck
32
What is the goal of linear regression analysis? Explain.
Unlock Deck
Unlock for access to all 44 flashcards in this deck.
Unlock Deck
k this deck
33
The fact that two variables are correlated implies that
A)a linear relationship exists between two variables.
B)a quadratic relationship exists between two variables.
C)a positive relationship exists between two variables.
D)changes in one variable cause changes in the other variable.
A)a linear relationship exists between two variables.
B)a quadratic relationship exists between two variables.
C)a positive relationship exists between two variables.
D)changes in one variable cause changes in the other variable.
Unlock Deck
Unlock for access to all 44 flashcards in this deck.
Unlock Deck
k this deck
34
Why does Ordinary Least Squares (OLS)produce the "best-fit" line? Explain.
Unlock Deck
Unlock for access to all 44 flashcards in this deck.
Unlock Deck
k this deck
35
Figure:
Suppose you are given the Excel output in 4.1.You would conclude that the estimated sample regression function explains
A)21.65 percent of the total variation in annual earnings.
B)4.69 percent of the total variation in annual earnings.
C)4.21 percent of the total variation in annual earnings.
D)0.02 percent of the total variation in annual earnings.
Unlock Deck
Unlock for access to all 44 flashcards in this deck.
Unlock Deck
k this deck
36
Suppose you are given the Excel output in 4.1.You would conclude that the number of golfers in the sample is
A)1.
B)199.
C)200.
D)201.
A)1.
B)199.
C)200.
D)201.
Unlock Deck
Unlock for access to all 44 flashcards in this deck.
Unlock Deck
k this deck
37
Figure:
Suppose you are given the Excel output in 4.1.You would conclude that the standard error of the estimated sample regression function
Is
A)0.2165.
B)0.0469.
C)1,155,621.367.
D)201.
Suppose you are given the Excel output in 4.1.You would conclude that the standard error of the estimated sample regression function
Is
A)0.2165.
B)0.0469.
C)1,155,621.367.
D)201.
Unlock Deck
Unlock for access to all 44 flashcards in this deck.
Unlock Deck
k this deck
38
The coefficient of determination (R2)is
A)the ratio of the unexplained variation in y to the total variation in y.
B)the ratio of the explained variation in y to the total variation in y.
C)the ratio of the explained variation in y to the unexplained variation in y.
D)the ratio of the unexplained variation in y to the explained variation in y.
Unlock Deck
Unlock for access to all 44 flashcards in this deck.
Unlock Deck
k this deck
39
In general,a larger R2 tends to suggest that
A)the estimated sample regression function explains a greater percentage of the total variation in y.
B)the estimated sample regression function is more accurate.
C)the estimated sample regression function explains a greater percentage of the explained variation in y.
D)the estimated slope coefficient is more likely to equal the population slope coefficient.
Unlock Deck
Unlock for access to all 44 flashcards in this deck.
Unlock Deck
k this deck
40
Why is an error term included in the estimated sample regression function? What factors does this term include? Explain.
Unlock Deck
Unlock for access to all 44 flashcards in this deck.
Unlock Deck
k this deck
41
What are the Explained Sum of Squares (ESS),the Unexplained Sum of Squares (USS),and the Total Sum of Squares (TSS)? Explain.
Unlock Deck
Unlock for access to all 44 flashcards in this deck.
Unlock Deck
k this deck
42
Suppose that you regress the total number of medals that a country won in the 2008 Olympics on GDP per capita and that you get the results in Figure 4.2.
How would you interpret these results? What would you say about the Goodness-of-Fit of the regression? Explain.
What would be the predicted number of medals for a country with a GDP per capita of $25,000? $40,000? Show your work.
How would you interpret these results? What would you say about the Goodness-of-Fit of the regression? Explain.
What would be the predicted number of medals for a country with a GDP per capita of $25,000? $40,000? Show your work.
Unlock Deck
Unlock for access to all 44 flashcards in this deck.
Unlock Deck
k this deck
43
Suppose you regress the number of days that individuals report having hunted in the past year on years of education and that you get the results in Figure 4.3.
How would you interpret these results? What would you say about the Goodness-of-Fit of the regression? Explain.
What would be the predicted number of hunting days for an individual with 12 years of education? 16 years of education? Show your work.
How would you interpret these results? What would you say about the Goodness-of-Fit of the regression? Explain.
What would be the predicted number of hunting days for an individual with 12 years of education? 16 years of education? Show your work.
Unlock Deck
Unlock for access to all 44 flashcards in this deck.
Unlock Deck
k this deck
44
A counselor working with teenagers is interested in the relationship between anxiety and depression.The counselor administers a depression and anxiety test to each teenager.The scores obtained from the administration of the two inventories are given below.
a.If anxiety is the independent variable and depression is the dependent variable,what is the sample regression function? What do the estimated slope and intercept mean in context of this problem?
b.What is R-squared and what does it mean?
c.If an individual had an anxiety score of 40,what is their predicted level of depression?
Unlock Deck
Unlock for access to all 44 flashcards in this deck.
Unlock Deck
k this deck
Unlock Deck
Unlock for access to all 44 flashcards in this deck.


