Deck 24: Business Statistics
Full screen (f)
Question
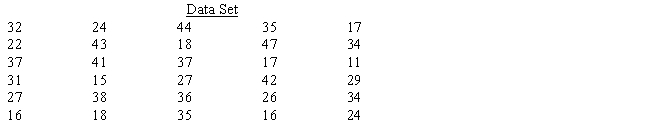
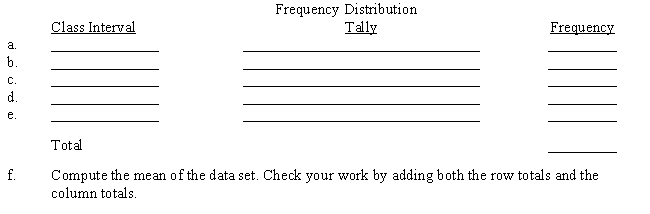
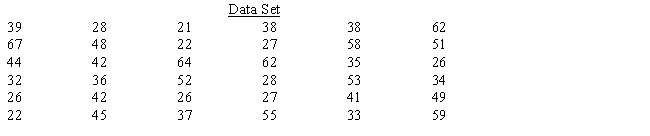
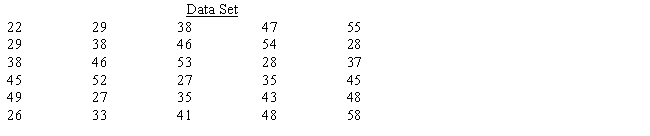
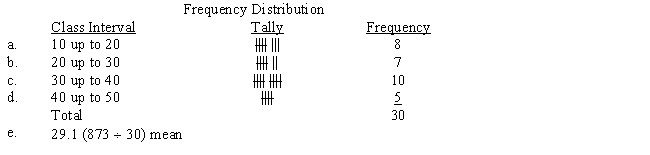
Construct a frequency distribution for the set of data below. Use four classes, beginning with "10 up to 20," then "20 up to 30," then "30 up to 40," and finally "40 up to 50."

Question
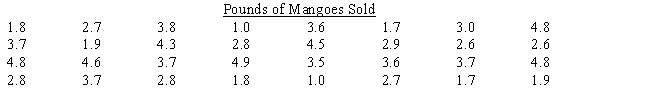
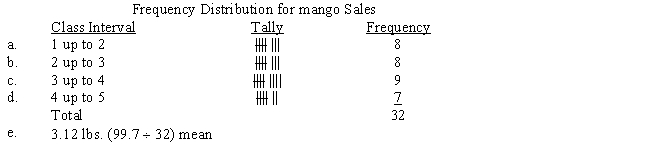
Gonzalvezfruta, a chain of fruits stores, is taking a survey to determine whether customers' demands are changing with respect to preferences for mango, apple, and orange. They record the data shown below from recent sales of mango. Construct a frequency distribution for mango sales. Use four classes, beginning with "1 up to 2," then "2 up to 3," and so on.

Question
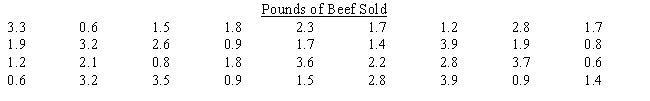
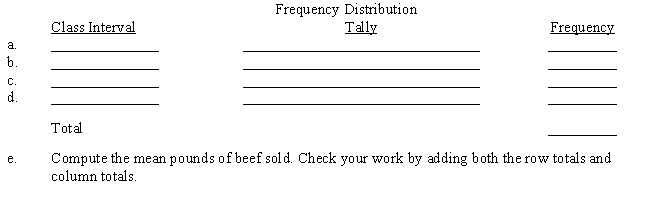
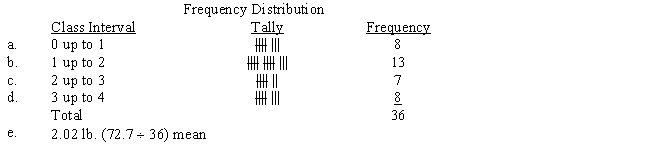
Angela's Meat & Poultry, a chain of specialty meat markets, is taking a survey to determine whether customers' demands are changing with respect to preferences for beef, pork, and chicken. They record the data shown below from recent sales of beef. Construct a frequency distribution for beef sales. Use four classes, beginning with "0 up to 1," then "1 up to 2," and so on.
Question
Telemarketers were hired by the city newspaper to telephone city residents and offer them an introductory subscription to the newspaper. The telemarketers were supposed to call between 7:00 p.m. and 8:00 p.m. in the evening, Monday through Thursday, for three weeks. Shown below are the numbers of subscribers contacted between 7:00 and 8:00 p.m. Compute the mean, median, and mode of those subscribers contacted. Round answers to the nearest 1/10.

a.Mean:
____________
b.Median:
____________
c.Mode:
____________
a.Mean:
____________
b.Median:
____________
c.Mode:
____________
Question
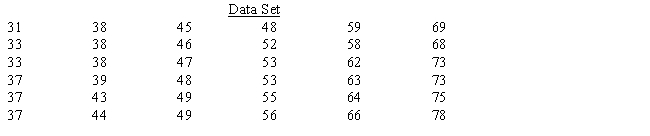
Construct a frequency distribution for the set of data below. Use five classes, beginning with "30 up to 40," then "40 up to 50," then "50 up to 60," then "60 up to 70," and finally "70 up to 80."
Question
Telemarketers were hired by the city newspaper to telephone city residents and offer them an introductory subscription to the newspaper. The telemarketers were supposed to call between 9:00 p.m. and 10:00 p.m. in the evening, Monday through Thursday, for three weeks. Shown below are the numbers of subscribers contacted between 9:00 and 10:00 p.m. Compute the mean, median, and mode of those subscribers contacted. Round answers to the nearest 1/10.

a.Mean:
____________
b.Median:
____________
c.Mode:
____________
a.Mean:
____________
b.Median:
____________
c.Mode:
____________
Question
Question
Use the frequency distribution shown below and Figure 24-1 to construct a histogram which displays the data.

Question
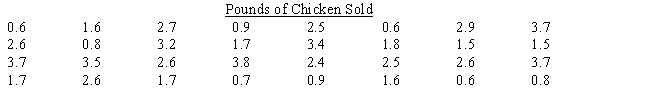
Angela's Meat & Poultry, a chain of specialty meat markets, is taking a survey to determine whether customers' demands are changing with respect to preferences for beef, pork, and chicken. They record the data shown below from recent sales of chicken. Construct a frequency distribution for chicken sales. Use four classes, beginning with "0 up to 1," then "1 up to 2," and so on.

Question
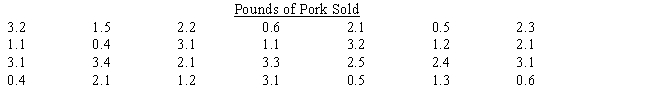
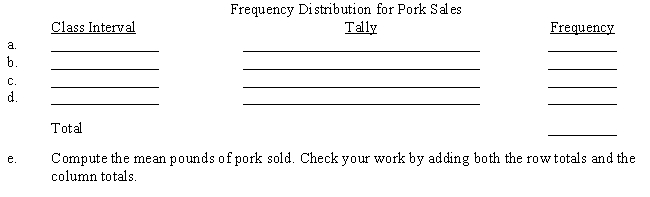
Angela's Meat & Poultry, a chain of specialty meat markets, is taking a survey to determine whether customers' demands are changing with respect to preferences for beef, pork, and chicken. They record the data shown below from recent sales of pork. Construct a frequency distribution for pork sales. Use four classes, beginning with "0 up to 1," then "1 up to 2," and so on.
Question
Telemarketers were hired by the city newspaper to telephone city residents and offer them an introductory subscription to the newspaper. The telemarketers were supposed to call between 6:00 p.m. and 7:00 p.m. in the evening, Monday through Thursday, for three weeks. Shown below are the numbers of subscribers contacted between 6:00 and 7:00 p.m. Compute the mean, median, and mode of those subscribers contacted. Round answers to the nearest 1/10. 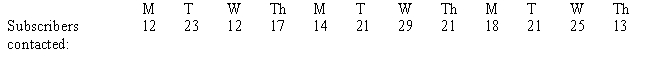
a.Mean:
____________
b.Median:
____________
c.Mode:
____________
a.Mean:
____________
b.Median:
____________
c.Mode:
____________
Question
Question
Construct a frequency distribution for the set of data below. Use five classes, beginning with "20 up to 30," then "30 up to 40," then "40 up to 50," then "50 up to 60," and finally "60 up to 70."

Question
Question
Telemarketers were hired by the city newspaper to telephone city residents and offer them an introductory subscription to the newspaper. The telemarketers were supposed to call between 8:00 p.m. and 9:00 p.m. in the evening, Monday through Thursday, for three weeks. Shown below are the numbers of subscribers contacted between 8:00 and 9:00 p.m. Compute the mean, median, and mode of those subscribers contacted. Round answers to the nearest 1/10.

a.Mean:
____________
b.Median:
____________
c.Mode:
____________
a.Mean:
____________
b.Median:
____________
c.Mode:
____________
Question
Construct a frequency distribution for the set of data below. Use four classes, beginning with "20 up to 30," then "30 up to 40," then "40 up to 50," and finally "50 up to 60."

Question
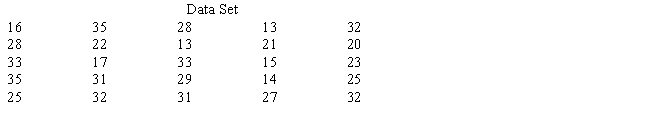
Construct a frequency distribution for the set of data below. Use four classes, beginning with "12 up to 18," then "18 up to 24," then "24 up to 30," and finally "30 up to 36."

Question
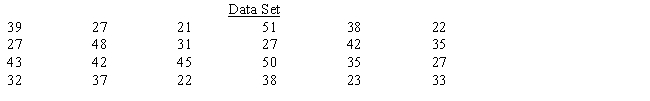
Construct a frequency distribution for the set of data below. Use four classes, beginning with "20 up to 28," then "28 up to 36," then "36 up to 44," and finally "44 up to 52."

Question
Question
Question
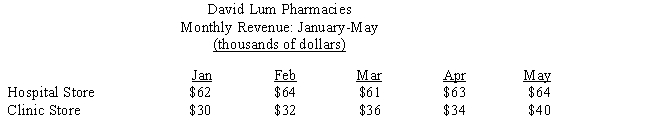
Last year, David Lum opened a new pharmacy. He already had one store located near the city hospital. When a new outpatient surgery clinic began operation, he opened his second pharmacy nearby. In June of this year, Lum wanted a business loan. The bank asked him to report the monthly revenues of each store for the first five months of the year. Lum displayed the data as follows.
a.Bar graph
a.Use Figure 24-7a to construct a bar graph to illustrate the monthly revenues of the clinic store. Label where necessary.b
Use Figure 24-7b to construct a line graph to illustrate the monthly revenues of the clinic store. Label where necessary.
b.Line graph
c.Comparative bar graph
c.Use Figure 24-7c to construct a comparative bar graph to illustrate the monthly revenues of both pharmacies. Label where necessary. Shade the bars for each store differently.
Question
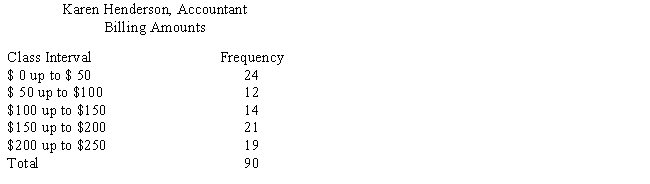
In June, Karen Henderson, an accountant, examined her records to learn the amount she had billed each of the first 90 clients who had contacted her at the beginning of the year for income tax advice. The results of the survey appear in the following table. Use Figure 24-4 to construct a histogram to illustrate this data. Label where necessary.
Question
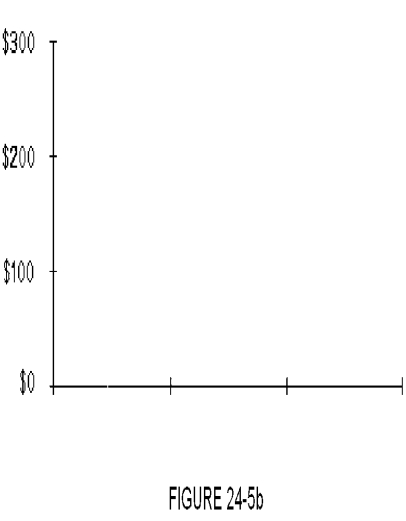
The table below displays the quarterly revenue of Wallace Printing for this year, arranged by quarter. The numbers are all in thousands of dollars. Use Figure 24-5a and Figure 24-5b to construct a bar graph and a line graph for the data. Label where necessary.
a.Bar graph
b.Line graph
a.Bar graph
b.Line graph
Question
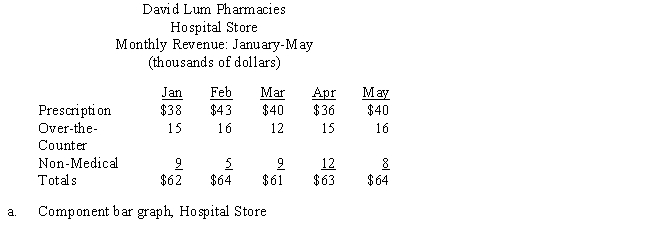
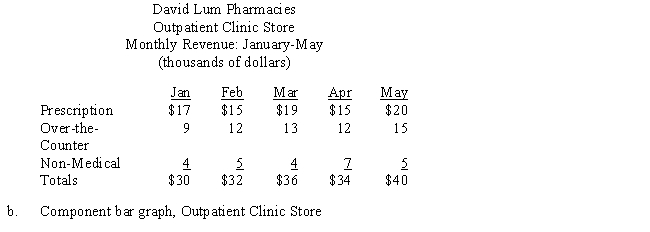
David Lum operates two pharmacies, one near the hospital and a second near the outpatient surgery clinic. Lum categorizes sales revenues as prescription medicine, over-the-counter medicine, or non-medical sales. The monthly revenues from each store for the first five months of the year are shown in the two tables below. Using Figures 24-8a and 24-8b, construct two component bar graphs for the respective stores. Label where necessary.
Question
The table below displays the quarterly revenues of Wallace Printing for this year and last year. The numbers are all in thousands of dollars. Use Figure 24-6 to construct a comparative bar graph for the data. Label where necessary. Shade the bars for each year differently. 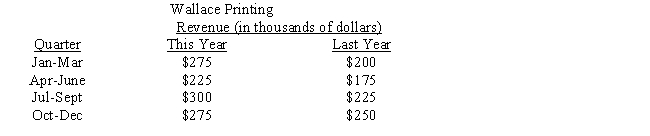
Question
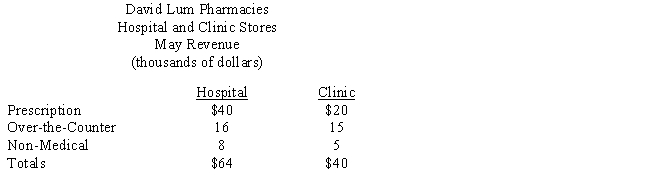
David Lum operates two pharmacies, one near the hospital and a second near the outpatient surgery clinic. Lum categorizes sales revenues as prescription medicine, over-the-counter medicine, or non-medical sales. The revenues from each store for the month of May are shown below. Using Figures 24-9a and 24-9b, construct one circle graph for each store to illustrate the data. Label where necessary.
a.Circle graph, Hospital Store

b.Circle graph, Clinic Store

a.Circle graph, Hospital Store
b.Circle graph, Clinic Store
Question
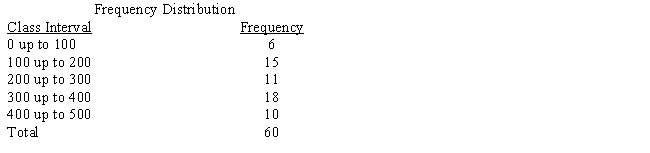
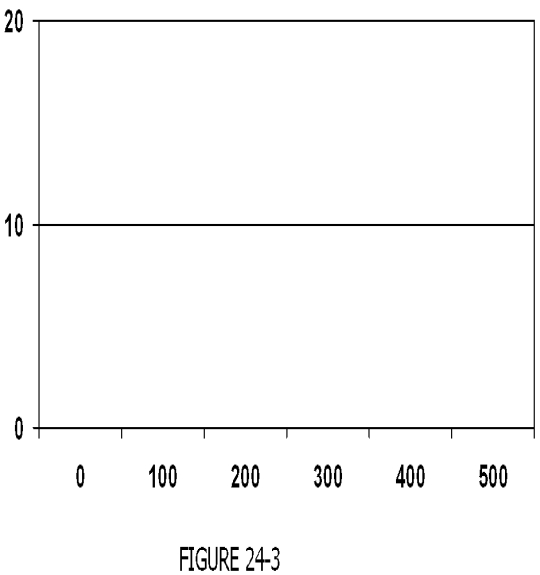
Use Figure 24-3 to construct a histogram for the frequency distribution in the table below. Label where necessary.
Question
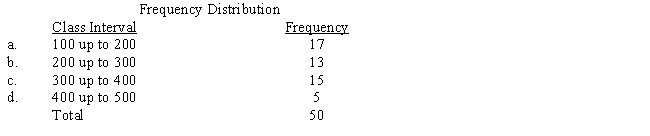
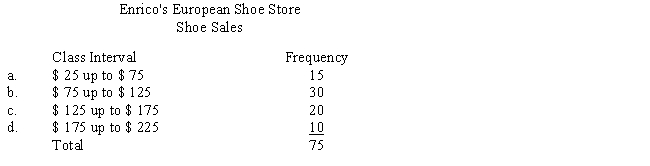
Enrico Vaselli owns Enrico's European Shoe Store, a chain of small stores that sell primarily Italian and French shoes. The operations manager of one store made a frequency distribution of the amounts of 75 randomly selected previous sales, as shown in the following table. Use Figure 24-2 to construct a histogram to display the data.

Unlock Deck
Sign up to unlock the cards in this deck!
Unlock Deck
Unlock Deck
1/28
Play
Full screen (f)
Deck 24: Business Statistics
1
Construct a frequency distribution for the set of data below. Use four classes, beginning with "10 up to 20," then "20 up to 30," then "30 up to 40," and finally "40 up to 50."
2
Gonzalvezfruta, a chain of fruits stores, is taking a survey to determine whether customers' demands are changing with respect to preferences for mango, apple, and orange. They record the data shown below from recent sales of mango. Construct a frequency distribution for mango sales. Use four classes, beginning with "1 up to 2," then "2 up to 3," and so on.
3
Angela's Meat & Poultry, a chain of specialty meat markets, is taking a survey to determine whether customers' demands are changing with respect to preferences for beef, pork, and chicken. They record the data shown below from recent sales of beef. Construct a frequency distribution for beef sales. Use four classes, beginning with "0 up to 1," then "1 up to 2," and so on.
4
Telemarketers were hired by the city newspaper to telephone city residents and offer them an introductory subscription to the newspaper. The telemarketers were supposed to call between 7:00 p.m. and 8:00 p.m. in the evening, Monday through Thursday, for three weeks. Shown below are the numbers of subscribers contacted between 7:00 and 8:00 p.m. Compute the mean, median, and mode of those subscribers contacted. Round answers to the nearest 1/10.
a.Mean:
____________
b.Median:
____________
c.Mode:
____________
a.Mean:
____________
b.Median:
____________
c.Mode:
____________
Unlock Deck
Unlock for access to all 28 flashcards in this deck.
Unlock Deck
k this deck
5
Construct a frequency distribution for the set of data below. Use five classes, beginning with "30 up to 40," then "40 up to 50," then "50 up to 60," then "60 up to 70," and finally "70 up to 80."
Unlock Deck
Unlock for access to all 28 flashcards in this deck.
Unlock Deck
k this deck
6
Telemarketers were hired by the city newspaper to telephone city residents and offer them an introductory subscription to the newspaper. The telemarketers were supposed to call between 9:00 p.m. and 10:00 p.m. in the evening, Monday through Thursday, for three weeks. Shown below are the numbers of subscribers contacted between 9:00 and 10:00 p.m. Compute the mean, median, and mode of those subscribers contacted. Round answers to the nearest 1/10.
a.Mean:
____________
b.Median:
____________
c.Mode:
____________
a.Mean:
____________
b.Median:
____________
c.Mode:
____________
Unlock Deck
Unlock for access to all 28 flashcards in this deck.
Unlock Deck
k this deck
7
Compute the mean, median, and mode of the numbers in the data set below. Round answers to the nearest 1/10.
21 34 19 32 48 49 28 25 34 30
a.Mean:
____________
b.Median:
____________
c.Mode:
____________
21 34 19 32 48 49 28 25 34 30
a.Mean:
____________
b.Median:
____________
c.Mode:
____________
Unlock Deck
Unlock for access to all 28 flashcards in this deck.
Unlock Deck
k this deck
8
Use the frequency distribution shown below and Figure 24-1 to construct a histogram which displays the data.
Unlock Deck
Unlock for access to all 28 flashcards in this deck.
Unlock Deck
k this deck
9
Angela's Meat & Poultry, a chain of specialty meat markets, is taking a survey to determine whether customers' demands are changing with respect to preferences for beef, pork, and chicken. They record the data shown below from recent sales of chicken. Construct a frequency distribution for chicken sales. Use four classes, beginning with "0 up to 1," then "1 up to 2," and so on.
Unlock Deck
Unlock for access to all 28 flashcards in this deck.
Unlock Deck
k this deck
10
Angela's Meat & Poultry, a chain of specialty meat markets, is taking a survey to determine whether customers' demands are changing with respect to preferences for beef, pork, and chicken. They record the data shown below from recent sales of pork. Construct a frequency distribution for pork sales. Use four classes, beginning with "0 up to 1," then "1 up to 2," and so on.
Unlock Deck
Unlock for access to all 28 flashcards in this deck.
Unlock Deck
k this deck
11
Telemarketers were hired by the city newspaper to telephone city residents and offer them an introductory subscription to the newspaper. The telemarketers were supposed to call between 6:00 p.m. and 7:00 p.m. in the evening, Monday through Thursday, for three weeks. Shown below are the numbers of subscribers contacted between 6:00 and 7:00 p.m. Compute the mean, median, and mode of those subscribers contacted. Round answers to the nearest 1/10.
a.Mean:
____________
b.Median:
____________
c.Mode:
____________
a.Mean:
____________
b.Median:
____________
c.Mode:
____________
Unlock Deck
Unlock for access to all 28 flashcards in this deck.
Unlock Deck
k this deck
12
Compute the mean, median, and mode of the numbers in the data set below. Round answers to the nearest 1/10.29 38 15 31 48 32 29 58 17
2. Compute the mean, median, and mode of the numbers in the data set below. Round answers to the nearest 1/10.30 32 27 45 32 21 19 28 46 32 29
a.Mean:
____________
b.Median:
____________
c.Mode:
____________
2. Compute the mean, median, and mode of the numbers in the data set below. Round answers to the nearest 1/10.30 32 27 45 32 21 19 28 46 32 29
a.Mean:
____________
b.Median:
____________
c.Mode:
____________
Unlock Deck
Unlock for access to all 28 flashcards in this deck.
Unlock Deck
k this deck
13
Construct a frequency distribution for the set of data below. Use five classes, beginning with "20 up to 30," then "30 up to 40," then "40 up to 50," then "50 up to 60," and finally "60 up to 70."
Unlock Deck
Unlock for access to all 28 flashcards in this deck.
Unlock Deck
k this deck
14
Compute the mean, median, and mode of the numbers in the data set below. Round answers to the nearest 1/10.
45 32 47 25 16 47 29 25 16 25 45 44
a.Mean:
____________
b.Median:
____________
c.Mode:
____________
45 32 47 25 16 47 29 25 16 25 45 44
a.Mean:
____________
b.Median:
____________
c.Mode:
____________
Unlock Deck
Unlock for access to all 28 flashcards in this deck.
Unlock Deck
k this deck
15
Telemarketers were hired by the city newspaper to telephone city residents and offer them an introductory subscription to the newspaper. The telemarketers were supposed to call between 8:00 p.m. and 9:00 p.m. in the evening, Monday through Thursday, for three weeks. Shown below are the numbers of subscribers contacted between 8:00 and 9:00 p.m. Compute the mean, median, and mode of those subscribers contacted. Round answers to the nearest 1/10.
a.Mean:
____________
b.Median:
____________
c.Mode:
____________
a.Mean:
____________
b.Median:
____________
c.Mode:
____________
Unlock Deck
Unlock for access to all 28 flashcards in this deck.
Unlock Deck
k this deck
16
Construct a frequency distribution for the set of data below. Use four classes, beginning with "20 up to 30," then "30 up to 40," then "40 up to 50," and finally "50 up to 60."
Unlock Deck
Unlock for access to all 28 flashcards in this deck.
Unlock Deck
k this deck
17
Construct a frequency distribution for the set of data below. Use four classes, beginning with "12 up to 18," then "18 up to 24," then "24 up to 30," and finally "30 up to 36."
Unlock Deck
Unlock for access to all 28 flashcards in this deck.
Unlock Deck
k this deck
18
Construct a frequency distribution for the set of data below. Use four classes, beginning with "20 up to 28," then "28 up to 36," then "36 up to 44," and finally "44 up to 52."
Unlock Deck
Unlock for access to all 28 flashcards in this deck.
Unlock Deck
k this deck
19
Compute the mean, median, and mode of the numbers in the data set below. Round answers to the nearest 1/10.32 29 40 45 59 36 45 42 58 39
a.Mean:
____________
b.Median:
____________
c.Mode:
____________
a.Mean:
____________
b.Median:
____________
c.Mode:
____________
Unlock Deck
Unlock for access to all 28 flashcards in this deck.
Unlock Deck
k this deck
20
Mean:
____________
b.Median:
____________
c.Mode:
____________
____________
b.Median:
____________
c.Mode:
____________
Unlock Deck
Unlock for access to all 28 flashcards in this deck.
Unlock Deck
k this deck
21
Last year, David Lum opened a new pharmacy. He already had one store located near the city hospital. When a new outpatient surgery clinic began operation, he opened his second pharmacy nearby. In June of this year, Lum wanted a business loan. The bank asked him to report the monthly revenues of each store for the first five months of the year. Lum displayed the data as follows.
a.Bar graph
a.Use Figure 24-7a to construct a bar graph to illustrate the monthly revenues of the clinic store. Label where necessary.b
Use Figure 24-7b to construct a line graph to illustrate the monthly revenues of the clinic store. Label where necessary.
b.Line graph
c.Comparative bar graph
c.Use Figure 24-7c to construct a comparative bar graph to illustrate the monthly revenues of both pharmacies. Label where necessary. Shade the bars for each store differently.
a.Bar graph
a.Use Figure 24-7a to construct a bar graph to illustrate the monthly revenues of the clinic store. Label where necessary.b
Use Figure 24-7b to construct a line graph to illustrate the monthly revenues of the clinic store. Label where necessary.
b.Line graph
c.Comparative bar graph
c.Use Figure 24-7c to construct a comparative bar graph to illustrate the monthly revenues of both pharmacies. Label where necessary. Shade the bars for each store differently.
Unlock Deck
Unlock for access to all 28 flashcards in this deck.
Unlock Deck
k this deck
22
In June, Karen Henderson, an accountant, examined her records to learn the amount she had billed each of the first 90 clients who had contacted her at the beginning of the year for income tax advice. The results of the survey appear in the following table. Use Figure 24-4 to construct a histogram to illustrate this data. Label where necessary.
Unlock Deck
Unlock for access to all 28 flashcards in this deck.
Unlock Deck
k this deck
23
The table below displays the quarterly revenue of Wallace Printing for this year, arranged by quarter. The numbers are all in thousands of dollars. Use Figure 24-5a and Figure 24-5b to construct a bar graph and a line graph for the data. Label where necessary.
a.Bar graph
b.Line graph
a.Bar graph
b.Line graph
Unlock Deck
Unlock for access to all 28 flashcards in this deck.
Unlock Deck
k this deck
24
David Lum operates two pharmacies, one near the hospital and a second near the outpatient surgery clinic. Lum categorizes sales revenues as prescription medicine, over-the-counter medicine, or non-medical sales. The monthly revenues from each store for the first five months of the year are shown in the two tables below. Using Figures 24-8a and 24-8b, construct two component bar graphs for the respective stores. Label where necessary.
Unlock Deck
Unlock for access to all 28 flashcards in this deck.
Unlock Deck
k this deck
25
The table below displays the quarterly revenues of Wallace Printing for this year and last year. The numbers are all in thousands of dollars. Use Figure 24-6 to construct a comparative bar graph for the data. Label where necessary. Shade the bars for each year differently.
Unlock Deck
Unlock for access to all 28 flashcards in this deck.
Unlock Deck
k this deck
26
David Lum operates two pharmacies, one near the hospital and a second near the outpatient surgery clinic. Lum categorizes sales revenues as prescription medicine, over-the-counter medicine, or non-medical sales. The revenues from each store for the month of May are shown below. Using Figures 24-9a and 24-9b, construct one circle graph for each store to illustrate the data. Label where necessary.
a.Circle graph, Hospital Store
b.Circle graph, Clinic Store
a.Circle graph, Hospital Store
b.Circle graph, Clinic Store
Unlock Deck
Unlock for access to all 28 flashcards in this deck.
Unlock Deck
k this deck
27
Use Figure 24-3 to construct a histogram for the frequency distribution in the table below. Label where necessary.
Unlock Deck
Unlock for access to all 28 flashcards in this deck.
Unlock Deck
k this deck
28
Enrico Vaselli owns Enrico's European Shoe Store, a chain of small stores that sell primarily Italian and French shoes. The operations manager of one store made a frequency distribution of the amounts of 75 randomly selected previous sales, as shown in the following table. Use Figure 24-2 to construct a histogram to display the data.
Unlock Deck
Unlock for access to all 28 flashcards in this deck.
Unlock Deck
k this deck
Unlock Deck
Unlock for access to all 28 flashcards in this deck.


