Deck 13: Nonparametric Methods
Full screen (f)
Question
Question
Question
Question
Question
Question
Question
Question
Question
Question
Question
Question
Question
Question
Question
Question
Question
Question
Question
Question
Question
Question
Question
Question
Question
Question
Question
Question
Question
Question
Question
Question
Question
Question
Question
Question
Question
Question
Question
Question
Question
Question
Question
Question
Question
Question
Question
Question
Question
Question
Question
Question
Question
Question
Question
Question
Question
Question
Question
Question
Question
Question
Question
Question
Question
A copy machine service company provides maintenance and repair service for different types and brands of copiers.The manager of the repair department wants to know if the repair time for brand A is higher than the repair time for brand B.The manager randomly selected 8 repair records associated with brand A and 8 repair records associated with brand B.The repair times for both samples in minutes are given below.The distribution of repair times for both brand A and brand B is highly skewed. 
What is the appropriate null and alternative hypothesis for this problem?
What is the appropriate null and alternative hypothesis for this problem?
Question
Question
Question
Question
Question
Are repair times for brand A systematically higher than the repair times for brand B? Test at a = .05.
B.H0: DA and DB are identical,HA: DA is shifted to the right of DB
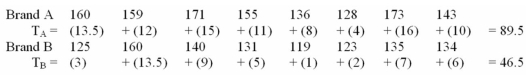 T = 89.5
From table A15 for n1 = 8,and n2 = 8,TU = 84
Since 89.5 > 84,we reject H0 and conclude that the repair times for brand A is higher than the repair times for brand
B.H0: DA and DB are identical,HA: DA is shifted to the right of DB
T = 89.5From table A15 for n1 = 8,and n2 = 8,TU = 84
Since 89.5 > 84,we reject H0 and conclude that the repair times for brand A is higher than the repair times for brand
Question
Question
Question
Question
Question
Question
Question
Question
Question
Question

Unlock Deck
Sign up to unlock the cards in this deck!
Unlock Deck
Unlock Deck
1/112
Play
Full screen (f)
Deck 13: Nonparametric Methods
1
A parametric test is always more powerful than its nonparametric counterpart.
False
2
Which of the following statements about nonparametric methods is correct?
A)Nonparametric methods are only used in cases where parametric tests such as t or F do not exist.
B)Nonparametric tests should always be used when one is available because they are easier to apply then their parametric counterparts.
C)Nonparametric tests are useful alternatives to parametric tests such as t or F when certain assumptions required by parametric tests are violated.
D)Nonparametric tests are only used if the data comes from independent samples.
E)Nonparametric tests cannot be used if the same value appears in more than one data set being analyzed.
C
3
Which one of the following nonparametric methods requires that we carry out a paired difference experiment?
A)Wilcoxon signed rank test
B)Sign test
C)Kruskall-Wallis test
D)Wilcoxon rank sum test
E)Spearman's rank order correlation
A)Wilcoxon signed rank test
B)Sign test
C)Kruskall-Wallis test
D)Wilcoxon rank sum test
E)Spearman's rank order correlation
A
4
The Wilcoxon signed rank test is also called the Mann-Whitney test.
Unlock Deck
Unlock for access to all 112 flashcards in this deck.
Unlock Deck
k this deck
5
The sign test is a nonparametric test for a population mean that is valid for any sample size and population shape.
Unlock Deck
Unlock for access to all 112 flashcards in this deck.
Unlock Deck
k this deck
6
Parametric tests such as F and t tests are more powerful than their nonparametric counterparts,if the assumptions needed to perform the parametric test are not violated.
Unlock Deck
Unlock for access to all 112 flashcards in this deck.
Unlock Deck
k this deck
7
If the data set consists of matched pairs collected from two dependent populations then the Wilcoxon signed rank test may be appropriate to use.
Unlock Deck
Unlock for access to all 112 flashcards in this deck.
Unlock Deck
k this deck
8
Nonparametric tests can be more powerful than the corresponding t or F tests if the population distribution is highly skewed or not normal.
Unlock Deck
Unlock for access to all 112 flashcards in this deck.
Unlock Deck
k this deck
9
The Wilcoxon rank sum test is a nonparametric test used to compare the central tendencies of two populations when a paired difference experiment has been conducted.
Unlock Deck
Unlock for access to all 112 flashcards in this deck.
Unlock Deck
k this deck
10
The Kruskal-Wallis test requires that all p samples being compared must have equal sample sizes.
Unlock Deck
Unlock for access to all 112 flashcards in this deck.
Unlock Deck
k this deck
11
An assumption of the Wilcoxon signed ranks test is that the samples are independent.
Unlock Deck
Unlock for access to all 112 flashcards in this deck.
Unlock Deck
k this deck
12
The Spearman's rank correlation test can be used to study the relationship between two ordinal variables.
Unlock Deck
Unlock for access to all 112 flashcards in this deck.
Unlock Deck
k this deck
13
The Wilcoxon rank sum test requires that the two independent samples being compared must have equal sample sizes.
Unlock Deck
Unlock for access to all 112 flashcards in this deck.
Unlock Deck
k this deck
14
The Wilcoxon signed rank test is a nonparametric test.
Unlock Deck
Unlock for access to all 112 flashcards in this deck.
Unlock Deck
k this deck
15
Which one of the following nonparametric methods can be used to compare more than two independent populations in a single test?
A)Wilcoxon signed rank test
B)Sign test
C)Kruskall-Wallis test
D)Wilcoxon rank sum test
E)Spearman's test
A)Wilcoxon signed rank test
B)Sign test
C)Kruskall-Wallis test
D)Wilcoxon rank sum test
E)Spearman's test
Unlock Deck
Unlock for access to all 112 flashcards in this deck.
Unlock Deck
k this deck
16
The sign test is a test about a population median that is valid for any sample size and population shape.
Unlock Deck
Unlock for access to all 112 flashcards in this deck.
Unlock Deck
k this deck
17
The Wilcoxon rank sum test and the Kruskall-Wallis test both require that we take independent random samples.
Unlock Deck
Unlock for access to all 112 flashcards in this deck.
Unlock Deck
k this deck
18
In testing the significance of a population correlation coefficient using the Spearman's rank correlation coefficient,it is assumed that all possible combinations of values of variable X and variable Y have a bivariate normal probability distribution.
Unlock Deck
Unlock for access to all 112 flashcards in this deck.
Unlock Deck
k this deck
19
A sign test is a test of hypothesis about the population mean.
Unlock Deck
Unlock for access to all 112 flashcards in this deck.
Unlock Deck
k this deck
20
Which one of the following nonparametric methods can be used with a single population?
A)Spearman's test
B)Sign test
C)Kruskall-Wallis test
D)Wilcoxon rank sum test
E)Friedman test
A)Spearman's test
B)Sign test
C)Kruskall-Wallis test
D)Wilcoxon rank sum test
E)Friedman test
Unlock Deck
Unlock for access to all 112 flashcards in this deck.
Unlock Deck
k this deck
21
The Kruskall-Wallis test is the nonparametric counterpart of the:
A)Large sample test about a single population mean
B)Two group independent samples t test
C)One way ANOVA F test
D)Paired difference t test
E)F test for equality of population variances
A)Large sample test about a single population mean
B)Two group independent samples t test
C)One way ANOVA F test
D)Paired difference t test
E)F test for equality of population variances
Unlock Deck
Unlock for access to all 112 flashcards in this deck.
Unlock Deck
k this deck
22
An e-business/e-commerce information technology consulting company wants to compare the effectiveness of three programming languages that its programmers use.Currently each programming language is used by approximately 1/3 of the programmers employed by the company.The director of the programming division randomly selected 5 programmers from the users of each of the three programming languages and assigned the same simple programming task to each programmer.It is known that all three populations have highly skewed distributions with extreme outliers.Which one of the following nonparametric tests is appropriate for this problem?
A)Wilcoxon signed rank test
B)Wilcoxon rank sum test
C)Sign test
D)Kruskall-Wallis test
E)Spearman's rank correlation test
A)Wilcoxon signed rank test
B)Wilcoxon rank sum test
C)Sign test
D)Kruskall-Wallis test
E)Spearman's rank correlation test
Unlock Deck
Unlock for access to all 112 flashcards in this deck.
Unlock Deck
k this deck
23
In a manufacturing facility producing fasteners,a supervisor suspects that the diameter of the bolt produced by the second shift workers is greater than the diameter of the bolts produced by the first shift workers.The supervisor takes a sample of 5 bolts from the first shift and a sample of 4 bolts from the second shift and measures the diameters.The distribution of bolt diameter measurements is not normally distributed.Which one of the following nonparametric tests is appropriate for this problem?
A)Wilcoxon signed rank test
B)Wilcoxon rank sum test
C)Sign test
D)Kruskall-Wallis test
E)Spearman's rank correlation test
A)Wilcoxon signed rank test
B)Wilcoxon rank sum test
C)Sign test
D)Kruskall-Wallis test
E)Spearman's rank correlation test
Unlock Deck
Unlock for access to all 112 flashcards in this deck.
Unlock Deck
k this deck
24
The Wilcoxon rank sum test is the nonparametric counterpart of the:
A)Large sample test about a single population mean
B)Two independent samples t test
C)F test
D)Paired difference t test
E)F test for equality of population variances
A)Large sample test about a single population mean
B)Two independent samples t test
C)F test
D)Paired difference t test
E)F test for equality of population variances
Unlock Deck
Unlock for access to all 112 flashcards in this deck.
Unlock Deck
k this deck
25
The Wilcoxon signed rank test is the nonparametric counterpart of the:
A)Large sample test about a single population mean
B)Two independent samples t test
C)One way ANOVA F test
D)Paired difference t test
E)F test for equality of population variances
A)Large sample test about a single population mean
B)Two independent samples t test
C)One way ANOVA F test
D)Paired difference t test
E)F test for equality of population variances
Unlock Deck
Unlock for access to all 112 flashcards in this deck.
Unlock Deck
k this deck
26
Refer to the Mega-Stat/Excel output for the Wilcoxon rank sum test given in the table below.
105.00 expected value
13.07 standard deviation
, corrected for ties
-value (two-
tailed)
-At a significance level of .05,which one of the following rejection point conditions is correct when testing H0: D1 and D2 have identical probability distributions versus Ha: D1 is shifted to the right or left of D2?
A)Reject H0 if T ? 80 or T ? 46
B)Reject H0 if T ? 127 or T ? 83
C)Reject H0 if T ? 131 or T ? 79
D)Reject H0 if T ? 111 or T ? 69
E)Reject H0 if T ? 105 or T ? 66
Unlock Deck
Unlock for access to all 112 flashcards in this deck.
Unlock Deck
k this deck
27
Which one of the following nonparametric methods can be used to determine the strength of the relationship between two variables?
A)Wilcoxon signed rank test
B)Sign test
C)Kruskall-Wallis test
D)Wilcoxon rank sum test
E)Spearman's rank correlation test
A)Wilcoxon signed rank test
B)Sign test
C)Kruskall-Wallis test
D)Wilcoxon rank sum test
E)Spearman's rank correlation test
Unlock Deck
Unlock for access to all 112 flashcards in this deck.
Unlock Deck
k this deck
28
Refer to the Mega-Stat/Excel output for the Wilcoxon rank sum test given in the table below.
105.00 expected value
13.07 standard deviation
, corrected for ties
-value (two-
tailed)
-At a significance level of .05,which one of the following statements is correct when testing H0: D1 and D2 have identical probability distributions versus Ha: D1 is shifted to the right or left of D2?
A)We reject H0 and conclude there is very strong evidence that D1 is shifted to the right or left of D2.
B)We reject H0 and conclude there is very strong evidence that D1 is shifted to the left of D2.
C)We failed to reject H0 and conclude there is not sufficient evidence that D1 is shifted to the left of D2.
D)We failed to reject H0 and conclude there is not sufficient evidence to conclude that D1 and D2 significantly differ in location.
E)We failed to reject H0 and conclude there is very strong evidence that D1 is shifted to the right D2.
Unlock Deck
Unlock for access to all 112 flashcards in this deck.
Unlock Deck
k this deck
29
Which one of the following nonparametric methods can be considered as an extension of the Wilcoxon rank sum test to three or more populations?
A)Wilcoxon signed rank test
B)Sign test
C)Kruskall-Wallis test
D)Spearman's test
E)Adcock Addition test
A)Wilcoxon signed rank test
B)Sign test
C)Kruskall-Wallis test
D)Spearman's test
E)Adcock Addition test
Unlock Deck
Unlock for access to all 112 flashcards in this deck.
Unlock Deck
k this deck
30
Parametric methods are ____________ more powerful than their nonparametric counterparts.
A)always
B)sometimes
C)never
A)always
B)sometimes
C)never
Unlock Deck
Unlock for access to all 112 flashcards in this deck.
Unlock Deck
k this deck
31
The sign test is the nonparametric counterpart of the:
A)Small sample t test about a single population mean
B)Two independent samples t test
C)One way ANOVA F test
D)Paired difference t test
E)F test for equality of population variances
A)Small sample t test about a single population mean
B)Two independent samples t test
C)One way ANOVA F test
D)Paired difference t test
E)F test for equality of population variances
Unlock Deck
Unlock for access to all 112 flashcards in this deck.
Unlock Deck
k this deck
32
A cholesterol test was given to 10 heart patients with high cholesterol levels.The same 10 heart patients are then given a new cholesterol-reducing drug for six months.Before the patients begin taking the drug,they are told to maintain their current diets and eating habits so that the effect of the drug can be more effectively determined.After taking the drug for six months,the same patients are given a cholesterol test again.The pharmaceutical company manufacturing the medicine wants to know if the drug is effective in reducing the cholesterol levels of the patients.The cholesterol levels before and after taking the drug is recorded for each patient.The distribution of cholesterol levels is not normally distributed.Which one of the following nonparametric tests is appropriate for this problem?
A)Wilcoxon signed rank test
B)Wilcoxon rank sum test
C)Sign test
D)Kruskall-Wallis test
E)Spearman's rank correlation test
A)Wilcoxon signed rank test
B)Wilcoxon rank sum test
C)Sign test
D)Kruskall-Wallis test
E)Spearman's rank correlation test
Unlock Deck
Unlock for access to all 112 flashcards in this deck.
Unlock Deck
k this deck
33
Two professional football scouts are in the process of recruiting 7 new football players (receivers).After a careful review and evaluation,both scouts ranked the seven receivers in terms of their professional career prospects.If we want to determine whether the two scouts have similar opinions about the professional football career prospects of the seven players,which one of the following nonparametric tests would be chosen?
A)Wilcoxon signed rank test
B)Wilcoxon rank sum test
C)Sign test
D)Kruskall-Wallis test
E)Spearman's rank correlation test
A)Wilcoxon signed rank test
B)Wilcoxon rank sum test
C)Sign test
D)Kruskall-Wallis test
E)Spearman's rank correlation test
Unlock Deck
Unlock for access to all 112 flashcards in this deck.
Unlock Deck
k this deck
34
Assume that the following data set is not normally distributed.
(21, 18, 4, 9, 14, 16, 17, 12, 15, 8, 7, 5)
-If Ha: Md ¹ 7,then the p-value is:
A).0161
B).0029
C).0384
D).0322
E).0192
(21, 18, 4, 9, 14, 16, 17, 12, 15, 8, 7, 5)
-If Ha: Md ¹ 7,then the p-value is:
A).0161
B).0029
C).0384
D).0322
E).0192
Unlock Deck
Unlock for access to all 112 flashcards in this deck.
Unlock Deck
k this deck
35
Assume that the following data set is not normally distributed.
(21, 18, 4, 9, 14, 16, 17, 12, 15, 8, 7, 5)
-If Ha: Md > 6,then the p-value is:
A).0161
B).0029
C).0537
D).0322
E).0192
(21, 18, 4, 9, 14, 16, 17, 12, 15, 8, 7, 5)
-If Ha: Md > 6,then the p-value is:
A).0161
B).0029
C).0537
D).0322
E).0192
Unlock Deck
Unlock for access to all 112 flashcards in this deck.
Unlock Deck
k this deck
36
Assume that the following data set is not normally distributed.
(21, 18, 4, 9, 14, 16, 17, 12, 15, 8, 7, 5)
-If Ha: Md < 16,then the p-value is:
A).0161
B).0729
C).0192
D).0384
E).1458
(21, 18, 4, 9, 14, 16, 17, 12, 15, 8, 7, 5)
-If Ha: Md < 16,then the p-value is:
A).0161
B).0729
C).0192
D).0384
E).1458
Unlock Deck
Unlock for access to all 112 flashcards in this deck.
Unlock Deck
k this deck
37
Assume that the following data set is not normally distributed.
(21, 18, 4, 9, 14, 16, 17, 12, 15, 8, 7, 5)
-If Ha: Md < 6,then the value of S is:
A)0
B)1
C)2
D)3
E)4
(21, 18, 4, 9, 14, 16, 17, 12, 15, 8, 7, 5)
-If Ha: Md < 6,then the value of S is:
A)0
B)1
C)2
D)3
E)4
Unlock Deck
Unlock for access to all 112 flashcards in this deck.
Unlock Deck
k this deck
38
The fire marshal has stipulated that the room capacity for a particular room is to be no more than 100 on the average.A random sample of the room's occupancy rate for 9 days had the following number of people: 144,85,90,120,150,105,93,130 and 115.Assume the population of room occupancy counts is not normal.The fire marshal wants to determine if there is significant evidence to conclude that the room has had more than 100 people on average.Which one of the following tests is appropriate for this problem?
A)Wilcoxon signed rank test
B)Wilcoxon rank sum test
C)Sign test
D)Kruskall-Wallis test
E)Spearman's rank correlation test
A)Wilcoxon signed rank test
B)Wilcoxon rank sum test
C)Sign test
D)Kruskall-Wallis test
E)Spearman's rank correlation test
Unlock Deck
Unlock for access to all 112 flashcards in this deck.
Unlock Deck
k this deck
39
The __________________ is a general test to detect whether the probability distribution of one population has shifted to the right or to the left of the probability distribution of another population.
A)sign test
B)Wilcoxon rank sum test
C)Wilcoxon signed rank test
D)Kruskall-Wallis test
E)Schermer Summation test
A)sign test
B)Wilcoxon rank sum test
C)Wilcoxon signed rank test
D)Kruskall-Wallis test
E)Schermer Summation test
Unlock Deck
Unlock for access to all 112 flashcards in this deck.
Unlock Deck
k this deck
40
Five years ago,the average starting salary of a new university graduate with a major in marketing was $34,000.A random sample of 10 graduates from this year's graduating class of a local university yielded the following starting salaries in thousands of dollars: 38,36,25,37,35,24,38,45,39,36.The local university wants to determine if the starting salaries have increased in the last five years.Assume that the population of starting salaries in marketing is not normally distributed.Which one of the following tests is appropriate for this problem?
A)Wilcoxon signed rank test
B)Wilcoxon rank sum test
C)Sign test
D)Kruskall-Wallis test
E)Mann-Whitney test
A)Wilcoxon signed rank test
B)Wilcoxon rank sum test
C)Sign test
D)Kruskall-Wallis test
E)Mann-Whitney test
Unlock Deck
Unlock for access to all 112 flashcards in this deck.
Unlock Deck
k this deck
41
What type of non-parametric statistic would generate the following excel/MegaStat output? 0 sum of positive ranks
21 sum of negative ranks
A)Subtraction sigma test
B)Wilcoxon signed rank test
C)Sign test
D)Kruskall-Wallis test
E)Spearman's rank correlation test
21 sum of negative ranks
A)Subtraction sigma test
B)Wilcoxon signed rank test
C)Sign test
D)Kruskall-Wallis test
E)Spearman's rank correlation test
Unlock Deck
Unlock for access to all 112 flashcards in this deck.
Unlock Deck
k this deck
42
In a manufacturing facility producing fasteners,a supervisor suspects that the diameter of the bolt produced by the first shift workers is greater than the diameter of the bolts produced by the second shift workers.The supervisor takes a sample of 5 bolts from the first shift and a sample of 4 bolts from the second shift and measures the diameters.Below are the results from 5 first shift and 4 second shift observations.Distribution of bolt diameter measurements is not normally distributed.Given the data below,what is the value of T2?
A)16
B)29
C)8.05
D)10.32
E)22
A)16
B)29
C)8.05
D)10.32
E)22
Unlock Deck
Unlock for access to all 112 flashcards in this deck.
Unlock Deck
k this deck
43
Consider the following pairs of observed values (x,y): (10,2), (8,3), (7,5), (5,4), (3,6), (2,9).Compute Spearman's rank correlation coefficient for this data set.
A)0.037
B)-0.744
C)-0.863
D)0.842
E)-0.943
A)0.037
B)-0.744
C)-0.863
D)0.842
E)-0.943
Unlock Deck
Unlock for access to all 112 flashcards in this deck.
Unlock Deck
k this deck
44
The __________________ test is a nonparametric counterpart of a one way ANOVA F test.
Unlock Deck
Unlock for access to all 112 flashcards in this deck.
Unlock Deck
k this deck
45
Two professional football scouts (Sc)are in the process of recruiting 7 new football players (receivers).After a careful review and evaluation,both scouts ranked the seven receivers in terms of their professional career prospects.The rankings are given below.
What is the value of di2?
A)0
B)2
C)6
D)8
E)10
What is the value of di2?
A)0
B)2
C)6
D)8
E)10
Unlock Deck
Unlock for access to all 112 flashcards in this deck.
Unlock Deck
k this deck
46
A professional organization is attempting to determine whether salaries of hospital CFO s differ by geographical region. Five hospital CFOs were randomly selected from each of the following four regions: Maritimes, Quebec, Ontario, and Western Canada. Each CFO was then asked their annual salary. The distributions of salaries were highly skewed. The table below summarizes the results of the Kruskal-Wallis test obtained from Mega-Stat/Excel.
-In a local ice skating contest,there were 2 judges and 15 contestants.Each judge was asked to rate each contestant on a 7-point scale.The most successful candidates received a rating value of 7,while the least successful candidates received a rating value of 1.It appeared that the bivariate normal probability distribution assumption is severely violated.The City Council wants to know whether the judges have similar opinions in rating ice skating competitors.At a significance level of .01,the rejection point condition for the hypothesis test is:
A)Reject H0 if rs > .457
B)Reject H0 if rs > .623
C)Reject H0 if rs > .441
D)Reject H0 if rs > .646
E)Reject H0 if rs > .689
Unlock Deck
Unlock for access to all 112 flashcards in this deck.
Unlock Deck
k this deck
47
A professional organization is attempting to determine whether salaries of hospital CFO s differ by geographical region. Five hospital CFOs were randomly selected from each of the following four regions: Maritimes, Quebec, Ontario, and Western Canada. Each CFO was then asked their annual salary. The distributions of salaries were highly skewed. The table below summarizes the results of the Kruskal-Wallis test obtained from Mega-Stat/Excel.
-At a significance level of .05,the rejection point condition for the hypothesis test is:
A)Reject H0 if c2 > 9.3484
B)Reject H0 if c2 > 30.1435
C)Reject H0 if c2 > 7.81473
D)Reject H0 if c2 > .341846
E)Reject H0 if c2 > 32.8523
-At a significance level of .05,the rejection point condition for the hypothesis test is:
A)Reject H0 if c2 > 9.3484
B)Reject H0 if c2 > 30.1435
C)Reject H0 if c2 > 7.81473
D)Reject H0 if c2 > .341846
E)Reject H0 if c2 > 32.8523
Unlock Deck
Unlock for access to all 112 flashcards in this deck.
Unlock Deck
k this deck
48
Refer to the Mega-Stat/Excel output for the Wilcoxon rank sum test given in the table below.
105.00 expected value
13.07 standard deviation
, corrected for ties
-value (two-
tailed)
-At a significance level of .05,which one of the following statements is correct when the alternative hypothesis is Ha: D1 is shifted to the left of D2?
A)We reject H0 and conclude there is very strong evidence that D1 is shifted to the right or left of D2.
B)We reject H0 and conclude there is very strong evidence that D1 is shifted to the left of D2.
C)We failed to reject H0 and conclude there is not sufficient evidence that D1 is shifted to the left of D2.
D)We failed to reject H0 and conclude there is not sufficient evidence to conclude that D1 is not shifted to the right or left of D2.
E)We failed to reject H0 and conclude there is very strong evidence that D1 is shifted to the left of D2.
Unlock Deck
Unlock for access to all 112 flashcards in this deck.
Unlock Deck
k this deck
49
What type of non-parametric statistic would generate the following excel/MegaStat output?
A)Subtraction sigma test
B)Wilcoxon signed rank test
C)Sign test
D)Kruskall-Wallis test
E)Spearman's rank correlation test
A)Subtraction sigma test
B)Wilcoxon signed rank test
C)Sign test
D)Kruskall-Wallis test
E)Spearman's rank correlation test
Unlock Deck
Unlock for access to all 112 flashcards in this deck.
Unlock Deck
k this deck
50
What type of non-parametric statistic would generate the following excel/MegaStat output? 3.5 hypothesized value
6 median
0 below
0 equal
7 above
binomial
-value (one-tailed, upper)
A)Subtraction sigma test
B)Wilcoxon signed rank test
C)Sign test
D)Kruskall-Wallis test
E)Spearman's rank correlation test
6 median
0 below
0 equal
7 above
binomial
-value (one-tailed, upper)
A)Subtraction sigma test
B)Wilcoxon signed rank test
C)Sign test
D)Kruskall-Wallis test
E)Spearman's rank correlation test
Unlock Deck
Unlock for access to all 112 flashcards in this deck.
Unlock Deck
k this deck
51
An e-business/e-commerce information technology consulting company wants to compare the effectiveness of three programming languages that its programmers use.Currently each programming language is used by approximately 1/3 of the programmers employed by the company.The director of programming division randomly selected 5 programmers from the users of each of the three programming languages and assigned the same simple programming task to each programmer.It is known that all three populations have highly skewed distributions with extreme outliers.The value of Ti (rank sum)for Program A is _____.
A)40
B)48
C)23
D)49
E)57
A)40
B)48
C)23
D)49
E)57
Unlock Deck
Unlock for access to all 112 flashcards in this deck.
Unlock Deck
k this deck
52
Refer to the Mega-Stat/Excel output for the Wilcoxon rank sum test given in the table below.
105.00 expected value
13.07 standard deviation
, corrected for ties
-value (two-
tailed)
-At a significance level of .05,which one of the following rejection point conditions is correct when the alternative hypothesis is Ha: D1 is shifted to the left of D2?
A)Reject H0 if T ? 83.
B)Reject H0 if T ? 127
C)Reject H0 if T ? 131
D)Reject H0 if T ? 83
E)Reject H0 if T ? 79
Unlock Deck
Unlock for access to all 112 flashcards in this deck.
Unlock Deck
k this deck
53
The __________________ test is a nonparametric counterpart of a small sample t test for comparing two independent population locations.
Unlock Deck
Unlock for access to all 112 flashcards in this deck.
Unlock Deck
k this deck
54
Two coffee-vending machines are studied to determine whether they distribute the same amounts.Samples are taken and the amounts dispensed are recorded for each machine.What is the value of TB?
A)117
B)122
C)93
D)59
E)119
A)117
B)122
C)93
D)59
E)119
Unlock Deck
Unlock for access to all 112 flashcards in this deck.
Unlock Deck
k this deck
55
A professional organization is attempting to determine whether salaries of hospital CFO s differ by geographical region. Five hospital CFOs were randomly selected from each of the following four regions: Maritimes, Quebec, Ontario, and Western Canada. Each CFO was then asked their annual salary. The distributions of salaries were highly skewed. The table below summarizes the results of the Kruskal-Wallis test obtained from Mega-Stat/Excel.
-Wax-com Electronics Inc.claims that a certain circuit board has a median operating life of greater than 20,000 hours.A random sample of 25 such circuit boards showed 8 circuit boards failing before 20,000 hours and 17 circuit boards failing after 20,000 hours.Assume the useful life of the circuit board is not normally distributed.Is there evidence to support their claim? What is the resulting test statistic and conclusion?
A)1.6,fail to reject H0
B)1.6,reject H0
C)-1.6,reject H0
D)-1.6,fail to reject H0
E)1.645,reject H0
Unlock Deck
Unlock for access to all 112 flashcards in this deck.
Unlock Deck
k this deck
56
Refer to the Mega-Stat/Excel output for the Wilcoxon signed rank test given in the table below.
Wilcoxon Signed Rank Test
variables: Group 1 - Group 2
5.5 sum of positive
ranks
30.5 sum of negative
ranks
18.00 expected value
5.74 standard deviation
, corrected for ties
.0296 p-value (two-
tailed)
-Assuming there were no paired differences equal to zero,at a significance level of .01 which one of the following rejection point conditions is correct when the alternative hypothesis is Ha: D1 is shifted to the left of D2?
A)T- ? 5
B)T+ ? 0
C)T- ? 11
D)T- ? 3
E)Smaller of the T+ or T- is less than 8
Unlock Deck
Unlock for access to all 112 flashcards in this deck.
Unlock Deck
k this deck
57
Refer to the Mega-Stat/Excel output for the Wilcoxon signed rank test given in the table below.
Wilcoxon Signed Rank Test
variables: Group 1 - Group 2
5.5 sum of positive
ranks
30.5 sum of negative
ranks
18.00 expected value
5.74 standard deviation
, corrected for ties
.0296 p-value (two-
tailed)
-At a significance level of .01,which one of the following statements is correct when the alternative hypothesis is Ha: D1 is shifted to the left of D2?
A)We reject H0 and conclude there is not sufficient evidence that the probability distribution of population 1 is shifted to the left of the probability distribution of population 2.
B)We failed to reject H0 and conclude there is not sufficient evidence that the probability distribution of population 1 is shifted to the left of the probability distribution of population 2.
C)We reject H0 and conclude there is very strong evidence that the probability distribution of population 1 is shifted to the left of the probability distribution of population 2.
D)We failed to reject H0 and conclude there is very strong evidence that the probability distribution of population 1 is shifted to the left or to the right of the probability distribution of population 2.
E)We failed to reject H0 and conclude there is very strong evidence that the probability distribution of population 1 is identical to the probability distribution of population 2.
Unlock Deck
Unlock for access to all 112 flashcards in this deck.
Unlock Deck
k this deck
58
A ______ test is a statistical test that can be used without assuming that the sampled population(s)have a particular type of probability distribution.
Unlock Deck
Unlock for access to all 112 flashcards in this deck.
Unlock Deck
k this deck
59
A professional organization is attempting to determine whether salaries of hospital CFO s differ by geographical region. Five hospital CFOs were randomly selected from each of the following four regions: Maritimes, Quebec, Ontario, and Western Canada. Each CFO was then asked their annual salary. The distributions of salaries were highly skewed. The table below summarizes the results of the Kruskal-Wallis test obtained from Mega-Stat/Excel.
-At a significance level of .05,which one of the following statements is correct regarding the null hypothesis H0: The distributions of CFO salaries are identical for all four regions?
A)We reject H0 and conclude there is very strong evidence that the distributions of CFO salaries differ in location for all four regions.
B)We failed to reject H0 and conclude there is not sufficient evidence that the distributions of CFO salaries differ significantly in location any of the four regions.
C)We failed to reject H0 and conclude there is only adequate evidence that the median hospital CFO salaries differ between at least two of the four regions.
D)We reject H0 and conclude there is strong evidence that the distributions of CFO salaries differ in location between at least two of the four regions.
E)We failed to reject H0 and conclude that the distributions of CFO salaries are identical for all four regions.
Unlock Deck
Unlock for access to all 112 flashcards in this deck.
Unlock Deck
k this deck
60
The claim of the manufacturer of cell phone batteries is that the median life of a battery is more than 40 hours.Suppose a random sample of 75 batteries finds that 32 have a life of more than 40 hours.Does the evidence support their claim? Which is the corresponding test statistic result?
A)-1.39
B)1.96
C)-1.96
D)1.39
E)1.55
A)-1.39
B)1.96
C)-1.96
D)1.39
E)1.55
Unlock Deck
Unlock for access to all 112 flashcards in this deck.
Unlock Deck
k this deck
61
Five years ago, the average starting salary of a new university graduate with a major in marketing was $34,000. A random sample of 10 graduates from this year's graduating class of a local university yielded the following starting salaries in thousands of dollars: 28, 36, 25, 37, 35, 24, 38, 45, 39, 36. The population of starting salaries in marketing is not normally distributed.
The local university wants to determine if the median starting salary for marketing graduates has increased in the last five years.
-Using a = .05,can we conclude that the starting salaries increased in the last five years?
The local university wants to determine if the median starting salary for marketing graduates has increased in the last five years.
-Using a = .05,can we conclude that the starting salaries increased in the last five years?
Unlock Deck
Unlock for access to all 112 flashcards in this deck.
Unlock Deck
k this deck
62
Wax-com Electronics Inc. claims that a certain circuit board has a median operating life of greater than 20,000 hours. A random sample of 25 such circuit boards showed 8 circuit boards failing before 20,000 hours and 17 circuit boards failing after 20,000 hours. Assume the useful life of the circuit board is not normally distributed. Is there evidence to support their claim?
-State the null and alternative hypotheses.
-State the null and alternative hypotheses.
Unlock Deck
Unlock for access to all 112 flashcards in this deck.
Unlock Deck
k this deck
63
Based on this result of the test,provide a one sentence conclusion.
Unlock Deck
Unlock for access to all 112 flashcards in this deck.
Unlock Deck
k this deck
64
An e-business/e-commerce information technology consulting company wants to compare the effectiveness of three programming languages that its programmers use. Currently each programming language is used by approximately 1/3 of the programmers employed by the company. The director of programming division randomly selected 5 programmers from the users of each of the three programming languages and assigned the same simple programming task to each programmer. It is known that all three populations have highly skewed distributions with extreme outliers.
-Calculate the value of Ti (rank sum)for each of the three samples.
-Calculate the value of Ti (rank sum)for each of the three samples.
Unlock Deck
Unlock for access to all 112 flashcards in this deck.
Unlock Deck
k this deck
65
A copy machine service company provides maintenance and repair service for different types and brands of copiers.The manager of the repair department wants to know if the repair time for brand A is higher than the repair time for brand B.The manager randomly selected 8 repair records associated with brand A and 8 repair records associated with brand B.The repair times for both samples in minutes are given below.The distribution of repair times for both brand A and brand B is highly skewed.
What is the appropriate null and alternative hypothesis for this problem?
What is the appropriate null and alternative hypothesis for this problem?
Unlock Deck
Unlock for access to all 112 flashcards in this deck.
Unlock Deck
k this deck
66
When a large sample is taken,_______________ approximation to the binomial distribution can be used to implement the sign test.
Unlock Deck
Unlock for access to all 112 flashcards in this deck.
Unlock Deck
k this deck
67
Five years ago, the average starting salary of a new university graduate with a major in marketing was $34,000. A random sample of 10 graduates from this year's graduating class of a local university yielded the following starting salaries in thousands of dollars: 28, 36, 25, 37, 35, 24, 38, 45, 39, 36. The population of starting salaries in marketing is not normally distributed.
The local university wants to determine if the median starting salary for marketing graduates has increased in the last five years.
-State the null and alternative hypotheses.
The local university wants to determine if the median starting salary for marketing graduates has increased in the last five years.
-State the null and alternative hypotheses.
Unlock Deck
Unlock for access to all 112 flashcards in this deck.
Unlock Deck
k this deck
68
In order to perform the ________________ test,all of the observations in two samples are combined into a single set and all of the values in the single set are ranked from smallest to largest.
Unlock Deck
Unlock for access to all 112 flashcards in this deck.
Unlock Deck
k this deck
69
The ______________ test is a nonparametric method that requires data consisting of matched pairs.
Unlock Deck
Unlock for access to all 112 flashcards in this deck.
Unlock Deck
k this deck
70
Are repair times for brand A systematically higher than the repair times for brand B? Test at a = .05.
B.H0: DA and DB are identical,HA: DA is shifted to the right of DB
T = 89.5
From table A15 for n1 = 8,and n2 = 8,TU = 84
Since 89.5 > 84,we reject H0 and conclude that the repair times for brand A is higher than the repair times for brand
B.H0: DA and DB are identical,HA: DA is shifted to the right of DB
T = 89.5From table A15 for n1 = 8,and n2 = 8,TU = 84
Since 89.5 > 84,we reject H0 and conclude that the repair times for brand A is higher than the repair times for brand
Unlock Deck
Unlock for access to all 112 flashcards in this deck.
Unlock Deck
k this deck
71
A packaging company of dog biscuits has stipulated that the number of dog biscuits per package is to be no more than 100 on the average. A random sample of 9 packages had the following number of biscuits: 144, 85, 90, 120, 150, 105, 93, 130 and 115. Assume the population of biscuit counts per package is non-normal. The company wants to test to determine if more biscuits are going into each package than the stipulated 100.
-Is there significant evidence to conclude that more biscuits are going into each package than the stipulated 100? Test at a = .05.
-Is there significant evidence to conclude that more biscuits are going into each package than the stipulated 100? Test at a = .05.
Unlock Deck
Unlock for access to all 112 flashcards in this deck.
Unlock Deck
k this deck
72
A packaging company of dog biscuits has stipulated that the number of dog biscuits per package is to be no more than 100 on the average. A random sample of 9 packages had the following number of biscuits: 144, 85, 90, 120, 150, 105, 93, 130 and 115. Assume the population of biscuit counts per package is non-normal. The company wants to test to determine if more biscuits are going into each package than the stipulated 100.
-State the null and alternative hypothesis.
-State the null and alternative hypothesis.
Unlock Deck
Unlock for access to all 112 flashcards in this deck.
Unlock Deck
k this deck
73
If the population from which we sample is highly skewed to the right or to the left,then the population _________ might be a better measure of central tendency than the population mean
Unlock Deck
Unlock for access to all 112 flashcards in this deck.
Unlock Deck
k this deck
74
In a Wilcoxon Rank Sum Test,when two or more observations are equal,we assign to each tied observation a rank equal to the ______ of the consecutive ranks.
Unlock Deck
Unlock for access to all 112 flashcards in this deck.
Unlock Deck
k this deck
75
Wax-com Electronics Inc. claims that a certain circuit board has a median operating life of greater than 20,000 hours. A random sample of 25 such circuit boards showed 8 circuit boards failing before 20,000 hours and 17 circuit boards failing after 20,000 hours. Assume the useful life of the circuit board is not normally distributed. Is there evidence to support their claim?
-At a = 0.05,can it be concluded that the sample supports their claim of the company? Assume the useful life of the circuit board is not normally distributed.
-At a = 0.05,can it be concluded that the sample supports their claim of the company? Assume the useful life of the circuit board is not normally distributed.
Unlock Deck
Unlock for access to all 112 flashcards in this deck.
Unlock Deck
k this deck
76
Five years ago, the average starting salary of a new university graduate with a major in marketing was $34,000. A random sample of 10 graduates from this year's graduating class of a local university yielded the following starting salaries in thousands of dollars: 28, 36, 25, 37, 35, 24, 38, 45, 39, 36. The population of starting salaries in marketing is not normally distributed.
The local university wants to determine if the median starting salary for marketing graduates has increased in the last five years.
-Assume that the population of starting salaries in marketing is not normally distributed.The p-value is found to be .0547.Using a = .10,can we conclude that the starting salaries have increased in the last five years?
Unlock Deck
Unlock for access to all 112 flashcards in this deck.
Unlock Deck
k this deck
77
In order to perform the ________________ test,all of the observations in p samples are combined into a single set and all of the values in the single set are ranked from smallest to largest.After ranking,sum of the ranks for each of the p samples are calculated.
Unlock Deck
Unlock for access to all 112 flashcards in this deck.
Unlock Deck
k this deck
78
If there are five or more observations in each sample,the Kruskall-Wallis H statistic has an approximately _____________ distribution.
Unlock Deck
Unlock for access to all 112 flashcards in this deck.
Unlock Deck
k this deck
79
The Wilcoxon rank sum test is used to compares the locations of two _____________ populations.
Unlock Deck
Unlock for access to all 112 flashcards in this deck.
Unlock Deck
k this deck
80
The rank sum values for each of the programming groups are: T1 = 23,T2 = 48,and T3 = 49.At a = .05,does the distribution of time required to program a simple task differ in location between at least one pair of programming languages?
Unlock Deck
Unlock for access to all 112 flashcards in this deck.
Unlock Deck
k this deck
Unlock Deck
Unlock for access to all 112 flashcards in this deck.


