Deck 15: Correlation
Full screen (f)
Question
Question
Question
Question
Question
Question
Question
Question
Question
Question
Question
Question
Question
Question
Question
Question
Question
Question
Question
Question
Question
Question
Question
Question
Question
Question
Question
Question
Question
Question
Question
Question
Question
Question
Question
Question
Question
Question
Question
Question
Question
Question
Question
Question
Question
Question
Question
Question
Question
Question
Question
Question
Question
Question
Question
Question
Question
Question
Question
Question
Question
Compute the Pearson correlation for the following data. 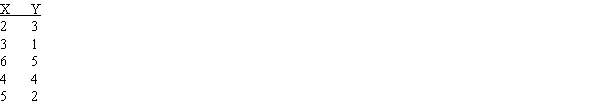
Question
Question
Compute the Pearson correlation for the following data. 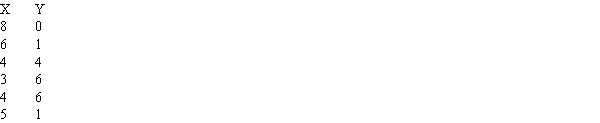
Question
A psychologist would like to evaluate the relationship between verbal skills as measured by the Scholastic Achievement Test (SAT)and performance on an anagram task.(Anagrams are words with the letters scrambled.The task is to unscramble the letters and identify the word.)Each subject is given a set of 10 anagrams,and the psychologist records how much time is needed to solve all 10.The anagram times and each subject's SAT score are as follows.(Note that two subjects failed to complete all 10 anagrams.)Use a Spearman correlation to measure and describe the relationship between SAT and anagram performance. 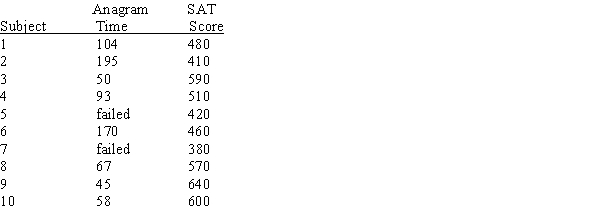
Question
Question
Question
Question
Question
Question
Question
Question
Question
The following data show the results from an independent-measures study comparing two treatments.
a. Compute the independent-measures t statistic for these data.
b. Compute the percentage of variance explained by the treatment effect (r2).
b.)Treatment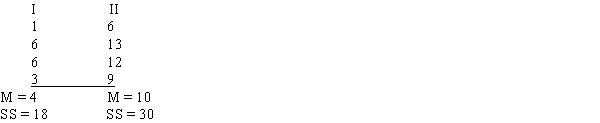
c. Convert the data into a form suitable for calculating the point-biserial correlation, and compute the correlation. (You should find that squaring the point-biserial correlation will produce the same r2 value that you obtained in part
Question
Question
Question

Unlock Deck
Sign up to unlock the cards in this deck!
Unlock Deck
Unlock Deck
1/76
Play
Full screen (f)
Deck 15: Correlation
1
The results from a research study indicate that adolescents who watch more violent content on television also tend to engage in more violent behavior than their peers.The correlation between amount of TV violent content and amount of violent behavior is an example of a ____.
A)positive correlation
B)negative correlation
C)correlation near zero
D)correlation near one
A)positive correlation
B)negative correlation
C)correlation near zero
D)correlation near one
positive correlation
2
Which of the following best describes the Pearson correlation for these data??
A)?It is positive.
B)?It is negative.
C)?It is close to zero.
D)?It is equal to zero.
A)?It is positive.
B)?It is negative.
C)?It is close to zero.
D)?It is equal to zero.
?It is negative.
3
What would the scatterplot show for data that produce a correlation of +0.88?
A)points clustered close to a line that slopes up to the right
B)points clustered close to a line that slopes down to the right
C)points widely scattered around a line that slopes up to the right
D)points widely scattered around a line that slopes down to the right
A)points clustered close to a line that slopes up to the right
B)points clustered close to a line that slopes down to the right
C)points widely scattered around a line that slopes up to the right
D)points widely scattered around a line that slopes down to the right
points clustered close to a line that slopes up to the right
4
A scatter plot shows data points that are widely scattered around a line that slopes down to the right.Which value would be closest to the correlation for these data?
A)-0.80
B)-0.40
C)0.40
D)0.80
A)-0.80
B)-0.40
C)0.40
D)0.80
Unlock Deck
Unlock for access to all 76 flashcards in this deck.
Unlock Deck
k this deck
5
A set of n = 10 pairs of scores has ΣX = 20,ΣY = 30,and ΣXY = 74.What is the value of SP for these data?
A)74
B)24
C)14
D)-14
A)74
B)24
C)14
D)-14
Unlock Deck
Unlock for access to all 76 flashcards in this deck.
Unlock Deck
k this deck
6
A set of n = 15 pairs of scores (X and Y values)has SSX = 4,SSY = 25,and SP = 6.The Pearson correlation for these data is ____.?
A)6/100?
B)?6/10
C)?6/(100/15)
D)?6/(10/ )
A)6/100?
B)?6/10
C)?6/(100/15)
D)?6/(10/ )
Unlock Deck
Unlock for access to all 76 flashcards in this deck.
Unlock Deck
k this deck
7
A college professor reports that students who finish exams early tend to get better grades than students who hold on to exams until the last possible moment.The correlation between exam score and amount of time spent on the exam is an example of a ____.
A)positive correlation
B)negative correlation
C)correlation near zero
D)correlation near one
A)positive correlation
B)negative correlation
C)correlation near zero
D)correlation near one
Unlock Deck
Unlock for access to all 76 flashcards in this deck.
Unlock Deck
k this deck
8
What is indicated by a positive value for a correlation?
A)Increases in X tend to be accompanied by increases in Y.
B)Increases in X tend to be accompanied by decreases in Y.
C)A much stronger relationship exists than if the correlation were negative.
D)A much weaker relationship exists than if the correlation were negative.
A)Increases in X tend to be accompanied by increases in Y.
B)Increases in X tend to be accompanied by decreases in Y.
C)A much stronger relationship exists than if the correlation were negative.
D)A much weaker relationship exists than if the correlation were negative.
Unlock Deck
Unlock for access to all 76 flashcards in this deck.
Unlock Deck
k this deck
9
The term correlation refers to a statistical technique that is used to ____.
A)measure and describe the linear relationship between two variables
B)measure the magnitude of a variable
C)measure the significance of a variable
D)measure the fit of a model
A)measure and describe the linear relationship between two variables
B)measure the magnitude of a variable
C)measure the significance of a variable
D)measure the fit of a model
Unlock Deck
Unlock for access to all 76 flashcards in this deck.
Unlock Deck
k this deck
10
For which of the following correlations would the data points be clustered most closely around a straight line?
A)r = -0.10
B)r = +0.40
C)r = -0.70
D)r = -0.00
A)r = -0.10
B)r = +0.40
C)r = -0.70
D)r = -0.00
Unlock Deck
Unlock for access to all 76 flashcards in this deck.
Unlock Deck
k this deck
11
The scatter plot for a set of X and Y values shows the data points clustered in a nearly perfect circle.For these data,what is the most likely value for the correlation?
A)a positive correlation near 0
B)a negative correlation near 0
C)either positive or negative near 0
D)a value near +1.00 or 1.00
A)a positive correlation near 0
B)a negative correlation near 0
C)either positive or negative near 0
D)a value near +1.00 or 1.00
Unlock Deck
Unlock for access to all 76 flashcards in this deck.
Unlock Deck
k this deck
12
A set of n = 5 pairs of X and Y scores has ΣX = 15,ΣY = 5,and ΣXY = 10.For these data,the value of SP is ____.
A)-5
B)5
C)10
D)25
A)-5
B)5
C)10
D)25
Unlock Deck
Unlock for access to all 76 flashcards in this deck.
Unlock Deck
k this deck
13
A researcher records the odometer reading and age of used Hondas.What kind of correlation is likely to be obtained for these two variables?
A)a positive correlation
B)a negative correlation
C)a correlation near zero
D)a correlation near one
A)a positive correlation
B)a negative correlation
C)a correlation near zero
D)a correlation near one
Unlock Deck
Unlock for access to all 76 flashcards in this deck.
Unlock Deck
k this deck
14
A researcher measures driving distance from college and weekly expense on gas for a group of commuting college students.What kind of correlation is likely to be obtained for these two variables?
A)a positive correlation
B)a negative correlation
C)a correlation near zero
D)a correlation near one
A)a positive correlation
B)a negative correlation
C)a correlation near zero
D)a correlation near one
Unlock Deck
Unlock for access to all 76 flashcards in this deck.
Unlock Deck
k this deck
15
What is the value of SP for the following set of data??
A)-1?
B)?-5
C)?5
D)?1
A)-1?
B)?-5
C)?5
D)?1
Unlock Deck
Unlock for access to all 76 flashcards in this deck.
Unlock Deck
k this deck
16
The numerical value for a correlation can ____.
A)never be greater than 1.00
B)never be less than 1.00
C)never be greater than 1.00 and can never be less than -1.00
D)be greater than 1.00 and can be less than -1.00
A)never be greater than 1.00
B)never be less than 1.00
C)never be greater than 1.00 and can never be less than -1.00
D)be greater than 1.00 and can be less than -1.00
Unlock Deck
Unlock for access to all 76 flashcards in this deck.
Unlock Deck
k this deck
17
A researcher measures IQ and weight for a group of college students.What kind of correlation is likely to be obtained for these two variables?
A)a positive correlation
B)a negative correlation
C)a correlation near zero
D)a correlation near one
A)a positive correlation
B)a negative correlation
C)a correlation near zero
D)a correlation near one
Unlock Deck
Unlock for access to all 76 flashcards in this deck.
Unlock Deck
k this deck
18
What is the value of SP for the following set of data??
A)?-5
B)?5
C)?-15
D)?15
A)?-5
B)?5
C)?-15
D)?15
Unlock Deck
Unlock for access to all 76 flashcards in this deck.
Unlock Deck
k this deck
19
Which of the following sets of correlations is correctly ordered from the highest to the lowest degree of relationship?
A)0.91, +0.83, +0.10, 0.03
B)0.91, +0.83, 0.03, 0.10
C)+0.83, +0.10, 0.91, 0.03
D)+0.83, +0.10, 0.03, 0.91
A)0.91, +0.83, +0.10, 0.03
B)0.91, +0.83, 0.03, 0.10
C)+0.83, +0.10, 0.91, 0.03
D)+0.83, +0.10, 0.03, 0.91
Unlock Deck
Unlock for access to all 76 flashcards in this deck.
Unlock Deck
k this deck
20
Which correlation value shows the greatest strength or consistency of relationship?
A)-0.90
B)+0.74
C)+0.85
D)-0.33
A)-0.90
B)+0.74
C)+0.85
D)-0.33
Unlock Deck
Unlock for access to all 76 flashcards in this deck.
Unlock Deck
k this deck
21
For a sample of n = 16 individuals,how large a Pearson correlation is necessary to be statistically significant for a two-tailed test with α = .05?
A)0.497
B)0.482
C)0.468
D)0.456
A)0.497
B)0.482
C)0.468
D)0.456
Unlock Deck
Unlock for access to all 76 flashcards in this deck.
Unlock Deck
k this deck
22
How large a sample is needed for a correlation of r = 0.550 to be significant using a two-tailed test with α = .05?
A)n = 14
B)n = 13
C)n = 12
D)n = 11
A)n = 14
B)n = 13
C)n = 12
D)n = 11
Unlock Deck
Unlock for access to all 76 flashcards in this deck.
Unlock Deck
k this deck
23
For a two-tailed hypothesis test evaluating a Pearson correlation,what is stated by the null hypothesis?
A)There is a non-zero correlation for the general population.
B)The population correlation is zero.
C)There is a non-zero correlation for the sample.
D)The sample correlation is zero.
A)There is a non-zero correlation for the general population.
B)The population correlation is zero.
C)There is a non-zero correlation for the sample.
D)The sample correlation is zero.
Unlock Deck
Unlock for access to all 76 flashcards in this deck.
Unlock Deck
k this deck
24
If the following seven scores are ranked from smallest to largest,then what rank should be assigned to a score of X = 1?Scores: 1,1,1,1,3,6,6,6,9
A)1
B)2
C)2.5
D)4
A)1
B)2
C)2.5
D)4
Unlock Deck
Unlock for access to all 76 flashcards in this deck.
Unlock Deck
k this deck
25
What correlation is obtained when the Pearson correlation is computed for data that have been converted to ranks?
A)the Spearman correlation
B)the point-biserial correlation
C)the phi coefficient
D)the simple correlation
A)the Spearman correlation
B)the point-biserial correlation
C)the phi coefficient
D)the simple correlation
Unlock Deck
Unlock for access to all 76 flashcards in this deck.
Unlock Deck
k this deck
26
A set of n = 5 pairs of X and Y values has SSX = 16,SSY = 4 and SP = 2.For these data,the Pearson correlation is ____.
A)r = 2/64
B)r = 2/8
C)r = 8/8
D)r = 64/8
A)r = 2/64
B)r = 2/8
C)r = 8/8
D)r = 64/8
Unlock Deck
Unlock for access to all 76 flashcards in this deck.
Unlock Deck
k this deck
27
The Pearson and the Spearman correlations are both computed for the same set of data.If the Spearman correlation is rS = +1.00,then what can you conclude about the Pearson correlation?
A)It will be positive.
B)It will be negative and have a value of -1.00.
C)It will be positive and have a value of 1.00.
D)It will be negative.
A)It will be positive.
B)It will be negative and have a value of -1.00.
C)It will be positive and have a value of 1.00.
D)It will be negative.
Unlock Deck
Unlock for access to all 76 flashcards in this deck.
Unlock Deck
k this deck
28
Which correlation should be used to measure the relationship between gender and grade point average for a group of college students?
A)Pearson correlation
B)Spearman correlation
C)point-biserial correlation
D)phi-coefficient
A)Pearson correlation
B)Spearman correlation
C)point-biserial correlation
D)phi-coefficient
Unlock Deck
Unlock for access to all 76 flashcards in this deck.
Unlock Deck
k this deck
29
Under what circumstances is the point-biserial correlation used?
A)in the same circumstances when a repeated-measures t test would be used
B)when X consists of regular, numerical scores but Y is dichotomous
C)when both X and Y are dichotomous variables
D)when both X and Y are measured on an ordinal scale (ranks)
A)in the same circumstances when a repeated-measures t test would be used
B)when X consists of regular, numerical scores but Y is dichotomous
C)when both X and Y are dichotomous variables
D)when both X and Y are measured on an ordinal scale (ranks)
Unlock Deck
Unlock for access to all 76 flashcards in this deck.
Unlock Deck
k this deck
30
As the sample size gets larger,what happens to the size of the correlation that is needed for significance?
A)It also gets larger.
B)It gets smaller.
C)It stays constant.
D)There is no consistent relationship between sample size and the critical value for a significant correlation.
A)It also gets larger.
B)It gets smaller.
C)It stays constant.
D)There is no consistent relationship between sample size and the critical value for a significant correlation.
Unlock Deck
Unlock for access to all 76 flashcards in this deck.
Unlock Deck
k this deck
31
The Pearson and the Spearman correlations are both computed for the same set of data.If the Pearson correlation is r = +1.00,then what can you conclude about the Spearman correlation?
A)It will be negative.
B)It will have a value of -1.00.
C)It will be positive and have a value of 1.00.
D)There is no predictable relationship between the Pearson and the Spearman correlations.
A)It will be negative.
B)It will have a value of -1.00.
C)It will be positive and have a value of 1.00.
D)There is no predictable relationship between the Pearson and the Spearman correlations.
Unlock Deck
Unlock for access to all 76 flashcards in this deck.
Unlock Deck
k this deck
32
The effect size for the data from an independent-measures t test can be measured by r2.Which of the following also produces the value for r2?
A)squaring the Spearman correlation for the same data
B)squaring the point-biserial correlation for the same data
C)squaring the Pearson correlation for the same data
D)taking the square root of the Pearson correlation
A)squaring the Spearman correlation for the same data
B)squaring the point-biserial correlation for the same data
C)squaring the Pearson correlation for the same data
D)taking the square root of the Pearson correlation
Unlock Deck
Unlock for access to all 76 flashcards in this deck.
Unlock Deck
k this deck
33
If the Pearson correlation is calculated for a sample of n = 20 individuals,what value for df should be used to determine whether or not the correlation is significant?
A)18
B)19
C)20
D)21
A)18
B)19
C)20
D)21
Unlock Deck
Unlock for access to all 76 flashcards in this deck.
Unlock Deck
k this deck
34
A researcher obtains a Pearson correlation of r = 0.43 for a sample of n = 20 participants.For a two-tailed test,which of the following accurately describes the significance of the correlation?
A)The correlation is significant with α = .05 but not with α = .01.
B)The correlation is significant with either α = .05 or α = .01.
C)The correlation is not significant with either α = .05 or α = .01.
D)The correlation is equal to zero.
A)The correlation is significant with α = .05 but not with α = .01.
B)The correlation is significant with either α = .05 or α = .01.
C)The correlation is not significant with either α = .05 or α = .01.
D)The correlation is equal to zero.
Unlock Deck
Unlock for access to all 76 flashcards in this deck.
Unlock Deck
k this deck
35
For a group of graduating college seniors,a researcher records each student's rank in his/her high school graduating class and the student's rank in the college graduating class.Which correlation should be used to measure the relationship between these two variables?
A)Pearson correlation
B)Spearman correlation
C)point-biserial correlation
D)phi-coefficient
A)Pearson correlation
B)Spearman correlation
C)point-biserial correlation
D)phi-coefficient
Unlock Deck
Unlock for access to all 76 flashcards in this deck.
Unlock Deck
k this deck
36
Suppose that the correlation between height and weight for adults is +0.40.What proportion (or percent)of the variability in weight can be explained by the relationship with height?
A)40%
B)60%
C)16%
D)84%
A)40%
B)60%
C)16%
D)84%
Unlock Deck
Unlock for access to all 76 flashcards in this deck.
Unlock Deck
k this deck
37
A Pearson correlation is computed for a sample of n = 18 pairs of X and Y values.What correlations are statistically significant with α = .05,two tails?
A)correlations between 0.468 and -0.468
B)correlations greater than or equal to 0.468 and correlation less than or equal to -0.468
C)correlations between 0.456 and -0.456
D)correlations greater than or equal to 0.456 and correlation less than or equal to -0.456
A)correlations between 0.468 and -0.468
B)correlations greater than or equal to 0.468 and correlation less than or equal to -0.468
C)correlations between 0.456 and -0.456
D)correlations greater than or equal to 0.456 and correlation less than or equal to -0.456
Unlock Deck
Unlock for access to all 76 flashcards in this deck.
Unlock Deck
k this deck
38
Under what circumstances is the phi-coefficient used?
A)when one variable consists of ranks and the other is regular, numerical scores
B)when both variables consists of ranks
C)when both X and Y are dichotomous variables
D)when one variable is dichotomous and the other is regular, numerical scores
A)when one variable consists of ranks and the other is regular, numerical scores
B)when both variables consists of ranks
C)when both X and Y are dichotomous variables
D)when one variable is dichotomous and the other is regular, numerical scores
Unlock Deck
Unlock for access to all 76 flashcards in this deck.
Unlock Deck
k this deck
39
If the following seven scores are ranked from smallest to largest,then what rank should be assigned to a score of X = 6?Scores: 1,1,3,6,6,6,9
A)3
B)4
C)5
D)6
A)3
B)4
C)5
D)6
Unlock Deck
Unlock for access to all 76 flashcards in this deck.
Unlock Deck
k this deck
40
A set of n = 15 pairs of scores (X and Y values)produces a correlation of r = 0.40.If each of the X values is multiplied by 2 and the correlation is computed for the new scores,what value will be obtained for the new correlation?
A)r = 0.20
B)r = 0.40
C)r = 0.80
D)This cannot be determined without knowing all the X and Y scores.
A)r = 0.20
B)r = 0.40
C)r = 0.80
D)This cannot be determined without knowing all the X and Y scores.
Unlock Deck
Unlock for access to all 76 flashcards in this deck.
Unlock Deck
k this deck
41
The value for the sum of products (SP)is always greater than or equal to zero.
Unlock Deck
Unlock for access to all 76 flashcards in this deck.
Unlock Deck
k this deck
42
The value r2 is called the coefficient of determination because it measures the proportion of variability in one variable that can be determined from the relationship with the other variable.
Unlock Deck
Unlock for access to all 76 flashcards in this deck.
Unlock Deck
k this deck
43
For a set of n = 10 pairs of scores with ΣX = 10,ΣY = 40,and ΣXY = 50,the sum of products of deviation is SP = 10.
Unlock Deck
Unlock for access to all 76 flashcards in this deck.
Unlock Deck
k this deck
44
A negative correlation means that decreases in the X variable tend to be accompanied by decreases in the Y variable.
Unlock Deck
Unlock for access to all 76 flashcards in this deck.
Unlock Deck
k this deck
45
For a positive correlation,decreases in X tend to be accompanied by decreases in Y.
Unlock Deck
Unlock for access to all 76 flashcards in this deck.
Unlock Deck
k this deck
46
Suppose that there is a correlation of +0.41 between the amount of time that each student spends on social media and the student's grade on the exam.This correlation clearly indicates that people who spend more time on social media receive better grades.
Unlock Deck
Unlock for access to all 76 flashcards in this deck.
Unlock Deck
k this deck
47
The sign (+ or -)and the strength of a correlation are independent of each other.
Unlock Deck
Unlock for access to all 76 flashcards in this deck.
Unlock Deck
k this deck
48
A researcher obtains SSX = 20,SSY = 5,and SP = 7 for a set of n = 25 pairs of scores.The Pearson correlation for these scores is r = 7/10 = 0.70.
Unlock Deck
Unlock for access to all 76 flashcards in this deck.
Unlock Deck
k this deck
49
The value obtained for the sum of products,SP,determines the sign (+/)for the correlation.
Unlock Deck
Unlock for access to all 76 flashcards in this deck.
Unlock Deck
k this deck
50
The value for a correlation can never be greater than +1.00.
Unlock Deck
Unlock for access to all 76 flashcards in this deck.
Unlock Deck
k this deck
51
If the data points in a scatter plot show a nearly circular pattern,then the correlation is near zero.
Unlock Deck
Unlock for access to all 76 flashcards in this deck.
Unlock Deck
k this deck
52
The sum of products (SP)is used to measure the amount of covariability between two variables.
Unlock Deck
Unlock for access to all 76 flashcards in this deck.
Unlock Deck
k this deck
53
There is a statistical technique,known as partial correlation,which allows a researcher to measure the relationship between two variables while eliminating or holding constant the influence of a third variable.
Unlock Deck
Unlock for access to all 76 flashcards in this deck.
Unlock Deck
k this deck
54
The Pearson correlation measures the degree and the direction of the linear relationship between two variables.
Unlock Deck
Unlock for access to all 76 flashcards in this deck.
Unlock Deck
k this deck
55
Whenever a correlation is computed from scores that do not represent the full range of possible values,one is working with a restricted range and caution should be used when interpreting the correlation.
Unlock Deck
Unlock for access to all 76 flashcards in this deck.
Unlock Deck
k this deck
56
A correlation of +0.95 means that there is essentially no consistent relationship between X and Y.
Unlock Deck
Unlock for access to all 76 flashcards in this deck.
Unlock Deck
k this deck
57
Assuming that other factors are constant,a correlation of r = 0.95 will result in more accurate predictions than a correlation of r = +0.70.
Unlock Deck
Unlock for access to all 76 flashcards in this deck.
Unlock Deck
k this deck
58
If you measured hearing acuity and age for a group of people who are 50 to 90 years old,you should obtain a negative correlation between the two variables.
Unlock Deck
Unlock for access to all 76 flashcards in this deck.
Unlock Deck
k this deck
59
A correlation of +0.90 indicates that the data points are clustered close to a line that slopes down to the right.
Unlock Deck
Unlock for access to all 76 flashcards in this deck.
Unlock Deck
k this deck
60
If the value of the Pearson correlation between two variables is r = +1.00 or 1.00,then all data points in a scatter plot will fit perfectly on a straight line.
Unlock Deck
Unlock for access to all 76 flashcards in this deck.
Unlock Deck
k this deck
61
Compute the Pearson correlation for the following data.
Unlock Deck
Unlock for access to all 76 flashcards in this deck.
Unlock Deck
k this deck
62
The Spearman correlation can be +1.00 or 1.00 even when there is no linear relationship between the two variables.
Unlock Deck
Unlock for access to all 76 flashcards in this deck.
Unlock Deck
k this deck
63
Compute the Pearson correlation for the following data.
Unlock Deck
Unlock for access to all 76 flashcards in this deck.
Unlock Deck
k this deck
64
A psychologist would like to evaluate the relationship between verbal skills as measured by the Scholastic Achievement Test (SAT)and performance on an anagram task.(Anagrams are words with the letters scrambled.The task is to unscramble the letters and identify the word.)Each subject is given a set of 10 anagrams,and the psychologist records how much time is needed to solve all 10.The anagram times and each subject's SAT score are as follows.(Note that two subjects failed to complete all 10 anagrams.)Use a Spearman correlation to measure and describe the relationship between SAT and anagram performance.
Unlock Deck
Unlock for access to all 76 flashcards in this deck.
Unlock Deck
k this deck
65
A sample of n = 25 pairs of scores (X and Y values)produces a correlation of r = -0.40.Are these sample data sufficient to conclude that there is a significant non-zero correlation between X and Y in the population? Use a two-tailed test at the .05 level of significance.
Unlock Deck
Unlock for access to all 76 flashcards in this deck.
Unlock Deck
k this deck
66
The Spearman correlation is used to measure the relationship when both variables have been measured on an ordinal scale (both are ranks).
Unlock Deck
Unlock for access to all 76 flashcards in this deck.
Unlock Deck
k this deck
67
If participants in a study are classified by age (over 30/under 30)and by political affiliation (Democrat/Republican),then the point-biserial correlation would be the proper technique to measure the relationship between the two variables.
Unlock Deck
Unlock for access to all 76 flashcards in this deck.
Unlock Deck
k this deck
68
A researcher classifies people by gender and by whether or not they routinely watch the evening news on television.For the resulting data,the correct method for measuring the relationship between the two variables would be the phi-coefficient.
Unlock Deck
Unlock for access to all 76 flashcards in this deck.
Unlock Deck
k this deck
69
The sign of the correlation (+/)is generally meaningless for the point-biserial correlation and the phi-coefficient.
Unlock Deck
Unlock for access to all 76 flashcards in this deck.
Unlock Deck
k this deck
70
In a test for significance of a Pearson correlation for a sample of n = 30 individuals,one determines the critical value by using df = 29.
Unlock Deck
Unlock for access to all 76 flashcards in this deck.
Unlock Deck
k this deck
71
Describe what is meant by a negative relationship and a positive relationship between two variables.
Unlock Deck
Unlock for access to all 76 flashcards in this deck.
Unlock Deck
k this deck
72
The phi-coefficient is used to measure relationships for data that would also be appropriate for an independent-measures t test.
Unlock Deck
Unlock for access to all 76 flashcards in this deck.
Unlock Deck
k this deck
73
The following data show the results from an independent-measures study comparing two treatments.
a. Compute the independent-measures t statistic for these data.
b. Compute the percentage of variance explained by the treatment effect (r2).
b.)Treatment
c. Convert the data into a form suitable for calculating the point-biserial correlation, and compute the correlation. (You should find that squaring the point-biserial correlation will produce the same r2 value that you obtained in part
a. Compute the independent-measures t statistic for these data.
b. Compute the percentage of variance explained by the treatment effect (r2).
b.)Treatment
c. Convert the data into a form suitable for calculating the point-biserial correlation, and compute the correlation. (You should find that squaring the point-biserial correlation will produce the same r2 value that you obtained in part
Unlock Deck
Unlock for access to all 76 flashcards in this deck.
Unlock Deck
k this deck
74
The phi-coefficient is the correct correlation to use when both X and Y are dichotomous variables.
Unlock Deck
Unlock for access to all 76 flashcards in this deck.
Unlock Deck
k this deck
75
Using a two-tailed test with α = .05,a sample correlation of r = 0.355 for a sample of n = 30 individuals is large enough to conclude that there is a real correlation in the general population.
Unlock Deck
Unlock for access to all 76 flashcards in this deck.
Unlock Deck
k this deck
76
If the Pearson correlation for a set of scores is equal to +1.00,then the Spearman correlation for the same scores would also be equal to +1.00.
Unlock Deck
Unlock for access to all 76 flashcards in this deck.
Unlock Deck
k this deck
Unlock Deck
Unlock for access to all 76 flashcards in this deck.


