Deck 10: Capital Markets and the Pricing of Risk
Full screen (f)
Question
Use the table for the question(s) below.
Consider the following probability distribution of returns for Alpha Corporation: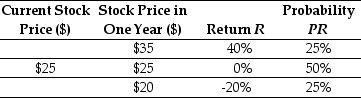
The standard deviation of the return on Alpha Corporation is closest to:
A) 22.4%
B) 19.0%
C) 21.8%
D) 19.4%
Consider the following probability distribution of returns for Alpha Corporation:
The standard deviation of the return on Alpha Corporation is closest to:
A) 22.4%
B) 19.0%
C) 21.8%
D) 19.4%
Question
Question
Question
Which of the following equations is incorrect?
A) Var(R) =![<strong>Which of the following equations is incorrect?</strong> A) Var(R) = B) SD(R) = C) Var(R) = P<sub>R</sub> × (R - E[R])<sup>2</sup> D) E[R] = P<sub>R</sub> × R <div style=padding-top: 35px>](https://storage.examlex.com/TB1619/11ea7db1_bcc5_46c1_b9bd_317e2a932326_TB1619_11.jpg)
B) SD(R) =![<strong>Which of the following equations is incorrect?</strong> A) Var(R) = B) SD(R) = C) Var(R) = P<sub>R</sub> × (R - E[R])<sup>2</sup> D) E[R] = P<sub>R</sub> × R <div style=padding-top: 35px>](https://storage.examlex.com/TB1619/11ea7db1_bcc5_46c2_b9bd_2f4dbd5ecd33_TB1619_11.jpg)
C) Var(R) =![<strong>Which of the following equations is incorrect?</strong> A) Var(R) = B) SD(R) = C) Var(R) = P<sub>R</sub> × (R - E[R])<sup>2</sup> D) E[R] = P<sub>R</sub> × R <div style=padding-top: 35px>](https://storage.examlex.com/TB1619/11ea7db1_bcc5_6dd3_b9bd_b5f973f1a220_TB1619_11.jpg) PR × (R - E[R])2
PR × (R - E[R])2
D) E[R] =![<strong>Which of the following equations is incorrect?</strong> A) Var(R) = B) SD(R) = C) Var(R) = P<sub>R</sub> × (R - E[R])<sup>2</sup> D) E[R] = P<sub>R</sub> × R <div style=padding-top: 35px>](https://storage.examlex.com/TB1619/11ea7db1_bcc5_6dd4_b9bd_072f4cd76a99_TB1619_11.jpg) PR × R
PR × R
A) Var(R) =
B) SD(R) =
C) Var(R) =
PR × (R - E[R])2D) E[R] =
PR × R Question
Question
Question
Question
Question
Use the table for the question(s) below.
Consider the following probability distribution of returns for Alpha Corporation:
The variance of the return on Alpha Corporation is closest to:
A) 5.00%
B) 4.75%
C) 3.625%
D) 3.75%
Consider the following probability distribution of returns for Alpha Corporation:
The variance of the return on Alpha Corporation is closest to:
A) 5.00%
B) 4.75%
C) 3.625%
D) 3.75%
Question
Question
Question
Question
Question
Use the table for the question(s) below.
Consider the following probability distribution of returns for Alpha Corporation:
The expected return for Alpha Corporation is closest to:
A) 6.67%
B) 5.00%
C) 10%
D) 0.00%
Consider the following probability distribution of returns for Alpha Corporation:
The expected return for Alpha Corporation is closest to:
A) 6.67%
B) 5.00%
C) 10%
D) 0.00%
Question
Question
Use the table for the question(s) below.
Consider the following probability distribution of returns for Alpha Corporation:
Suppose an investment is equally likely to have a 35% return or a -20% return.The standard deviation on the return for this investment is closest to:
A) 38.9%
B) 0%
C) 19.4%
D) 27.5%
Consider the following probability distribution of returns for Alpha Corporation:
Suppose an investment is equally likely to have a 35% return or a -20% return.The standard deviation on the return for this investment is closest to:
A) 38.9%
B) 0%
C) 19.4%
D) 27.5%
Question
Question
Use the table for the question(s) below.
Consider the following probability distribution of returns for Alpha Corporation:
Suppose an investment is equally likely to have a 35% return or a - 20% return.The expected return for this investment is closest to:
A) 7.5%
B) 15%
C) 5%
D) 10%
Consider the following probability distribution of returns for Alpha Corporation:
Suppose an investment is equally likely to have a 35% return or a - 20% return.The expected return for this investment is closest to:
A) 7.5%
B) 15%
C) 5%
D) 10%
Question
Question
Use the table for the question(s) below.
Consider the following probability distribution of returns for Alpha Corporation:
Suppose an investment is equally likely to have a 35% return or a - 20% return.The variance on the return for this investment is closest to:
A) .151
B) .0378
C) 0
D) .075
Consider the following probability distribution of returns for Alpha Corporation:
Suppose an investment is equally likely to have a 35% return or a - 20% return.The variance on the return for this investment is closest to:
A) .151
B) .0378
C) 0
D) .075
Question
Use the table for the question(s) below.
Consider the following realized annual returns: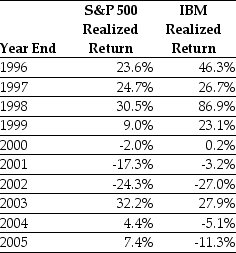
Suppose that you want to use the 10 year historical average return on IBM to forecast the expected future return on IBM.The standard error of your estimate of the expect return is closest to:
A) 16.4%
B) 3.32%
C) 3.15%
D) 33.20%
Consider the following realized annual returns:
Suppose that you want to use the 10 year historical average return on IBM to forecast the expected future return on IBM.The standard error of your estimate of the expect return is closest to:
A) 16.4%
B) 3.32%
C) 3.15%
D) 33.20%
Question
Question
Use the table for the question(s) below.
Consider the following realized annual returns:
The standard deviation of the returns on the S&P 500 from 1996 to 2005 is closest to:
A) 19.5%
B) 20.5%
C) 3.8%
D) 8.8%
Consider the following realized annual returns:
The standard deviation of the returns on the S&P 500 from 1996 to 2005 is closest to:
A) 19.5%
B) 20.5%
C) 3.8%
D) 8.8%
Question
Use the table for the question(s) below.
Consider the following Price and Dividend data for Ford Motor Company: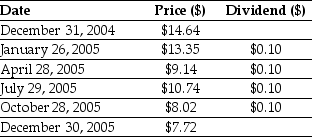
Assume that you purchased Ford Motor Company stock at the closing price on December 31,2004 and sold it after the dividend had been paid at the closing price on January 26,2005.Your dividend yield for this period is closest to:
A) -8.15%
B) 0.75%
C) 0.70%
D) -8.80%
Question
Use the table for the question(s) below.
Consider the following realized annual returns:
The variance of the returns on the S&P 500 from 1996 to 2005 is closest to:
A) .0450
B) .3400
C) .1935
D) .0375
Consider the following realized annual returns:
The variance of the returns on the S&P 500 from 1996 to 2005 is closest to:
A) .0450
B) .3400
C) .1935
D) .0375
Question
Use the table for the question(s) below.
Consider the following realized annual returns:
The average annual return on IBM from 1996 to 2005 is closest to:
A) 29.9%
B) 16.40%
C) 18.2%
D) 18.7%
Consider the following realized annual returns:
The average annual return on IBM from 1996 to 2005 is closest to:
A) 29.9%
B) 16.40%
C) 18.2%
D) 18.7%
Question
Question
Use the table for the question(s) below.
Consider the following realized annual returns:
The average annual return on the S&P 500 from 1996 to 2005 is closest to:
A) 7.10%
B) 4.00%
C) 9.75%
D) 8.75%
Consider the following realized annual returns:
The average annual return on the S&P 500 from 1996 to 2005 is closest to:
A) 7.10%
B) 4.00%
C) 9.75%
D) 8.75%
Question
Use the table for the question(s) below.
Consider the following Price and Dividend data for Ford Motor Company:
Assume that you purchased Ford Motor Company stock at the closing price on December 31,2004 and sold it after the dividend had been paid at the closing price on January 26,2005.Your total return rate (yield)for this period is closest to:
A) 0.75%
B) -8.80%
C) 0.70%
D) -8.15%
Question
Question
Use the table for the question(s) below.
Consider the following realized annual returns:
Suppose that you want to use the 10 year historical average return on the S&P 500 to forecast the expected future return on the S&P 500.The 95% confidence interval for your estimate of the expect return is closest to:
A) -10.6% to 28.2%
B) 6.8% to 10.7%
C) -37.0% to 47.6%
D) 4.9% to 12.7%
Question
Use the table for the question(s) below.
Consider the following Price and Dividend data for Ford Motor Company:
Assume that you purchased Ford Motor Company stock at the closing price on December 31,2004 and sold it at the closing price on December 30,2005.Your realized annual return for the year 2005 is closest to:
A) -45.1%
B) -44.5%
C) -48.5%
D) -47.3%
Question
Question
Use the table for the question(s) below.
Consider the following Price and Dividend data for Ford Motor Company:
Assume that you purchased Ford Motor Company stock at the closing price on December 31,2004 and sold it after the dividend had been paid at the closing price on January 26,2005.Your capital gains rate (yield)for this period is closest to:
A) 0.75%
B) 0.70%
C) -8.80%
D) -8.15%
Question
Question
Use the table for the question(s) below.
Consider the following realized annual returns:
The variance of the returns on IBM from 1996 to 2005 is closest to:
A) .3145
B) .0990
C) .1100
D) .9890
Consider the following realized annual returns:
The variance of the returns on IBM from 1996 to 2005 is closest to:
A) .3145
B) .0990
C) .1100
D) .9890
Question
Use the table for the question(s) below.
Consider the following realized annual returns:
Suppose that you want to use the 10 year historical average return on the S&P 500 to forecast the expected future return on the S&P 500.The standard error of your estimate of the expect return is closest to:
A) 19.4%
B) 3.8%
C) 8.8%
D) 1.95%
Consider the following realized annual returns:
Suppose that you want to use the 10 year historical average return on the S&P 500 to forecast the expected future return on the S&P 500.The standard error of your estimate of the expect return is closest to:
A) 19.4%
B) 3.8%
C) 8.8%
D) 1.95%
Question
Question
Use the table for the question(s) below.
Consider the following realized annual returns:
The standard deviation of the returns on IBM from 1996 to 2005 is closest to:
A) 33.2%
B) 16.4%
C) 31.5%
D) 11.0%
Consider the following realized annual returns:
The standard deviation of the returns on IBM from 1996 to 2005 is closest to:
A) 33.2%
B) 16.4%
C) 31.5%
D) 11.0%
Question
If a stock pays dividends at the end of each quarter,with realized returns of R1,R2,R3,and R4 each quarter,then the annual realized return is calculated as
A) Rannual =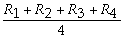
B) Rannual = (1 + R1)(1 + R2)(1 + R3)(1 + R4)
C) Rannual = (1 + R1)(1 + R2)(1 + R3)(1 + R4) - 1
D) Rannual = R1 + R2 + R3 + R4
A) Rannual =
B) Rannual = (1 + R1)(1 + R2)(1 + R3)(1 + R4)
C) Rannual = (1 + R1)(1 + R2)(1 + R3)(1 + R4) - 1
D) Rannual = R1 + R2 + R3 + R4
Question
Use the table for the question(s) below.
Consider the following realized annual returns:
The geometric average annual return on the S&P 500 from 1996 to 2005 is closest to:
A) 9.75%
B) 8.75%
C) 7.10%
D) 8.35%
Consider the following realized annual returns:
The geometric average annual return on the S&P 500 from 1996 to 2005 is closest to:
A) 9.75%
B) 8.75%
C) 7.10%
D) 8.35%
Question
Use the table for the question(s) below.
Consider the following realized annual returns: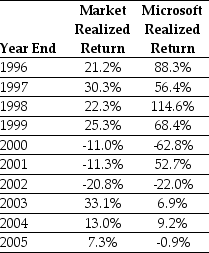
Suppose that you want to use the 10 year historical average return on the Market to forecast the expected future return on the S&P 500.Calculate the 95% confidence interval for your estimate of the expect return.
Consider the following realized annual returns:
Suppose that you want to use the 10 year historical average return on the Market to forecast the expected future return on the S&P 500.Calculate the 95% confidence interval for your estimate of the expect return.
Question
Use the table for the question(s) below.
Consider the following realized annual returns:
Suppose that you want to use the 10 year historical average return on Microsoft to forecast the expected future return on Microsoft.Calculate the 95% confidence interval for your estimate of the expect return.
Consider the following realized annual returns:
Suppose that you want to use the 10 year historical average return on Microsoft to forecast the expected future return on Microsoft.Calculate the 95% confidence interval for your estimate of the expect return.
Question
Question
Use the table for the question(s) below.
Consider the following realized annual returns:
The geometric average annual return on IBM from 1996 to 2005 is closest to:
A) 12.4%
B) 16.7%
C) 13.2%
D) 17.8%
Consider the following realized annual returns:
The geometric average annual return on IBM from 1996 to 2005 is closest to:
A) 12.4%
B) 16.7%
C) 13.2%
D) 17.8%
Question
Question
Question
Question
Use the table for the question(s) below.
Consider the following average annual returns: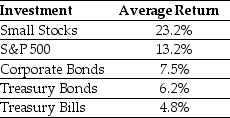
What is the excess return for Treasury Bills?
A) 0%
B) -8.4%
C) -2.7%
D) -1.4%
Consider the following average annual returns:
What is the excess return for Treasury Bills?
A) 0%
B) -8.4%
C) -2.7%
D) -1.4%
Question
Question
Use the table for the question(s) below.
Consider the following average annual returns:
What is the excess return for the S&P 500?
A) 5.7%
B) 7.0%
C) 0%
D) 8.4%
Consider the following average annual returns:
What is the excess return for the S&P 500?
A) 5.7%
B) 7.0%
C) 0%
D) 8.4%
Question
Use the table for the question(s) below.
Consider the following average annual returns:
Do expected returns for individual stocks increase proportionately with volatility?
Consider the following average annual returns:
Do expected returns for individual stocks increase proportionately with volatility?
Question
Use the table for the question(s) below.
Consider the following average annual returns:
What is the excess return for Corporate Bonds?
A) 2.7%
B) 1.3%
C) -5.7%
D) 0%
Consider the following average annual returns:
What is the excess return for Corporate Bonds?
A) 2.7%
B) 1.3%
C) -5.7%
D) 0%
Question
Use the table for the question(s) below.
Consider the following realized annual returns:
Using the data provided in the table,calculate the average annual return,the variance of the annual returns,and the standard deviation of the average returns for the market from 1996 to 2005.
Consider the following realized annual returns:
Using the data provided in the table,calculate the average annual return,the variance of the annual returns,and the standard deviation of the average returns for the market from 1996 to 2005.
Question
Use the table for the question(s) below.
Consider the following Price and Dividend data for General Motors: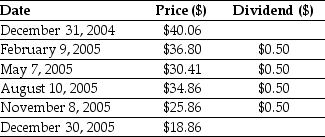
Assume that you purchased General Motors stock at the closing price on December 31,2004 and sold it at the closing price on December 30,2005.Calculate your realized annual return is for the year 2005.
Consider the following Price and Dividend data for General Motors:
Assume that you purchased General Motors stock at the closing price on December 31,2004 and sold it at the closing price on December 30,2005.Calculate your realized annual return is for the year 2005.
Question
Question
Question
Use the table for the question(s) below.
Consider the following realized annual returns:
Suppose that you want to use the 10 year historical average return on IBM to forecast the expected future return on IBM.The 95% confidence interval for your estimate of the expect return is closest to:
A) 13.2% to 19.5%
B) 10.1% to 22.7%
C) 6.5% to 26.3%
D) -15.1% to 47.8%
Question
Use the table for the question(s) below.
Consider the following realized annual returns:
Using the data provided in the table,calculate the average annual return,the variance of the annual returns,and the standard deviation of the average returns for Microsoft from 1996 to 2005.
Consider the following realized annual returns:
Using the data provided in the table,calculate the average annual return,the variance of the annual returns,and the standard deviation of the average returns for Microsoft from 1996 to 2005.
Question
Use the table for the question(s) below.
Consider the following average annual returns:
What is the excess return for the portfolio of small stocks?
A) 10.0%
B) 15.7%
C) 18.4%
D) 17.0%
Consider the following average annual returns:
What is the excess return for the portfolio of small stocks?
A) 10.0%
B) 15.7%
C) 18.4%
D) 17.0%
Question
Question
Question
Question
Question
Question
Question
Question
Question
Question
Question
Question
Question
Question
Question
Question
Question
Question
Question
Question

Unlock Deck
Sign up to unlock the cards in this deck!
Unlock Deck
Unlock Deck
1/98
Play
Full screen (f)
Deck 10: Capital Markets and the Pricing of Risk
1
Use the table for the question(s) below.
Consider the following probability distribution of returns for Alpha Corporation:
The standard deviation of the return on Alpha Corporation is closest to:
A) 22.4%
B) 19.0%
C) 21.8%
D) 19.4%
Consider the following probability distribution of returns for Alpha Corporation:
The standard deviation of the return on Alpha Corporation is closest to:
A) 22.4%
B) 19.0%
C) 21.8%
D) 19.4%
21.8%
2
Which of the following investments had the largest fluctuations in overall return over the past fifty years?
A) S&P/TSX Composite Index
B) S&P 500 index in Canadian dollars
C) Long-Term Government of Canada Bonds
D) Canadian Treasury Bills
A) S&P/TSX Composite Index
B) S&P 500 index in Canadian dollars
C) Long-Term Government of Canada Bonds
D) Canadian Treasury Bills
S&P/TSX Composite Index
3
Which of the following investments offered the highest overall return over the past fifty years?
A) Canadian Treasury Bills
B) S&P 500 index in Canadian dollars
C) S&P/TSX Composite Index
D) Long-Term Government of Canada Bonds
A) Canadian Treasury Bills
B) S&P 500 index in Canadian dollars
C) S&P/TSX Composite Index
D) Long-Term Government of Canada Bonds
S&P/TSX Composite Index
4
Which of the following equations is incorrect?
A) Var(R) =
B) SD(R) =
C) Var(R) = PR × (R - E[R])2
D) E[R] = PR × R
A) Var(R) =
B) SD(R) =
C) Var(R) =
PR × (R - E[R])2D) E[R] =
PR × R Unlock Deck
Unlock for access to all 98 flashcards in this deck.
Unlock Deck
k this deck
5
It is only those risks that ________ by holding a large portfolio that determine the ________ required by investors.
A) can be eliminated, risk premium
B) can't be eliminated, rate of return
C) can be eliminated, rate of return
D) can't be eliminated, risk premium
A) can be eliminated, risk premium
B) can't be eliminated, rate of return
C) can be eliminated, rate of return
D) can't be eliminated, risk premium
Unlock Deck
Unlock for access to all 98 flashcards in this deck.
Unlock Deck
k this deck
6
Which of the following investment opportunities provides highest variation in average annual return?
A) S&P/TSX Composite Index
B) S&P 500 Index in Canadian Dollars
C) Long-Term Government of Canada Bonds
D) Canadian Treasury Bills
A) S&P/TSX Composite Index
B) S&P 500 Index in Canadian Dollars
C) Long-Term Government of Canada Bonds
D) Canadian Treasury Bills
Unlock Deck
Unlock for access to all 98 flashcards in this deck.
Unlock Deck
k this deck
7
Which of the following statements is correct?
A) The return indicates the percentage increase in the value of an investment per dollar initially invested in the security.
B) The return indicates the average increase in the value of an investment per dollar initially invested in the security.
C) The return indicates the weighted average increase in the value of an investment per dollar initially invested in the security.
D) The return indicates the exponential increase in the value of an investment per dollar initially invested in the security.
Unlock Deck
Unlock for access to all 98 flashcards in this deck.
Unlock Deck
k this deck
8
The average capitalization of the firms in the S&P/TSX Composite Index is about
A) $5.5 billion.
B) $400 million.
C) $60 billion.
D) $25 billion.
A) $5.5 billion.
B) $400 million.
C) $60 billion.
D) $25 billion.
Unlock Deck
Unlock for access to all 98 flashcards in this deck.
Unlock Deck
k this deck
9
Use the table for the question(s) below.
Consider the following probability distribution of returns for Alpha Corporation:
The variance of the return on Alpha Corporation is closest to:
A) 5.00%
B) 4.75%
C) 3.625%
D) 3.75%
Consider the following probability distribution of returns for Alpha Corporation:
The variance of the return on Alpha Corporation is closest to:
A) 5.00%
B) 4.75%
C) 3.625%
D) 3.75%
Unlock Deck
Unlock for access to all 98 flashcards in this deck.
Unlock Deck
k this deck
10
The ________ average return on stocks as compensation to investors for the ________ risk they are taking.
A) higher, lower
B) higher, greater
C) lower, greater
D) lower, higher
A) higher, lower
B) higher, greater
C) lower, greater
D) lower, higher
Unlock Deck
Unlock for access to all 98 flashcards in this deck.
Unlock Deck
k this deck
11
Which of the following statements is false?
A) When an investment is risky, there are different returns it may earn.
B) In finance, the variance of a return is also referred to as its volatility.
C) The expected or mean return is calculated as a weighted average of the possible returns, where the weights correspond to the probabilities.
D) The variance is a measure of how "spread out" the distribution of the return is.
Unlock Deck
Unlock for access to all 98 flashcards in this deck.
Unlock Deck
k this deck
12
Which of the following statements is false?
A) The standard deviation is the square root of the variance.
B) Because investors dislike only negative resolutions of uncertainty, alternative measures that focus solely on downside risk have been developed, such as the semi-variance and the expected tail loss.
C) While the variance and the standard deviation are the most common measures of risk, they do not differentiate between upside and downside risk.
D) While the variance and the standard deviation both measure the variability of the returns, the variance is easier to interpret because it is in the same units as the returns themselves.
Unlock Deck
Unlock for access to all 98 flashcards in this deck.
Unlock Deck
k this deck
13
Which of the following statements is false?
A) The expected return is the return that actually occurs over a particular time period.
B) If you hold the stock beyond the date of the first dividend, then to compute your return you must specify how you invest any dividends you receive in the interim.
C) The average annual return of an investment during some historical period is simply the average of the realized returns for each year.
D) The realized return is the total return we earn from dividends and capital gains, expressed as a percentage of the initial stock price.
Unlock Deck
Unlock for access to all 98 flashcards in this deck.
Unlock Deck
k this deck
14
Use the table for the question(s) below.
Consider the following probability distribution of returns for Alpha Corporation:
The expected return for Alpha Corporation is closest to:
A) 6.67%
B) 5.00%
C) 10%
D) 0.00%
Consider the following probability distribution of returns for Alpha Corporation:
The expected return for Alpha Corporation is closest to:
A) 6.67%
B) 5.00%
C) 10%
D) 0.00%
Unlock Deck
Unlock for access to all 98 flashcards in this deck.
Unlock Deck
k this deck
15
In ________,in terms of realized return 3-month Canadian T-Bills performed better than both Barrick stock and the S&P/TSX Composite Index
A) 1998
B) 1999
C) 2002
D) 2007
A) 1998
B) 1999
C) 2002
D) 2007
Unlock Deck
Unlock for access to all 98 flashcards in this deck.
Unlock Deck
k this deck
16
Use the table for the question(s) below.
Consider the following probability distribution of returns for Alpha Corporation:
Suppose an investment is equally likely to have a 35% return or a -20% return.The standard deviation on the return for this investment is closest to:
A) 38.9%
B) 0%
C) 19.4%
D) 27.5%
Consider the following probability distribution of returns for Alpha Corporation:
Suppose an investment is equally likely to have a 35% return or a -20% return.The standard deviation on the return for this investment is closest to:
A) 38.9%
B) 0%
C) 19.4%
D) 27.5%
Unlock Deck
Unlock for access to all 98 flashcards in this deck.
Unlock Deck
k this deck
17
Which of the following statements is false?
A) The variance increases with the magnitude of the deviations from the mean.
B) The variance is the expected squared deviation from the mean.
C) Two common measures of the risk of a probability distribution are its variance and standard deviation.
D) If the return is riskless and never deviates from its mean, the variance is equal to one.
Unlock Deck
Unlock for access to all 98 flashcards in this deck.
Unlock Deck
k this deck
18
Use the table for the question(s) below.
Consider the following probability distribution of returns for Alpha Corporation:
Suppose an investment is equally likely to have a 35% return or a - 20% return.The expected return for this investment is closest to:
A) 7.5%
B) 15%
C) 5%
D) 10%
Consider the following probability distribution of returns for Alpha Corporation:
Suppose an investment is equally likely to have a 35% return or a - 20% return.The expected return for this investment is closest to:
A) 7.5%
B) 15%
C) 5%
D) 10%
Unlock Deck
Unlock for access to all 98 flashcards in this deck.
Unlock Deck
k this deck
19
Which of the following investments offered the lowest overall return over the past fifty years?
A) S&P/TSX Composite Index
B) Canadian Treasury Bills
C) S&P 500 index in Canadian dollars
D) Long-Term Government of Canada Bonds
A) S&P/TSX Composite Index
B) Canadian Treasury Bills
C) S&P 500 index in Canadian dollars
D) Long-Term Government of Canada Bonds
Unlock Deck
Unlock for access to all 98 flashcards in this deck.
Unlock Deck
k this deck
20
Use the table for the question(s) below.
Consider the following probability distribution of returns for Alpha Corporation:
Suppose an investment is equally likely to have a 35% return or a - 20% return.The variance on the return for this investment is closest to:
A) .151
B) .0378
C) 0
D) .075
Consider the following probability distribution of returns for Alpha Corporation:
Suppose an investment is equally likely to have a 35% return or a - 20% return.The variance on the return for this investment is closest to:
A) .151
B) .0378
C) 0
D) .075
Unlock Deck
Unlock for access to all 98 flashcards in this deck.
Unlock Deck
k this deck
21
Use the table for the question(s) below.
Consider the following realized annual returns:
Suppose that you want to use the 10 year historical average return on IBM to forecast the expected future return on IBM.The standard error of your estimate of the expect return is closest to:
A) 16.4%
B) 3.32%
C) 3.15%
D) 33.20%
Consider the following realized annual returns:
Suppose that you want to use the 10 year historical average return on IBM to forecast the expected future return on IBM.The standard error of your estimate of the expect return is closest to:
A) 16.4%
B) 3.32%
C) 3.15%
D) 33.20%
Unlock Deck
Unlock for access to all 98 flashcards in this deck.
Unlock Deck
k this deck
22
Which of the following investment opportunities provides lowest average annual return?
A) S&P/TSX Composite Index
B) S&P 500 Index in Canadian Dollars
C) Canadian Treasury Bills
D) Long-Term Government of Canada Bonds
A) S&P/TSX Composite Index
B) S&P 500 Index in Canadian Dollars
C) Canadian Treasury Bills
D) Long-Term Government of Canada Bonds
Unlock Deck
Unlock for access to all 98 flashcards in this deck.
Unlock Deck
k this deck
23
Use the table for the question(s) below.
Consider the following realized annual returns:
The standard deviation of the returns on the S&P 500 from 1996 to 2005 is closest to:
A) 19.5%
B) 20.5%
C) 3.8%
D) 8.8%
Consider the following realized annual returns:
The standard deviation of the returns on the S&P 500 from 1996 to 2005 is closest to:
A) 19.5%
B) 20.5%
C) 3.8%
D) 8.8%
Unlock Deck
Unlock for access to all 98 flashcards in this deck.
Unlock Deck
k this deck
24
Use the table for the question(s) below.
Consider the following Price and Dividend data for Ford Motor Company:
Assume that you purchased Ford Motor Company stock at the closing price on December 31,2004 and sold it after the dividend had been paid at the closing price on January 26,2005.Your dividend yield for this period is closest to:
A) -8.15%
B) 0.75%
C) 0.70%
D) -8.80%
Unlock Deck
Unlock for access to all 98 flashcards in this deck.
Unlock Deck
k this deck
25
Use the table for the question(s) below.
Consider the following realized annual returns:
The variance of the returns on the S&P 500 from 1996 to 2005 is closest to:
A) .0450
B) .3400
C) .1935
D) .0375
Consider the following realized annual returns:
The variance of the returns on the S&P 500 from 1996 to 2005 is closest to:
A) .0450
B) .3400
C) .1935
D) .0375
Unlock Deck
Unlock for access to all 98 flashcards in this deck.
Unlock Deck
k this deck
26
Use the table for the question(s) below.
Consider the following realized annual returns:
The average annual return on IBM from 1996 to 2005 is closest to:
A) 29.9%
B) 16.40%
C) 18.2%
D) 18.7%
Consider the following realized annual returns:
The average annual return on IBM from 1996 to 2005 is closest to:
A) 29.9%
B) 16.40%
C) 18.2%
D) 18.7%
Unlock Deck
Unlock for access to all 98 flashcards in this deck.
Unlock Deck
k this deck
27
Which of the following investment opportunities provides highest average annual return?
A) S&P 500 Index in Canadian Dollars
B) S&P/TSX Composite Index
C) Long-Term Government of Canada Bonds
D) Canadian Treasury Bills
A) S&P 500 Index in Canadian Dollars
B) S&P/TSX Composite Index
C) Long-Term Government of Canada Bonds
D) Canadian Treasury Bills
Unlock Deck
Unlock for access to all 98 flashcards in this deck.
Unlock Deck
k this deck
28
Use the table for the question(s) below.
Consider the following realized annual returns:
The average annual return on the S&P 500 from 1996 to 2005 is closest to:
A) 7.10%
B) 4.00%
C) 9.75%
D) 8.75%
Consider the following realized annual returns:
The average annual return on the S&P 500 from 1996 to 2005 is closest to:
A) 7.10%
B) 4.00%
C) 9.75%
D) 8.75%
Unlock Deck
Unlock for access to all 98 flashcards in this deck.
Unlock Deck
k this deck
29
Use the table for the question(s) below.
Consider the following Price and Dividend data for Ford Motor Company:
Assume that you purchased Ford Motor Company stock at the closing price on December 31,2004 and sold it after the dividend had been paid at the closing price on January 26,2005.Your total return rate (yield)for this period is closest to:
A) 0.75%
B) -8.80%
C) 0.70%
D) -8.15%
Unlock Deck
Unlock for access to all 98 flashcards in this deck.
Unlock Deck
k this deck
30
Which of the following statements is false?
A) The standard error provides an indication of how far the sample average might deviate from the expected return.
B) The 95% confidence interval for the expected return is defined as the Historical Average Return plus or minus three standard errors.
C) We can use a security's historical average return to estimate its actual expected return.
D) The standard error is the standard deviation of the average return.
Unlock Deck
Unlock for access to all 98 flashcards in this deck.
Unlock Deck
k this deck
31
Use the table for the question(s) below.
Consider the following realized annual returns:
Suppose that you want to use the 10 year historical average return on the S&P 500 to forecast the expected future return on the S&P 500.The 95% confidence interval for your estimate of the expect return is closest to:
A) -10.6% to 28.2%
B) 6.8% to 10.7%
C) -37.0% to 47.6%
D) 4.9% to 12.7%
Unlock Deck
Unlock for access to all 98 flashcards in this deck.
Unlock Deck
k this deck
32
Use the table for the question(s) below.
Consider the following Price and Dividend data for Ford Motor Company:
Assume that you purchased Ford Motor Company stock at the closing price on December 31,2004 and sold it at the closing price on December 30,2005.Your realized annual return for the year 2005 is closest to:
A) -45.1%
B) -44.5%
C) -48.5%
D) -47.3%
Unlock Deck
Unlock for access to all 98 flashcards in this deck.
Unlock Deck
k this deck
33
Which of the following statements is false?
A) We measure the degree of estimation error statistically through the standard error of the estimate.
B) When focusing on the returns of a single security, it is common practice to assume that all dividends are immediately invested at the risk-free rate.
C) We estimate the standard deviation or volatility as the square root of the variance.
D) We estimate the variance by computing the average squared deviation from the average realized return.
Unlock Deck
Unlock for access to all 98 flashcards in this deck.
Unlock Deck
k this deck
34
Use the table for the question(s) below.
Consider the following Price and Dividend data for Ford Motor Company:
Assume that you purchased Ford Motor Company stock at the closing price on December 31,2004 and sold it after the dividend had been paid at the closing price on January 26,2005.Your capital gains rate (yield)for this period is closest to:
A) 0.75%
B) 0.70%
C) -8.80%
D) -8.15%
Unlock Deck
Unlock for access to all 98 flashcards in this deck.
Unlock Deck
k this deck
35
Which of the following statements is false?
A) The compounded geometric average return is most often used for comparative purposes.
B) We should use the arithmetic average return when we are trying to estimate an investment's expected return over a future horizon based on its past performance.
C) The geometric average return will always be above the arithmetic average return and the difference grows with the volatility of the annual returns.
D) The geometric average return is a better description of the long-run historical performance of an investment.
Unlock Deck
Unlock for access to all 98 flashcards in this deck.
Unlock Deck
k this deck
36
Use the table for the question(s) below.
Consider the following realized annual returns:
The variance of the returns on IBM from 1996 to 2005 is closest to:
A) .3145
B) .0990
C) .1100
D) .9890
Consider the following realized annual returns:
The variance of the returns on IBM from 1996 to 2005 is closest to:
A) .3145
B) .0990
C) .1100
D) .9890
Unlock Deck
Unlock for access to all 98 flashcards in this deck.
Unlock Deck
k this deck
37
Use the table for the question(s) below.
Consider the following realized annual returns:
Suppose that you want to use the 10 year historical average return on the S&P 500 to forecast the expected future return on the S&P 500.The standard error of your estimate of the expect return is closest to:
A) 19.4%
B) 3.8%
C) 8.8%
D) 1.95%
Consider the following realized annual returns:
Suppose that you want to use the 10 year historical average return on the S&P 500 to forecast the expected future return on the S&P 500.The standard error of your estimate of the expect return is closest to:
A) 19.4%
B) 3.8%
C) 8.8%
D) 1.95%
Unlock Deck
Unlock for access to all 98 flashcards in this deck.
Unlock Deck
k this deck
38
Which of the following investment opportunities provides lowest variation in average annual return?
A) S&P/TSX Composite Index
B) S&P 500 Index in Canadian Dollars
C) Long-Term Government of Canada Bonds
D) Canadian Treasury Bills
A) S&P/TSX Composite Index
B) S&P 500 Index in Canadian Dollars
C) Long-Term Government of Canada Bonds
D) Canadian Treasury Bills
Unlock Deck
Unlock for access to all 98 flashcards in this deck.
Unlock Deck
k this deck
39
Use the table for the question(s) below.
Consider the following realized annual returns:
The standard deviation of the returns on IBM from 1996 to 2005 is closest to:
A) 33.2%
B) 16.4%
C) 31.5%
D) 11.0%
Consider the following realized annual returns:
The standard deviation of the returns on IBM from 1996 to 2005 is closest to:
A) 33.2%
B) 16.4%
C) 31.5%
D) 11.0%
Unlock Deck
Unlock for access to all 98 flashcards in this deck.
Unlock Deck
k this deck
40
If a stock pays dividends at the end of each quarter,with realized returns of R1,R2,R3,and R4 each quarter,then the annual realized return is calculated as
A) Rannual =
B) Rannual = (1 + R1)(1 + R2)(1 + R3)(1 + R4)
C) Rannual = (1 + R1)(1 + R2)(1 + R3)(1 + R4) - 1
D) Rannual = R1 + R2 + R3 + R4
A) Rannual =
B) Rannual = (1 + R1)(1 + R2)(1 + R3)(1 + R4)
C) Rannual = (1 + R1)(1 + R2)(1 + R3)(1 + R4) - 1
D) Rannual = R1 + R2 + R3 + R4
Unlock Deck
Unlock for access to all 98 flashcards in this deck.
Unlock Deck
k this deck
41
Use the table for the question(s) below.
Consider the following realized annual returns:
The geometric average annual return on the S&P 500 from 1996 to 2005 is closest to:
A) 9.75%
B) 8.75%
C) 7.10%
D) 8.35%
Consider the following realized annual returns:
The geometric average annual return on the S&P 500 from 1996 to 2005 is closest to:
A) 9.75%
B) 8.75%
C) 7.10%
D) 8.35%
Unlock Deck
Unlock for access to all 98 flashcards in this deck.
Unlock Deck
k this deck
42
Use the table for the question(s) below.
Consider the following realized annual returns:
Suppose that you want to use the 10 year historical average return on the Market to forecast the expected future return on the S&P 500.Calculate the 95% confidence interval for your estimate of the expect return.
Consider the following realized annual returns:
Suppose that you want to use the 10 year historical average return on the Market to forecast the expected future return on the S&P 500.Calculate the 95% confidence interval for your estimate of the expect return.
Unlock Deck
Unlock for access to all 98 flashcards in this deck.
Unlock Deck
k this deck
43
Use the table for the question(s) below.
Consider the following realized annual returns:
Suppose that you want to use the 10 year historical average return on Microsoft to forecast the expected future return on Microsoft.Calculate the 95% confidence interval for your estimate of the expect return.
Consider the following realized annual returns:
Suppose that you want to use the 10 year historical average return on Microsoft to forecast the expected future return on Microsoft.Calculate the 95% confidence interval for your estimate of the expect return.
Unlock Deck
Unlock for access to all 98 flashcards in this deck.
Unlock Deck
k this deck
44
Independent risk is also called
A) undiversifiable risk.
B) systematic risk.
C) uncorrelated risk.
D) autocorrelated risk.
A) undiversifiable risk.
B) systematic risk.
C) uncorrelated risk.
D) autocorrelated risk.
Unlock Deck
Unlock for access to all 98 flashcards in this deck.
Unlock Deck
k this deck
45
Use the table for the question(s) below.
Consider the following realized annual returns:
The geometric average annual return on IBM from 1996 to 2005 is closest to:
A) 12.4%
B) 16.7%
C) 13.2%
D) 17.8%
Consider the following realized annual returns:
The geometric average annual return on IBM from 1996 to 2005 is closest to:
A) 12.4%
B) 16.7%
C) 13.2%
D) 17.8%
Unlock Deck
Unlock for access to all 98 flashcards in this deck.
Unlock Deck
k this deck
46
Which of the following statements is false?
A) Investments with higher volatility have rewarded investors with higher average returns.
B) Investments with higher volatility should have a higher risk premium and therefore higher returns.
C) Volatility seems to be a reasonable measure of risk when evaluating returns on large portfolios and the returns of individual securities.
D) Riskier investments must offer investors higher average returns to compensate them for the extra risk they are taking on.
Unlock Deck
Unlock for access to all 98 flashcards in this deck.
Unlock Deck
k this deck
47
Use the information for the question(s) below.
Big Cure and Little Cure are both pharmaceutical companies. Big Cure presently has a potential "blockbuster" drug before the Food and Drug Administration (FDA) waiting for approval. If approved, Big Cure's blockbuster drug will produce $1 billion in net income for Big Cure. Little Cure has 10 separate less important drugs before the FDA waiting for approval. If approved, each of Little Cure's drugs would produce $100 million in net income for Little Cure. The probability of the FDA approving a drug is 50%.
What is the expected payoff for Big Cure's blockbuster drug?
A) $100 million
B) $0
C) $1 billion
D) $500 million
Unlock Deck
Unlock for access to all 98 flashcards in this deck.
Unlock Deck
k this deck
48
The excess return is the difference between the average return on a security and the average return for
A) Treasury Bonds.
B) a portfolio of securities with similar risk.
C) a broad based market portfolio like the S&P/TSX Composite Index.
D) Treasury Bills.
A) Treasury Bonds.
B) a portfolio of securities with similar risk.
C) a broad based market portfolio like the S&P/TSX Composite Index.
D) Treasury Bills.
Unlock Deck
Unlock for access to all 98 flashcards in this deck.
Unlock Deck
k this deck
49
Use the table for the question(s) below.
Consider the following average annual returns:
What is the excess return for Treasury Bills?
A) 0%
B) -8.4%
C) -2.7%
D) -1.4%
Consider the following average annual returns:
What is the excess return for Treasury Bills?
A) 0%
B) -8.4%
C) -2.7%
D) -1.4%
Unlock Deck
Unlock for access to all 98 flashcards in this deck.
Unlock Deck
k this deck
50
Common risk is also called
A) diversifiable risk.
B) correlated risk.
C) uncorrelated risk.
D) independent risk.
A) diversifiable risk.
B) correlated risk.
C) uncorrelated risk.
D) independent risk.
Unlock Deck
Unlock for access to all 98 flashcards in this deck.
Unlock Deck
k this deck
51
Use the table for the question(s) below.
Consider the following average annual returns:
What is the excess return for the S&P 500?
A) 5.7%
B) 7.0%
C) 0%
D) 8.4%
Consider the following average annual returns:
What is the excess return for the S&P 500?
A) 5.7%
B) 7.0%
C) 0%
D) 8.4%
Unlock Deck
Unlock for access to all 98 flashcards in this deck.
Unlock Deck
k this deck
52
Use the table for the question(s) below.
Consider the following average annual returns:
Do expected returns for individual stocks increase proportionately with volatility?
Consider the following average annual returns:
Do expected returns for individual stocks increase proportionately with volatility?
Unlock Deck
Unlock for access to all 98 flashcards in this deck.
Unlock Deck
k this deck
53
Use the table for the question(s) below.
Consider the following average annual returns:
What is the excess return for Corporate Bonds?
A) 2.7%
B) 1.3%
C) -5.7%
D) 0%
Consider the following average annual returns:
What is the excess return for Corporate Bonds?
A) 2.7%
B) 1.3%
C) -5.7%
D) 0%
Unlock Deck
Unlock for access to all 98 flashcards in this deck.
Unlock Deck
k this deck
54
Use the table for the question(s) below.
Consider the following realized annual returns:
Using the data provided in the table,calculate the average annual return,the variance of the annual returns,and the standard deviation of the average returns for the market from 1996 to 2005.
Consider the following realized annual returns:
Using the data provided in the table,calculate the average annual return,the variance of the annual returns,and the standard deviation of the average returns for the market from 1996 to 2005.
Unlock Deck
Unlock for access to all 98 flashcards in this deck.
Unlock Deck
k this deck
55
Use the table for the question(s) below.
Consider the following Price and Dividend data for General Motors:
Assume that you purchased General Motors stock at the closing price on December 31,2004 and sold it at the closing price on December 30,2005.Calculate your realized annual return is for the year 2005.
Consider the following Price and Dividend data for General Motors:
Assume that you purchased General Motors stock at the closing price on December 31,2004 and sold it at the closing price on December 30,2005.Calculate your realized annual return is for the year 2005.
Unlock Deck
Unlock for access to all 98 flashcards in this deck.
Unlock Deck
k this deck
56
From historical data,it has been evident in investment that the average annual return has ________ relationship with the volatility.
A) a positive
B) a negative
C) no
D) None of the above
A) a positive
B) a negative
C) no
D) None of the above
Unlock Deck
Unlock for access to all 98 flashcards in this deck.
Unlock Deck
k this deck
57
Which of the following statements is false?
A) Expected return should rise proportionately with volatility.
B) Investors would not choose to hold a portfolio that is more volatile unless they expected to earn a higher return.
C) Smaller stocks have lower volatility than larger stocks.
D) The largest stocks are typically more volatile than a portfolio of large stocks.
Unlock Deck
Unlock for access to all 98 flashcards in this deck.
Unlock Deck
k this deck
58
Use the table for the question(s) below.
Consider the following realized annual returns:
Suppose that you want to use the 10 year historical average return on IBM to forecast the expected future return on IBM.The 95% confidence interval for your estimate of the expect return is closest to:
A) 13.2% to 19.5%
B) 10.1% to 22.7%
C) 6.5% to 26.3%
D) -15.1% to 47.8%
Unlock Deck
Unlock for access to all 98 flashcards in this deck.
Unlock Deck
k this deck
59
Use the table for the question(s) below.
Consider the following realized annual returns:
Using the data provided in the table,calculate the average annual return,the variance of the annual returns,and the standard deviation of the average returns for Microsoft from 1996 to 2005.
Consider the following realized annual returns:
Using the data provided in the table,calculate the average annual return,the variance of the annual returns,and the standard deviation of the average returns for Microsoft from 1996 to 2005.
Unlock Deck
Unlock for access to all 98 flashcards in this deck.
Unlock Deck
k this deck
60
Use the table for the question(s) below.
Consider the following average annual returns:
What is the excess return for the portfolio of small stocks?
A) 10.0%
B) 15.7%
C) 18.4%
D) 17.0%
Consider the following average annual returns:
What is the excess return for the portfolio of small stocks?
A) 10.0%
B) 15.7%
C) 18.4%
D) 17.0%
Unlock Deck
Unlock for access to all 98 flashcards in this deck.
Unlock Deck
k this deck
61
Independent risk is also called
A) market risk.
B) systematic risk.
C) undiversifiable risk.
D) idiosyncratic risk.
A) market risk.
B) systematic risk.
C) undiversifiable risk.
D) idiosyncratic risk.
Unlock Deck
Unlock for access to all 98 flashcards in this deck.
Unlock Deck
k this deck
62
Use the information for the question(s) below.
Big Cure and Little Cure are both pharmaceutical companies. Big Cure presently has a potential "blockbuster" drug before the Food and Drug Administration (FDA) waiting for approval. If approved, Big Cure's blockbuster drug will produce $1 billion in net income for Big Cure. Little Cure has 10 separate less important drugs before the FDA waiting for approval. If approved, each of Little Cure's drugs would produce $100 million in net income for Little Cure. The probability of the FDA approving a drug is 50%.
What is the standard deviation of Big Cure's average net income for their new blockbuster drug?
A) $0
B) $1 billion
C) $100 million
D) $500 million
Unlock Deck
Unlock for access to all 98 flashcards in this deck.
Unlock Deck
k this deck
63
Which of the following types of risk doesn't belong?
A) Idiosyncratic risk
B) Undiversifiable risk
C) Market risk
D) Systematic risk
A) Idiosyncratic risk
B) Undiversifiable risk
C) Market risk
D) Systematic risk
Unlock Deck
Unlock for access to all 98 flashcards in this deck.
Unlock Deck
k this deck
64
Use the information for the question(s) below.
Big Cure and Little Cure are both pharmaceutical companies. Big Cure presently has a potential "blockbuster" drug before the Food and Drug Administration (FDA) waiting for approval. If approved, Big Cure's blockbuster drug will produce $1 billion in net income for Big Cure. Little Cure has 10 separate less important drugs before the FDA waiting for approval. If approved, each of Little Cure's drugs would produce $100 million in net income for Little Cure. The probability of the FDA approving a drug is 50%.
The standard deviation of Little Cure's average net income for their ten new drugs is closest to:
A) $50 million
B) $25 million
C) $16 million
D) $500 million
Unlock Deck
Unlock for access to all 98 flashcards in this deck.
Unlock Deck
k this deck
65
Use the information for the question(s) below.
Big Cure and Little Cure are both pharmaceutical companies. Big Cure presently has a potential "blockbuster" drug before the Food and Drug Administration (FDA) waiting for approval. If approved, Big Cure's blockbuster drug will produce $1 billion in net income for Big Cure. Little Cure has 10 separate less important drugs before the FDA waiting for approval. If approved, each of Little Cure's drugs would produce $100 million in net income for Little Cure. The probability of the FDA approving a drug is 50%.
What is the expected payoff for Little Cure's ten drugs?
A) $500 million
B) $100 million
C) $1 billion
D) $0
Unlock Deck
Unlock for access to all 98 flashcards in this deck.
Unlock Deck
k this deck
66
Use the information for the question(s) below.
Consider an economy with two types of firms, S and I. S firms always move together, but I firms move independently of each other. For both types of firms there is a 70% probability that the firm will have a 20% return and a 30% probability that the firm will have a -30% return.
What is the expected return for an individual firm?
A) 14%
B) 3%
C) 5%
D) -5%
Unlock Deck
Unlock for access to all 98 flashcards in this deck.
Unlock Deck
k this deck
67
Which of the following statements is false?
A) Fluctuations of a stock's returns that are due to firm-specific news are common risks.
B) The volatility in a large portfolio will decline until only the systematic risk remains.
C) When we combine many stocks in a large portfolio, the firm-specific risks for each stock will average out and be diversified.
D) The risk premium of a security is determined by its systematic risk and does not depend on its diversifiable risk.
Unlock Deck
Unlock for access to all 98 flashcards in this deck.
Unlock Deck
k this deck
68
Use the information for the question(s) below.
Consider an economy with two types of firms, S and I. S firms always move together, but I firms move independently of each other. For both types of firms there is a 70% probability that the firm will have a 20% return and a 30% probability that the firm will have a -30% return.
The standard deviation for the return on an portfolio of 20 type I firms is closest to:
A) 5.25%
B) 5.10%
C) 15.0%
D) 23.0%
Unlock Deck
Unlock for access to all 98 flashcards in this deck.
Unlock Deck
k this deck
69
Which of the following types of risk doesn't belong?
A) Market risk
B) Unique risk
C) Idiosyncratic risk
D) Unsystematic risk
A) Market risk
B) Unique risk
C) Idiosyncratic risk
D) Unsystematic risk
Unlock Deck
Unlock for access to all 98 flashcards in this deck.
Unlock Deck
k this deck
70
Use the information for the question(s) below.
Big Cure and Little Cure are both pharmaceutical companies. Big Cure presently has a potential "blockbuster" drug before the Food and Drug Administration (FDA) waiting for approval. If approved, Big Cure's blockbuster drug will produce $1 billion in net income for Big Cure. Little Cure has 10 separate less important drugs before the FDA waiting for approval. If approved, each of Little Cure's drugs would produce $100 million in net income for Little Cure. The probability of the FDA approving a drug is 50%.
Which pharmaceutical company faces less risk?
Unlock Deck
Unlock for access to all 98 flashcards in this deck.
Unlock Deck
k this deck
71
The beta is the expected percent change in the excess return of a security for a 1% change in the ________ of the market portfolio.
A) average return
B) annual return
C) weighted return
D) excess return
A) average return
B) annual return
C) weighted return
D) excess return
Unlock Deck
Unlock for access to all 98 flashcards in this deck.
Unlock Deck
k this deck
72
Use the information for the question(s) below.
Consider an economy with two types of firms, S and I. S firms always move together, but I firms move independently of each other. For both types of firms there is a 70% probability that the firm will have a 20% return and a 30% probability that the firm will have a -30% return.
The standard deviation for the return on an individual firm is closest to:
A) 23.0%
B) 5.25%
C) 15.0%
D) 10.0%
Unlock Deck
Unlock for access to all 98 flashcards in this deck.
Unlock Deck
k this deck
73
Use the information for the question(s) below.
Big Cure and Little Cure are both pharmaceutical companies. Big Cure presently has a potential "blockbuster" drug before the Food and Drug Administration (FDA) waiting for approval. If approved, Big Cure's blockbuster drug will produce $1 billion in net income for Big Cure. Little Cure has 10 separate less important drugs before the FDA waiting for approval. If approved, each of Little Cure's drugs would produce $100 million in net income for Little Cure. The probability of the FDA approving a drug is 50%.
What is the difference between common risk and independent risk?
Unlock Deck
Unlock for access to all 98 flashcards in this deck.
Unlock Deck
k this deck
74
Use the information for the question(s) below.
Consider an economy with two types of firms, S and I. S firms always move together, but I firms move independently of each other. For both types of firms there is a 70% probability that the firm will have a 20% return and a 30% probability that the firm will have a -30% return.
The standard deviation for the return on an portfolio of 20 type S firms is closest to:
A) 5.10%
B) 23.0%
C) 15.0%
D) 5.25%
Unlock Deck
Unlock for access to all 98 flashcards in this deck.
Unlock Deck
k this deck
75
Which of the following is NOT a systematic risk?
A) The risk that oil prices rise, increasing production costs
B) The risk that the Bank of Canada raises interest rates
C) The risk that the economy slows, reducing demand for your firm's products
D) The risk that your new product will not receive regulatory approval
A) The risk that oil prices rise, increasing production costs
B) The risk that the Bank of Canada raises interest rates
C) The risk that the economy slows, reducing demand for your firm's products
D) The risk that your new product will not receive regulatory approval
Unlock Deck
Unlock for access to all 98 flashcards in this deck.
Unlock Deck
k this deck
76
Which of the following statements is false?
A) Because investors are risk averse, they will demand a risk premium to hold unsystematic risk.
B) Over any given period, the risk of holding a stock is that the dividends plus the final stock price will be higher or lower than expected, which makes the realized return risky.
C) The risk premium for diversifiable risk is zero, so investors are not compensated for holding firm-specific risk.
D) Because investors can eliminate firm-specific risk "for free" by diversifying their portfolios, they will not require a reward or risk premium for holding it.
Unlock Deck
Unlock for access to all 98 flashcards in this deck.
Unlock Deck
k this deck
77
Common risk is also called
A) firm-specific risk.
B) unsystematic risk.
C) undiversifiable risk.
D) idiosyncratic risk.
A) firm-specific risk.
B) unsystematic risk.
C) undiversifiable risk.
D) idiosyncratic risk.
Unlock Deck
Unlock for access to all 98 flashcards in this deck.
Unlock Deck
k this deck
78
Which of the following statements is false?
A) Firm-specific news is good or bad news about the company itself.
B) Firms are affected by both systematic and firm-specific risk.
C) When firms carry both types of risk, only the firm-specific risk will be diversified when we combine many firms' stocks into a portfolio.
D) The risk premium for a stock is affected by its idiosyncratic risk.
Unlock Deck
Unlock for access to all 98 flashcards in this deck.
Unlock Deck
k this deck
79
Which of the following is NOT a diversifiable risk?
A) The risk that oil prices rise, increasing production costs
B) The risk of a product liability lawsuit
C) The risk that the CEO is killed in a plane crash
D) The risk of a key employee being hired away by a competitor
A) The risk that oil prices rise, increasing production costs
B) The risk of a product liability lawsuit
C) The risk that the CEO is killed in a plane crash
D) The risk of a key employee being hired away by a competitor
Unlock Deck
Unlock for access to all 98 flashcards in this deck.
Unlock Deck
k this deck
80
The key step to measuring systematic risk is finding a portfolio that contains only ________ risk.
A) market
B) idiosyncratic
C) unique
D) diversifiable
A) market
B) idiosyncratic
C) unique
D) diversifiable
Unlock Deck
Unlock for access to all 98 flashcards in this deck.
Unlock Deck
k this deck
Unlock Deck
Unlock for access to all 98 flashcards in this deck.


