Deck 11: Hypothesis Tests Involving Two Sample Means
Full screen (f)
Question
Question
Question
Question
Question
Question
Question
Question
Question
Question
Question
Question
Question
Question
Question
Question
Question
Question
Question
Question
Question
Question
Question
Question
NARRBEGIN: Chrysler corp
Chrysler Corp.is responding to an advertisement by Toyota,which claims that its compact version gets much better gasoline mileage for in-city driving than any U.S.made car.Below are the results of surveys conducted to test the claim.Perform the appropriate test at the 0.01 significance level.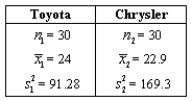
What is the p-value?
Question
NARRBEGIN: Realtor
A new realtor in a large community is attempting to determine differences in the selling prices of houses in two sections of the community.Population 1 is the Northeast and Population 2 is the Southwest.The realtor is going to perform the hypothesis test: H0: H1:
H1:  A random sample of 35 sale homes is taken from the Northeast and 41 from those in the Southwest using the multiple listing services.A Minitab summary of the results of the two samples expressed in thousands follows:
What is the standard error of the difference between the two means?
A new realtor in a large community is attempting to determine differences in the selling prices of houses in two sections of the community.Population 1 is the Northeast and Population 2 is the Southwest.The realtor is going to perform the hypothesis test: H0:
H1: A random sample of 35 sale homes is taken from the Northeast and 41 from those in the Southwest using the multiple listing services.A Minitab summary of the results of the two samples expressed in thousands follows: What is the standard error of the difference between the two means?
Question
NARRBEGIN: Price earnings
A comparison of the price-earnings (P/E)ratio for the top and bottom 100 companies in valuation is being prepared.A financial advisor randomly sampled each group to determine whether there is any difference in P/E ratios of the two groups of companies.Let 1 = a top 100 company and 2 = a bottom 100 company.Assume equal population variances and that the populations are normally distributed.The advisor is to use a 0.01 significance level.The data were randomly selected and are summarized below: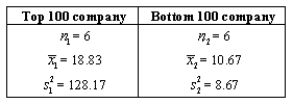
Calculate the standard error of the estimate.
Question
Question
Question
Question
Question
Assume two normally distributed populations with equal population standard deviations.A random sample is taken from each population.Determine the standard error of the estimate for the following situation: 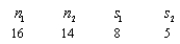
Question
NARRBEGIN: Traffic Coordinator
A traffic coordinator for a community wishes to determine whether or not there is any difference in the average age of female and male drivers involved in rear-end accidents.The hypothesis test is: H0: (no difference in mean age)
H1: (mean age is different)A random sample of males and females involved in rear-end accidents results in the following Minitab summary:
What is the standard error of the difference between the two means?
A traffic coordinator for a community wishes to determine whether or not there is any difference in the average age of female and male drivers involved in rear-end accidents.The hypothesis test is: H0:
(no difference in mean age)H1:
(mean age is different)A random sample of males and females involved in rear-end accidents results in the following Minitab summary: What is the standard error of the difference between the two means?
Question
Question
Question
NARRBEGIN: Women drivers
In the past,young women drivers have maintained a better driving record than young men drivers.An insurance company is concerned with the driving record of its insured customers.Specifically,it conducts a test for the number of speeding tickets received during the past year by drivers between the ages of 18 and 25.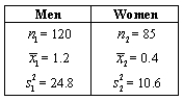
A test for the equality of average number of tickets per driver for the two groups is desired.Use = 0.01.Calculate the p-value for this test.
In the past,young women drivers have maintained a better driving record than young men drivers.An insurance company is concerned with the driving record of its insured customers.Specifically,it conducts a test for the number of speeding tickets received during the past year by drivers between the ages of 18 and 25.
A test for the equality of average number of tickets per driver for the two groups is desired.Use
= 0.01.Calculate the p-value for this test. Question
Question
Question
NARRBEGIN: Realtor
A new realtor in a large community is attempting to determine differences in the selling prices of houses in two sections of the community.Population 1 is the Northeast and Population 2 is the Southwest.The realtor is going to perform the hypothesis test: H0: H1: A random sample of 35 sale homes is taken from the Northeast and 41 from those in the Southwest using the multiple listing services.A Minitab summary of the results of the two samples expressed in thousands follows:
What is the value of the test statistic?
z = ____________________
A new realtor in a large community is attempting to determine differences in the selling prices of houses in two sections of the community.Population 1 is the Northeast and Population 2 is the Southwest.The realtor is going to perform the hypothesis test: H0:
H1: A random sample of 35 sale homes is taken from the Northeast and 41 from those in the Southwest using the multiple listing services.A Minitab summary of the results of the two samples expressed in thousands follows: What is the value of the test statistic?
z = ____________________
Question
Question
Question
Question
NARRBEGIN: Price earnings
A comparison of the price-earnings (P/E)ratio for the top and bottom 100 companies in valuation is being prepared.A financial advisor randomly sampled each group to determine whether there is any difference in P/E ratios of the two groups of companies.Let 1 = a top 100 company and 2 = a bottom 100 company.Assume equal population variances and that the populations are normally distributed.The advisor is to use a 0.01 significance level.The data were randomly selected and are summarized below:
What is the conclusion?
Question
NARRBEGIN: Price earnings
A comparison of the price-earnings (P/E)ratio for the top and bottom 100 companies in valuation is being prepared.A financial advisor randomly sampled each group to determine whether there is any difference in P/E ratios of the two groups of companies.Let 1 = a top 100 company and 2 = a bottom 100 company.Assume equal population variances and that the populations are normally distributed.The advisor is to use a 0.01 significance level.The data were randomly selected and are summarized below:
What is the decision rule?
Question
Question
Question
The ____________________ approximation is an alternative to the unequal-variances t-test whenever both n1 and n2 are  30.
30.
30. Question
NARRBEGIN: Production Line
A quality control inspector keeps a tally sheet of the number of acceptable and unacceptable products that come off two different production lines.The completed sheet is shown below.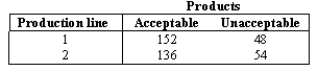
What is the p-value of the test?
A quality control inspector keeps a tally sheet of the number of acceptable and unacceptable products that come off two different production lines.The completed sheet is shown below.
What is the p-value of the test?
Question
Question
Question
NARRBEGIN: Automotive parts
A regional automotive parts chain store firm wants to improve the sales of tune-up supplies.It believes that a TV ad with a popular local,but offbeat,know-it-all actor might be able to affect their sales.Before the ads are run on TV,the company randomly samples eight of its weekly sales from past years.Following the ad campaign,eight weeks of sales were sampled.Weekly sales are approximately normally distributed and the population standard deviations are equal.Their hypothesis test is: Did the TV ad campaign help or hurt sales? To answer this question,the company plans to use a 0.05 significance level.The results of the two samples are: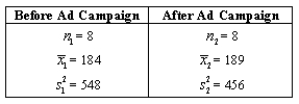
What is the test statistic?
Appropriate test: ____________________
Test statistic = ____________________
Question
NARRBEGIN: Automotive parts
A regional automotive parts chain store firm wants to improve the sales of tune-up supplies.It believes that a TV ad with a popular local,but offbeat,know-it-all actor might be able to affect their sales.Before the ads are run on TV,the company randomly samples eight of its weekly sales from past years.Following the ad campaign,eight weeks of sales were sampled.Weekly sales are approximately normally distributed and the population standard deviations are equal.Their hypothesis test is: Did the TV ad campaign help or hurt sales? To answer this question,the company plans to use a 0.05 significance level.The results of the two samples are:
What is the conclusion?
Question
NARRBEGIN: Price earnings
A comparison of the price-earnings (P/E)ratio for the top and bottom 100 companies in valuation is being prepared.A financial advisor randomly sampled each group to determine whether there is any difference in P/E ratios of the two groups of companies.Let 1 = a top 100 company and 2 = a bottom 100 company.Assume equal population variances and that the populations are normally distributed.The advisor is to use a 0.01 significance level.The data were randomly selected and are summarized below:
What is the value of the test statistic?
Appropriate test: ____________________
Test statistic = ____________________
Question
NARRBEGIN: Medicare
An economist wishes to test whether there is any difference in the proportion of households receiving Medicare for white households with less than $5,000 income per year and white households with $15,000 or more income per year.A random sample from households with less than $5,000 income per year is taken,and a random sample of households with $15,000 or more income is taken.The results of the samples are: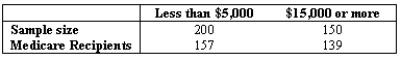
Use a 0.01 significance level to determine if there is sufficient evidence to conclude that a difference in proportions exists.Calculate the standard error of estimate.
Question
NARRBEGIN: Automotive parts
A regional automotive parts chain store firm wants to improve the sales of tune-up supplies.It believes that a TV ad with a popular local,but offbeat,know-it-all actor might be able to affect their sales.Before the ads are run on TV,the company randomly samples eight of its weekly sales from past years.Following the ad campaign,eight weeks of sales were sampled.Weekly sales are approximately normally distributed and the population standard deviations are equal.Their hypothesis test is: Did the TV ad campaign help or hurt sales? To answer this question,the company plans to use a 0.05 significance level.The results of the two samples are:
State null and alternative hypotheses.
H0: ____________________
H1: ____________________
Question
Question
NARRBEGIN: Automotive parts
A regional automotive parts chain store firm wants to improve the sales of tune-up supplies.It believes that a TV ad with a popular local,but offbeat,know-it-all actor might be able to affect their sales.Before the ads are run on TV,the company randomly samples eight of its weekly sales from past years.Following the ad campaign,eight weeks of sales were sampled.Weekly sales are approximately normally distributed and the population standard deviations are equal.Their hypothesis test is: Did the TV ad campaign help or hurt sales? To answer this question,the company plans to use a 0.05 significance level.The results of the two samples are:
What is the decision rule?
Question
NARRBEGIN: Battery
A new brand of battery for use in calculators and cameras is said to last significantly longer than another brand.A camera manufacturer is to test this brand (Y)with brand (X)to see if brand Y has a longer life.If brand Y does last longer,the camera manufacturer will equip their new cameras with them.If not,they will equip them with brand X that is less costly.Twenty cameras are equipped as follows: ten with brand Y batteries and ten with brand X batteries and the life of the batteries measured.Is brand Y superior (does it last longer)to brand X? To answer this question,the camera manufacturer uses a 0.01 significance level and knows that the populations are normally distributed with equal variances.Sample data are: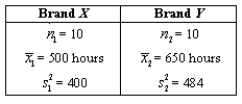
What is the test statistic?
Appropriate test: ____________________
Test statistic = ____________________
Question
Question
NARRBEGIN: Price earnings
A comparison of the price-earnings (P/E)ratio for the top and bottom 100 companies in valuation is being prepared.A financial advisor randomly sampled each group to determine whether there is any difference in P/E ratios of the two groups of companies.Let 1 = a top 100 company and 2 = a bottom 100 company.Assume equal population variances and that the populations are normally distributed.The advisor is to use a 0.01 significance level.The data were randomly selected and are summarized below:
State the null and alternative hypotheses.
H0: ____________________
H1: ____________________
Question
Question
NARRBEGIN: Slacks Manufacturer
A slacks manufacturer is deciding whether to purchase a new method for bonding seams together.Before purchasing a new method that bonds,or glues,the seams together,the manufacturer wishes to determine whether or not the "bonded" seams can withstand more pulling stress than standard seams sewn with thread.The creator of the new method provides a demonstration machine and supplies for the slacks maker to test.Two samples of the slacks produced are taken.Each pair of slacks has the seams tested in an application of force to determine the breaking point (in lbs.)for the seam.The sample results are: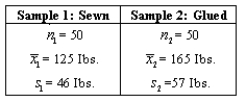
The test question is: At the 0.05 level of significance,is the gluing of seams better than sewing? What is the value of the test statistic?
Appropriate test: ____________________
Test statistic = ____________________
Question
Question
Question
NARRBEGIN: 1000 companies
From the top 1000 companies in valuation,a comparison of the mean dividend yield of the top and bottom ten electric utility companies is desired.Let 1 = top ten,and 2 = bottom ten,electric utility companies respectively.The data shown below are for two independent samples,which are drawn at random from populations that are normally distributed.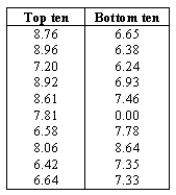
Use Minitab or Excel to conduct a two-sample t-test to test the hypotheses:
H0: H1:
H1:  at the 5% significance level.
From the top 1000 companies in valuation,a comparison of the mean dividend yield of the top and bottom ten electric utility companies is desired.Let 1 = top ten,and 2 = bottom ten,electric utility companies respectively.The data shown below are for two independent samples,which are drawn at random from populations that are normally distributed.
Use Minitab or Excel to conduct a two-sample t-test to test the hypotheses:
H0:
H1: at the 5% significance level. Question
NARRBEGIN: Slacks Manufacturer
A slacks manufacturer is deciding whether to purchase a new method for bonding seams together.Before purchasing a new method that bonds,or glues,the seams together,the manufacturer wishes to determine whether or not the "bonded" seams can withstand more pulling stress than standard seams sewn with thread.The creator of the new method provides a demonstration machine and supplies for the slacks maker to test.Two samples of the slacks produced are taken.Each pair of slacks has the seams tested in an application of force to determine the breaking point (in lbs.)for the seam.The sample results are:
The test question is: At the 0.05 level of significance,is the gluing of seams better than sewing? What are the null and alternative hypotheses?
H0: ____________________
H1: ____________________
Question
NARRBEGIN: Battery Manufacturer
A battery manufacturer claims that their new "long-lasting" battery has an average life that is significantly longer than their competitor's "regular" battery.Both types of batteries were tested and the number of hours each battery lasted is shown in the following table.

Assume unequal variances.Using = 0.01,state your conclusions.
A battery manufacturer claims that their new "long-lasting" battery has an average life that is significantly longer than their competitor's "regular" battery.Both types of batteries were tested and the number of hours each battery lasted is shown in the following table.
Assume unequal variances.Using
= 0.01,state your conclusions. Question
Question
NARRBEGIN: Battery Manufacturer
A battery manufacturer claims that their new "long-lasting" battery has an average life that is significantly longer than their competitor's "regular" battery.Both types of batteries were tested and the number of hours each battery lasted is shown in the following table.
Assume unequal variances.State the null and alternative hypothesis.
Question
Question
NARRBEGIN: 1000 companies
From the top 1000 companies in valuation,a comparison of the mean dividend yield of the top and bottom ten electric utility companies is desired.Let 1 = top ten,and 2 = bottom ten,electric utility companies respectively.The data shown below are for two independent samples,which are drawn at random from populations that are normally distributed.
Use Excel or Minitab to summarize the data using descriptive statistics
Question
NARRBEGIN: Realtor
A new realtor in a large community is attempting to determine differences in the selling prices of houses in two sections of the community.Population 1 is the Northeast and Population 2 is the Southwest.The realtor is going to perform the hypothesis test: H0: H1:
H1:  A random sample of 35 sale homes is taken from the Northeast and 41 from those in the Southwest using the multiple listing services.A Minitab summary of the results of the two samples expressed in thousands follows:
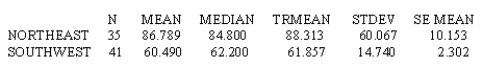
What is the conclusion?
A new realtor in a large community is attempting to determine differences in the selling prices of houses in two sections of the community.Population 1 is the Northeast and Population 2 is the Southwest.The realtor is going to perform the hypothesis test: H0:
H1: A random sample of 35 sale homes is taken from the Northeast and 41 from those in the Southwest using the multiple listing services.A Minitab summary of the results of the two samples expressed in thousands follows: What is the conclusion?
Question
NARRBEGIN: Coffee breaks
Do government employees take longer coffee breaks than private sector workers? That is a question that interested a management consultant.To examine the issue,he took a random sample of ten government employees and another random sample of ten private sector workers and measured the amount of time (in minutes)they spent in coffee breaks during the day.The results are listed below.Assume that the two populations are normally distributed.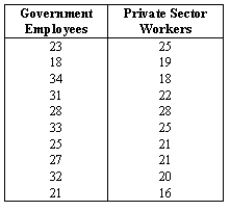
Do these data provide sufficient evidence at the 5% significance level to support the consultant's claim?
H0: ____________________
H1: ____________________
Appropriate test: ____________________
Test statistic = ____________________
Conclusion: ____________________
Interpretation: _________________________________________________
Question
NARRBEGIN: Battery Manufacturer
A battery manufacturer claims that their new "long-lasting" battery has an average life that is significantly longer than their competitor's "regular" battery.Both types of batteries were tested and the number of hours each battery lasted is shown in the following table.
Assume unequal variances.How many degrees of freedom are associated with this test?
Question
NARRBEGIN: Traffic Coordinator
A traffic coordinator for a community wishes to determine whether or not there is any difference in the average age of female and male drivers involved in rear-end accidents.The hypothesis test is: H0: (no difference in mean age)
H1: (mean age is different)A random sample of males and females involved in rear-end accidents results in the following Minitab summary:
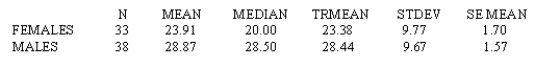
What is the value of the test statistic?
Appropriate test: ____________________
Test statistic = ____________________
A traffic coordinator for a community wishes to determine whether or not there is any difference in the average age of female and male drivers involved in rear-end accidents.The hypothesis test is: H0:
(no difference in mean age)H1:
(mean age is different)A random sample of males and females involved in rear-end accidents results in the following Minitab summary: What is the value of the test statistic?
Appropriate test: ____________________
Test statistic = ____________________
Question
Question
NARRBEGIN: Shooting club
A trap and skeet shooting club purchases clay pigeons.These are quite fragile and often break in the box during shipment without any outward sign of breakage.Even as the pigeons are loaded into the throwing machine,broken or cracked pigeons may not be noticed.Each pigeon broken is a net loss to the club so the club is anxious to purchase from suppliers who have a record of little or no breakage in shipping and handling.Two suppliers of clay pigeons are contacted and asked for price quotes.Supplier 1 quotes a higher price than Supplier 2 but says that the higher price is the result of better packaging and thus more usable pigeons per case.The shooting club manager decides to purchase 10 cases from both suppliers.Each case has 250 pigeons.Careful records are maintained on each case as to the number of good pigeons.The records after the cases were used are as follows: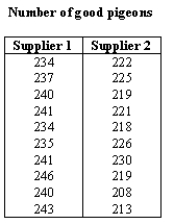
Use Excel or Minitab to summarize this data using descriptive statistics
Question
NARRBEGIN: Battery
A new brand of battery for use in calculators and cameras is said to last significantly longer than another brand.A camera manufacturer is to test this brand (Y)with brand (X)to see if brand Y has a longer life.If brand Y does last longer,the camera manufacturer will equip their new cameras with them.If not,they will equip them with brand X that is less costly.Twenty cameras are equipped as follows: ten with brand Y batteries and ten with brand X batteries and the life of the batteries measured.Is brand Y superior (does it last longer)to brand X? To answer this question,the camera manufacturer uses a 0.01 significance level and knows that the populations are normally distributed with equal variances.Sample data are:
State the conclusion.
Question
Question
NARRBEGIN: Battery Manufacturer
A battery manufacturer claims that their new "long-lasting" battery has an average life that is significantly longer than their competitor's "regular" battery.Both types of batteries were tested and the number of hours each battery lasted is shown in the following table.
Assume unequal variances.Using = 0.01,state the decision rule in terms of the critical value.
A battery manufacturer claims that their new "long-lasting" battery has an average life that is significantly longer than their competitor's "regular" battery.Both types of batteries were tested and the number of hours each battery lasted is shown in the following table.
Assume unequal variances.Using
= 0.01,state the decision rule in terms of the critical value. Question
NARRBEGIN: Traffic Coordinator
A traffic coordinator for a community wishes to determine whether or not there is any difference in the average age of female and male drivers involved in rear-end accidents.The hypothesis test is: H0: (no difference in mean age)
H1: (mean age is different)A random sample of males and females involved in rear-end accidents results in the following Minitab summary:
What is the conclusion?
A traffic coordinator for a community wishes to determine whether or not there is any difference in the average age of female and male drivers involved in rear-end accidents.The hypothesis test is: H0:
(no difference in mean age)H1:
(mean age is different)A random sample of males and females involved in rear-end accidents results in the following Minitab summary: What is the conclusion?

Unlock Deck
Sign up to unlock the cards in this deck!
Unlock Deck
Unlock Deck
1/149
Play
Full screen (f)
Deck 11: Hypothesis Tests Involving Two Sample Means
1
Although it is often associated only with small-sample tests,the t distribution is appropriate when the population standard deviations are unknown,regardless of how large or small the samples happen to be.
True
2
An example of dependent samples occurs when subjects are randomly assigned to the experimental and control groups of an experiment.
False
3
The number of degrees of freedom associated with the unequal-variances t-test for comparing the means of two independent samples is n1 + n2 - 2.
False
4
The comparison of sample proportions from two independent samples relies on the t-distribution and assumes that the two populations are normally distributed.
Unlock Deck
Unlock for access to all 149 flashcards in this deck.
Unlock Deck
k this deck
5
The z-test approximation to the unequal variance t-test assumes that the population standard deviations, 1 and 2 ,are known.
Unlock Deck
Unlock for access to all 149 flashcards in this deck.
Unlock Deck
k this deck
6
Independent samples are those for which the selection process for one is not related to the selection process for the other.
Unlock Deck
Unlock for access to all 149 flashcards in this deck.
Unlock Deck
k this deck
7
When either test can be applied to the same data,the z-test for comparing the means of two independent samples is preferable to the unequal-variances t-tests,especially when doing the test with computer assistance.
Unlock Deck
Unlock for access to all 149 flashcards in this deck.
Unlock Deck
k this deck
8
Comparing the means or proportions from two independent samples requires comparing the calculated value of a test statistic with the computed p-value,then deciding whether the null hypothesis should be rejected.
Unlock Deck
Unlock for access to all 149 flashcards in this deck.
Unlock Deck
k this deck
9
An important factor in choosing between the pooled-variances t-test and the unequal-variances t-test is whether we can assume the population means might be equal.
Unlock Deck
Unlock for access to all 149 flashcards in this deck.
Unlock Deck
k this deck
10
The z-test requires no assumptions about the shape of the population distributions as long as both n1 and n2 are ? 30.
Unlock Deck
Unlock for access to all 149 flashcards in this deck.
Unlock Deck
k this deck
11
When the population standard deviations are unknown and are not assumed to be equal,s1 and s2 must be used to estimate their respective population standard deviations, 1 and 2.
Unlock Deck
Unlock for access to all 149 flashcards in this deck.
Unlock Deck
k this deck
12
The F distribution is the sampling distribution of that would result if two samples were repeatedly drawn from the same,normally distributed population.
Unlock Deck
Unlock for access to all 149 flashcards in this deck.
Unlock Deck
k this deck
13
A typical example of independent samples occurs with before-and-after measurements for the same individuals or test units.
Unlock Deck
Unlock for access to all 149 flashcards in this deck.
Unlock Deck
k this deck
14
When comparing the mean of two dependent samples,we are interested in only one variable: the difference between measurements for each person or object.
Unlock Deck
Unlock for access to all 149 flashcards in this deck.
Unlock Deck
k this deck
15
Unlike the t distribution,the exact shape of the F distribution is determined by two different degrees of freedom instead of just a single value.
Unlock Deck
Unlock for access to all 149 flashcards in this deck.
Unlock Deck
k this deck
16
When the population standard deviations are unknown and not assumed to be equal,pooling the sample standard deviations into a single estimate of their common population value is no longer applicable.
Unlock Deck
Unlock for access to all 149 flashcards in this deck.
Unlock Deck
k this deck
17
If we wish to examine the before-and-after productivity of individual employees after a change in their workstation layout,a matched-pairs t-test is applicable.
Unlock Deck
Unlock for access to all 149 flashcards in this deck.
Unlock Deck
k this deck
18
If we wish to compare the before-and-after reading speeds of individual participants in a speed-reading course,the z-test for comparing the means of two independent samples is appropriate.
Unlock Deck
Unlock for access to all 149 flashcards in this deck.
Unlock Deck
k this deck
19
A typical example of dependent samples occurs when we have before-and-after measures of the same individuals.
Unlock Deck
Unlock for access to all 149 flashcards in this deck.
Unlock Deck
k this deck
20
One of the most useful applications of business statistics involves comparing two samples to examine whether a difference between them is significant or more likely due to chance variation from one sample to the next.
Unlock Deck
Unlock for access to all 149 flashcards in this deck.
Unlock Deck
k this deck
21
Diet and health have become big business,but many people are not following good health practices.In 1980,a survey of 150 indicated that 30 percent said that at least one time during that year they had five or more alcoholic drinks in one sitting.In 2000,a similar survey of 150 showed that 38 percent had five drinks in one sitting at least one time during the year.Does this represent a significant increase? Use 0.01 level of significance.
A) The test statistic of -1.46 is not less than -1.96; therefore,the sample evidence indicates that there has been no significant change in the proportion of those who drink heavily at least one day during the year.
B) The test statistic of -1.46 is not less than -2.58; therefore,the sample evidence indicates that there has been no significant change in the proportion of those who drink heavily at least one day during the year.
C) The test statistic of -1.46 is not less than -2.33; therefore,the sample evidence indicates that there has not been significant change in the proportion of those who drink heavily at least one day during the year.
D) The test statistic of -2.56 is less than -2.33; therefore,the sample evidence indicates that there has been significant change in the proportion of those who drink heavily at least one day during the year.
E) The test statistic of -2.56 is less than -2.58; therefore,the sample evidence indicates that there has been significant change in the proportion of those who drink heavily at least one day during the year.
Unlock Deck
Unlock for access to all 149 flashcards in this deck.
Unlock Deck
k this deck
22
When the necessary conditions are met,a two-tail test is being conducted to test the difference between two population proportions.The two sample proportions are p1 = 0.25 and p2 = 0.20,and the standard error of the sampling distribution of p1 - p2 is 0.04.The calculated value of the test statistic will be:
A) z = 0.25.
B) z = 1.25.
C) t = 0.25.
D) t = 0.80.
A) z = 0.25.
B) z = 1.25.
C) t = 0.25.
D) t = 0.80.
Unlock Deck
Unlock for access to all 149 flashcards in this deck.
Unlock Deck
k this deck
23
In testing the difference between two population means using two independent samples,the sampling distribution of the sample mean difference is normal if the:
A) sample sizes are both greater than 30.
B) populations are normal.
C) populations are non-normal and the sample sizes are large.
D) population sizes are both greater than 30.
E) all of these are required conditions.
A) sample sizes are both greater than 30.
B) populations are normal.
C) populations are non-normal and the sample sizes are large.
D) population sizes are both greater than 30.
E) all of these are required conditions.
Unlock Deck
Unlock for access to all 149 flashcards in this deck.
Unlock Deck
k this deck
24
NARRBEGIN: Chrysler corp
Chrysler Corp.is responding to an advertisement by Toyota,which claims that its compact version gets much better gasoline mileage for in-city driving than any U.S.made car.Below are the results of surveys conducted to test the claim.Perform the appropriate test at the 0.01 significance level.
What is the p-value?
Chrysler Corp.is responding to an advertisement by Toyota,which claims that its compact version gets much better gasoline mileage for in-city driving than any U.S.made car.Below are the results of surveys conducted to test the claim.Perform the appropriate test at the 0.01 significance level.
What is the p-value?
Unlock Deck
Unlock for access to all 149 flashcards in this deck.
Unlock Deck
k this deck
25
NARRBEGIN: Realtor
A new realtor in a large community is attempting to determine differences in the selling prices of houses in two sections of the community.Population 1 is the Northeast and Population 2 is the Southwest.The realtor is going to perform the hypothesis test: H0: H1: A random sample of 35 sale homes is taken from the Northeast and 41 from those in the Southwest using the multiple listing services.A Minitab summary of the results of the two samples expressed in thousands follows:
What is the standard error of the difference between the two means?
A new realtor in a large community is attempting to determine differences in the selling prices of houses in two sections of the community.Population 1 is the Northeast and Population 2 is the Southwest.The realtor is going to perform the hypothesis test: H0:
H1: A random sample of 35 sale homes is taken from the Northeast and 41 from those in the Southwest using the multiple listing services.A Minitab summary of the results of the two samples expressed in thousands follows: What is the standard error of the difference between the two means?
Unlock Deck
Unlock for access to all 149 flashcards in this deck.
Unlock Deck
k this deck
26
NARRBEGIN: Price earnings
A comparison of the price-earnings (P/E)ratio for the top and bottom 100 companies in valuation is being prepared.A financial advisor randomly sampled each group to determine whether there is any difference in P/E ratios of the two groups of companies.Let 1 = a top 100 company and 2 = a bottom 100 company.Assume equal population variances and that the populations are normally distributed.The advisor is to use a 0.01 significance level.The data were randomly selected and are summarized below:
Calculate the standard error of the estimate.
Unlock Deck
Unlock for access to all 149 flashcards in this deck.
Unlock Deck
k this deck
27
A political analyst in Texas surveys a random sample of registered Democrats and compares the results with those obtained from a random sample of registered Republicans.This would be an example of:
A) Independent samples.
B) dependent samples.
C) Independent samples only if the sample sizes are equal.
D) Dependent samples only if the sample sizes are equal.
A) Independent samples.
B) dependent samples.
C) Independent samples only if the sample sizes are equal.
D) Dependent samples only if the sample sizes are equal.
Unlock Deck
Unlock for access to all 149 flashcards in this deck.
Unlock Deck
k this deck
28
In testing the difference between two population means using two independent samples,we use the pooled variance in estimating the standard error of the sampling distribution of the sample mean difference if the:
A) sample sizes are both large.
B) populations are at least normally distributed with equal variances.
C) populations are non-normal with unequal variances.
D) All of these are required conditions.
A) sample sizes are both large.
B) populations are at least normally distributed with equal variances.
C) populations are non-normal with unequal variances.
D) All of these are required conditions.
Unlock Deck
Unlock for access to all 149 flashcards in this deck.
Unlock Deck
k this deck
29
Which of the following statements are true?
A) The pooled-variances t-test is used whenever the population standard deviations are assumed to be equal regardless of the sample size.
B) The unequal-variances t-test is used whenever the population standard deviations are unknown and cannot be assumed to be equal.
C) The z-test can be used as a close approximation to the unequal-variances t-test when the population standard deviations are not assumed to be equal,but samples are large (each n30).
D) All of these statements are true.
E) None of these statements is true.
Unlock Deck
Unlock for access to all 149 flashcards in this deck.
Unlock Deck
k this deck
30
A special hypothesis test,based on the t-distribution,can be applied to test the null hypothesis that the population variances are equal for two independent samples.
Unlock Deck
Unlock for access to all 149 flashcards in this deck.
Unlock Deck
k this deck
31
Assume two normally distributed populations with equal population standard deviations.A random sample is taken from each population.Determine the standard error of the estimate for the following situation:
Unlock Deck
Unlock for access to all 149 flashcards in this deck.
Unlock Deck
k this deck
32
NARRBEGIN: Traffic Coordinator
A traffic coordinator for a community wishes to determine whether or not there is any difference in the average age of female and male drivers involved in rear-end accidents.The hypothesis test is: H0: (no difference in mean age)
H1: (mean age is different)A random sample of males and females involved in rear-end accidents results in the following Minitab summary:
What is the standard error of the difference between the two means?
A traffic coordinator for a community wishes to determine whether or not there is any difference in the average age of female and male drivers involved in rear-end accidents.The hypothesis test is: H0:
(no difference in mean age)H1:
(mean age is different)A random sample of males and females involved in rear-end accidents results in the following Minitab summary: What is the standard error of the difference between the two means?
Unlock Deck
Unlock for access to all 149 flashcards in this deck.
Unlock Deck
k this deck
33
A sample of size 100 selected from one population has 60 successes,and a sample of size 150 selected from a second population has 95 successes.The test statistic for testing the equality of the population proportions equal to:
A) -0.5319.
B) 0.7293.
C) -0.419.
D) 0.2702.
A) -0.5319.
B) 0.7293.
C) -0.419.
D) 0.2702.
Unlock Deck
Unlock for access to all 149 flashcards in this deck.
Unlock Deck
k this deck
34
In testing whether the means of two normal populations are equal,summary statistics computed for two independent samples are as follows: Assume that the population variances are equal.Then,the standard error of the sampling distribution of the sample mean difference is equal to:
A) 0.1017.
B) 1.2713.
C) 0.3189.
D) 1.1275.
A) 0.1017.
B) 1.2713.
C) 0.3189.
D) 1.1275.
Unlock Deck
Unlock for access to all 149 flashcards in this deck.
Unlock Deck
k this deck
35
NARRBEGIN: Women drivers
In the past,young women drivers have maintained a better driving record than young men drivers.An insurance company is concerned with the driving record of its insured customers.Specifically,it conducts a test for the number of speeding tickets received during the past year by drivers between the ages of 18 and 25.
A test for the equality of average number of tickets per driver for the two groups is desired.Use = 0.01.Calculate the p-value for this test.
In the past,young women drivers have maintained a better driving record than young men drivers.An insurance company is concerned with the driving record of its insured customers.Specifically,it conducts a test for the number of speeding tickets received during the past year by drivers between the ages of 18 and 25.
A test for the equality of average number of tickets per driver for the two groups is desired.Use
= 0.01.Calculate the p-value for this test. Unlock Deck
Unlock for access to all 149 flashcards in this deck.
Unlock Deck
k this deck
36
When the necessary conditions are met,a two-tail test is being conducted to test the difference between two population proportions.If the value of the test statistic z is 2.05,then the p-value is:
A) 0.4798.
B) 0.0404.
C) 0.2399.
D) 0.0202.
A) 0.4798.
B) 0.0404.
C) 0.2399.
D) 0.0202.
Unlock Deck
Unlock for access to all 149 flashcards in this deck.
Unlock Deck
k this deck
37
When the necessary conditions are met,a two-tail test is being conducted to test the difference between two population means,but your statistical software provides only a one-tail area of 0.036 as part of its output.The p-value for this two-tail test will be:
A) 0.018.
B) 0.009.
C) 0.072.
D) 0.964.
A) 0.018.
B) 0.009.
C) 0.072.
D) 0.964.
Unlock Deck
Unlock for access to all 149 flashcards in this deck.
Unlock Deck
k this deck
38
NARRBEGIN: Realtor
A new realtor in a large community is attempting to determine differences in the selling prices of houses in two sections of the community.Population 1 is the Northeast and Population 2 is the Southwest.The realtor is going to perform the hypothesis test: H0: H1: A random sample of 35 sale homes is taken from the Northeast and 41 from those in the Southwest using the multiple listing services.A Minitab summary of the results of the two samples expressed in thousands follows:
What is the value of the test statistic?
z = ____________________
A new realtor in a large community is attempting to determine differences in the selling prices of houses in two sections of the community.Population 1 is the Northeast and Population 2 is the Southwest.The realtor is going to perform the hypothesis test: H0:
H1: A random sample of 35 sale homes is taken from the Northeast and 41 from those in the Southwest using the multiple listing services.A Minitab summary of the results of the two samples expressed in thousands follows: What is the value of the test statistic?
z = ____________________
Unlock Deck
Unlock for access to all 149 flashcards in this deck.
Unlock Deck
k this deck
39
In testing for the equality of two population variances,when the populations are normally distributed,the 10% level of significance has been used.To determine the rejection region,it will be necessary to refer to the F table corresponding to an upper-tail area of:
A) 0.90.
B) 0.05.
C) 0.20.
D) 0.10.
A) 0.90.
B) 0.05.
C) 0.20.
D) 0.10.
Unlock Deck
Unlock for access to all 149 flashcards in this deck.
Unlock Deck
k this deck
40
In testing the difference between two population means using two independent samples,the population standard deviations are assumed to be unknown,each sample size is ? 30,and the calculated test statistic z = 2.56.If the test is two-tail and 5% level of significance has been specified,the conclusion should be to:
A) reject the null hypothesis.
B) not to reject the null hypothesis.
C) choose two other independent samples.
D) none of these answers is correct.
A) reject the null hypothesis.
B) not to reject the null hypothesis.
C) choose two other independent samples.
D) none of these answers is correct.
Unlock Deck
Unlock for access to all 149 flashcards in this deck.
Unlock Deck
k this deck
41
The pooled-variances t-test requires the assumption that the two population ___________________________________ are equal,and that the populations are at least ___________________________________ distributed.
Unlock Deck
Unlock for access to all 149 flashcards in this deck.
Unlock Deck
k this deck
42
NARRBEGIN: Price earnings
A comparison of the price-earnings (P/E)ratio for the top and bottom 100 companies in valuation is being prepared.A financial advisor randomly sampled each group to determine whether there is any difference in P/E ratios of the two groups of companies.Let 1 = a top 100 company and 2 = a bottom 100 company.Assume equal population variances and that the populations are normally distributed.The advisor is to use a 0.01 significance level.The data were randomly selected and are summarized below:
What is the conclusion?
Unlock Deck
Unlock for access to all 149 flashcards in this deck.
Unlock Deck
k this deck
43
NARRBEGIN: Price earnings
A comparison of the price-earnings (P/E)ratio for the top and bottom 100 companies in valuation is being prepared.A financial advisor randomly sampled each group to determine whether there is any difference in P/E ratios of the two groups of companies.Let 1 = a top 100 company and 2 = a bottom 100 company.Assume equal population variances and that the populations are normally distributed.The advisor is to use a 0.01 significance level.The data were randomly selected and are summarized below:
What is the decision rule?
Unlock Deck
Unlock for access to all 149 flashcards in this deck.
Unlock Deck
k this deck
44
When comparing the means of two independent samples,the ____________________ is applicable whenever the population standard deviations are unknown.
Unlock Deck
Unlock for access to all 149 flashcards in this deck.
Unlock Deck
k this deck
45
Battery
A new brand of battery for use in calculators and cameras is said to last significantly longer than another brand.A camera manufacturer is to test this brand (Y)with brand (X)to see if brand Y has a longer life.If brand Y does last longer,the camera manufacturer will equip their new cameras with them.If not,they will equip them with brand X that is less costly.Twenty cameras are equipped as follows: ten with brand Y batteries and ten with brand X batteries and the life of the batteries measured.Is brand Y superior (does it last longer)to brand X? To answer this question,the camera manufacturer uses a 0.01 significance level and knows that the populations are normally distributed with equal variances.Sample data are:
-State the null and alternative hypotheses.
H0: ____________________
H1: ____________________
Unlock Deck
Unlock for access to all 149 flashcards in this deck.
Unlock Deck
k this deck
46
The ____________________ approximation is an alternative to the unequal-variances t-test whenever both n1 and n2 are 30.
30. Unlock Deck
Unlock for access to all 149 flashcards in this deck.
Unlock Deck
k this deck
47
NARRBEGIN: Production Line
A quality control inspector keeps a tally sheet of the number of acceptable and unacceptable products that come off two different production lines.The completed sheet is shown below.
What is the p-value of the test?
A quality control inspector keeps a tally sheet of the number of acceptable and unacceptable products that come off two different production lines.The completed sheet is shown below.
What is the p-value of the test?
Unlock Deck
Unlock for access to all 149 flashcards in this deck.
Unlock Deck
k this deck
48
A test that we can use to determine whether two population variances are equal is the ____________________.
Unlock Deck
Unlock for access to all 149 flashcards in this deck.
Unlock Deck
k this deck
49
We say samples are ____________________ when the selection process for one is related to the selection process for the other.
Unlock Deck
Unlock for access to all 149 flashcards in this deck.
Unlock Deck
k this deck
50
NARRBEGIN: Automotive parts
A regional automotive parts chain store firm wants to improve the sales of tune-up supplies.It believes that a TV ad with a popular local,but offbeat,know-it-all actor might be able to affect their sales.Before the ads are run on TV,the company randomly samples eight of its weekly sales from past years.Following the ad campaign,eight weeks of sales were sampled.Weekly sales are approximately normally distributed and the population standard deviations are equal.Their hypothesis test is: Did the TV ad campaign help or hurt sales? To answer this question,the company plans to use a 0.05 significance level.The results of the two samples are:
What is the test statistic?
Appropriate test: ____________________
Test statistic = ____________________
Unlock Deck
Unlock for access to all 149 flashcards in this deck.
Unlock Deck
k this deck
51
NARRBEGIN: Automotive parts
A regional automotive parts chain store firm wants to improve the sales of tune-up supplies.It believes that a TV ad with a popular local,but offbeat,know-it-all actor might be able to affect their sales.Before the ads are run on TV,the company randomly samples eight of its weekly sales from past years.Following the ad campaign,eight weeks of sales were sampled.Weekly sales are approximately normally distributed and the population standard deviations are equal.Their hypothesis test is: Did the TV ad campaign help or hurt sales? To answer this question,the company plans to use a 0.05 significance level.The results of the two samples are:
What is the conclusion?
Unlock Deck
Unlock for access to all 149 flashcards in this deck.
Unlock Deck
k this deck
52
NARRBEGIN: Price earnings
A comparison of the price-earnings (P/E)ratio for the top and bottom 100 companies in valuation is being prepared.A financial advisor randomly sampled each group to determine whether there is any difference in P/E ratios of the two groups of companies.Let 1 = a top 100 company and 2 = a bottom 100 company.Assume equal population variances and that the populations are normally distributed.The advisor is to use a 0.01 significance level.The data were randomly selected and are summarized below:
What is the value of the test statistic?
Appropriate test: ____________________
Test statistic = ____________________
Unlock Deck
Unlock for access to all 149 flashcards in this deck.
Unlock Deck
k this deck
53
NARRBEGIN: Medicare
An economist wishes to test whether there is any difference in the proportion of households receiving Medicare for white households with less than $5,000 income per year and white households with $15,000 or more income per year.A random sample from households with less than $5,000 income per year is taken,and a random sample of households with $15,000 or more income is taken.The results of the samples are:
Use a 0.01 significance level to determine if there is sufficient evidence to conclude that a difference in proportions exists.Calculate the standard error of estimate.
An economist wishes to test whether there is any difference in the proportion of households receiving Medicare for white households with less than $5,000 income per year and white households with $15,000 or more income per year.A random sample from households with less than $5,000 income per year is taken,and a random sample of households with $15,000 or more income is taken.The results of the samples are:
Use a 0.01 significance level to determine if there is sufficient evidence to conclude that a difference in proportions exists.Calculate the standard error of estimate.
Unlock Deck
Unlock for access to all 149 flashcards in this deck.
Unlock Deck
k this deck
54
NARRBEGIN: Automotive parts
A regional automotive parts chain store firm wants to improve the sales of tune-up supplies.It believes that a TV ad with a popular local,but offbeat,know-it-all actor might be able to affect their sales.Before the ads are run on TV,the company randomly samples eight of its weekly sales from past years.Following the ad campaign,eight weeks of sales were sampled.Weekly sales are approximately normally distributed and the population standard deviations are equal.Their hypothesis test is: Did the TV ad campaign help or hurt sales? To answer this question,the company plans to use a 0.05 significance level.The results of the two samples are:
State null and alternative hypotheses.
H0: ____________________
H1: ____________________
Unlock Deck
Unlock for access to all 149 flashcards in this deck.
Unlock Deck
k this deck
55
NARRBEGIN: Ford Motor Co.
The Ford Motor Company,as part of its quality control program,began returning to the supplier all shipments of steel that had defects or faulty chemistry.When Ford began this program,the defective rate in 100 shipments was 9%.A recent survey indicated that 2.2% in 136 shipments was defective.Does this represent a significant improvement in the quality of the steel? Test at the 0.05 level.
What is the p-value?
Unlock Deck
Unlock for access to all 149 flashcards in this deck.
Unlock Deck
k this deck
56
NARRBEGIN: Automotive parts
A regional automotive parts chain store firm wants to improve the sales of tune-up supplies.It believes that a TV ad with a popular local,but offbeat,know-it-all actor might be able to affect their sales.Before the ads are run on TV,the company randomly samples eight of its weekly sales from past years.Following the ad campaign,eight weeks of sales were sampled.Weekly sales are approximately normally distributed and the population standard deviations are equal.Their hypothesis test is: Did the TV ad campaign help or hurt sales? To answer this question,the company plans to use a 0.05 significance level.The results of the two samples are:
What is the decision rule?
Unlock Deck
Unlock for access to all 149 flashcards in this deck.
Unlock Deck
k this deck
57
NARRBEGIN: Battery
A new brand of battery for use in calculators and cameras is said to last significantly longer than another brand.A camera manufacturer is to test this brand (Y)with brand (X)to see if brand Y has a longer life.If brand Y does last longer,the camera manufacturer will equip their new cameras with them.If not,they will equip them with brand X that is less costly.Twenty cameras are equipped as follows: ten with brand Y batteries and ten with brand X batteries and the life of the batteries measured.Is brand Y superior (does it last longer)to brand X? To answer this question,the camera manufacturer uses a 0.01 significance level and knows that the populations are normally distributed with equal variances.Sample data are:
What is the test statistic?
Appropriate test: ____________________
Test statistic = ____________________
Unlock Deck
Unlock for access to all 149 flashcards in this deck.
Unlock Deck
k this deck
58
Tests in which samples are not independent are referred to as ______________________________.
Unlock Deck
Unlock for access to all 149 flashcards in this deck.
Unlock Deck
k this deck
59
NARRBEGIN: Price earnings
A comparison of the price-earnings (P/E)ratio for the top and bottom 100 companies in valuation is being prepared.A financial advisor randomly sampled each group to determine whether there is any difference in P/E ratios of the two groups of companies.Let 1 = a top 100 company and 2 = a bottom 100 company.Assume equal population variances and that the populations are normally distributed.The advisor is to use a 0.01 significance level.The data were randomly selected and are summarized below:
State the null and alternative hypotheses.
H0: ____________________
H1: ____________________
Unlock Deck
Unlock for access to all 149 flashcards in this deck.
Unlock Deck
k this deck
60
____________________ samples are those for which the selection process for one is not related to the selection process for the other.
Unlock Deck
Unlock for access to all 149 flashcards in this deck.
Unlock Deck
k this deck
61
NARRBEGIN: Slacks Manufacturer
A slacks manufacturer is deciding whether to purchase a new method for bonding seams together.Before purchasing a new method that bonds,or glues,the seams together,the manufacturer wishes to determine whether or not the "bonded" seams can withstand more pulling stress than standard seams sewn with thread.The creator of the new method provides a demonstration machine and supplies for the slacks maker to test.Two samples of the slacks produced are taken.Each pair of slacks has the seams tested in an application of force to determine the breaking point (in lbs.)for the seam.The sample results are:
The test question is: At the 0.05 level of significance,is the gluing of seams better than sewing? What is the value of the test statistic?
Appropriate test: ____________________
Test statistic = ____________________
Unlock Deck
Unlock for access to all 149 flashcards in this deck.
Unlock Deck
k this deck
62
Realtor
A new realtor in a large community is attempting to determine differences in the selling prices of houses in two sections of the community.Population 1 is the Northeast and Population 2 is the Southwest.The realtor is going to perform the hypothesis test: H0: H1: A random sample of 35 sale homes is taken from the Northeast and 41 from those in the Southwest using the multiple listing services.A Minitab summary of the results of the two samples expressed in thousands follows:
-What is the decision rule at the 0.01 level of significance?
Unlock Deck
Unlock for access to all 149 flashcards in this deck.
Unlock Deck
k this deck
63
Shooting club
A trap and skeet shooting club purchases clay pigeons.These are quite fragile and often break in the box during shipment without any outward sign of breakage.Even as the pigeons are loaded into the throwing machine,broken or cracked pigeons may not be noticed.Each pigeon broken is a net loss to the club so the club is anxious to purchase from suppliers who have a record of little or no breakage in shipping and handling.Two suppliers of clay pigeons are contacted and asked for price quotes.Supplier 1 quotes a higher price than Supplier 2 but says that the higher price is the result of better packaging and thus more usable pigeons per case.The shooting club manager decides to purchase 10 cases from both suppliers.Each case has 250 pigeons.Careful records are maintained on each case as to the number of good pigeons.The records after the cases were used are as follows:
-Use Excel or Minitab to conduct a two-sample t-test
Test the hypotheses: H0: 1 2 H1: 1 > 2 at the 5% significance level.What is your conclusion?
Unlock Deck
Unlock for access to all 149 flashcards in this deck.
Unlock Deck
k this deck
64
NARRBEGIN: 1000 companies
From the top 1000 companies in valuation,a comparison of the mean dividend yield of the top and bottom ten electric utility companies is desired.Let 1 = top ten,and 2 = bottom ten,electric utility companies respectively.The data shown below are for two independent samples,which are drawn at random from populations that are normally distributed.
Use Minitab or Excel to conduct a two-sample t-test to test the hypotheses:
H0: H1: at the 5% significance level.
From the top 1000 companies in valuation,a comparison of the mean dividend yield of the top and bottom ten electric utility companies is desired.Let 1 = top ten,and 2 = bottom ten,electric utility companies respectively.The data shown below are for two independent samples,which are drawn at random from populations that are normally distributed.
Use Minitab or Excel to conduct a two-sample t-test to test the hypotheses:
H0:
H1: at the 5% significance level. Unlock Deck
Unlock for access to all 149 flashcards in this deck.
Unlock Deck
k this deck
65
NARRBEGIN: Slacks Manufacturer
A slacks manufacturer is deciding whether to purchase a new method for bonding seams together.Before purchasing a new method that bonds,or glues,the seams together,the manufacturer wishes to determine whether or not the "bonded" seams can withstand more pulling stress than standard seams sewn with thread.The creator of the new method provides a demonstration machine and supplies for the slacks maker to test.Two samples of the slacks produced are taken.Each pair of slacks has the seams tested in an application of force to determine the breaking point (in lbs.)for the seam.The sample results are:
The test question is: At the 0.05 level of significance,is the gluing of seams better than sewing? What are the null and alternative hypotheses?
H0: ____________________
H1: ____________________
Unlock Deck
Unlock for access to all 149 flashcards in this deck.
Unlock Deck
k this deck
66
NARRBEGIN: Battery Manufacturer
A battery manufacturer claims that their new "long-lasting" battery has an average life that is significantly longer than their competitor's "regular" battery.Both types of batteries were tested and the number of hours each battery lasted is shown in the following table.
Assume unequal variances.Using = 0.01,state your conclusions.
A battery manufacturer claims that their new "long-lasting" battery has an average life that is significantly longer than their competitor's "regular" battery.Both types of batteries were tested and the number of hours each battery lasted is shown in the following table.
Assume unequal variances.Using
= 0.01,state your conclusions. Unlock Deck
Unlock for access to all 149 flashcards in this deck.
Unlock Deck
k this deck
67
Battery
A new brand of battery for use in calculators and cameras is said to last significantly longer than another brand.A camera manufacturer is to test this brand (Y)with brand (X)to see if brand Y has a longer life.If brand Y does last longer,the camera manufacturer will equip their new cameras with them.If not,they will equip them with brand X that is less costly.Twenty cameras are equipped as follows: ten with brand Y batteries and ten with brand X batteries and the life of the batteries measured.Is brand Y superior (does it last longer)to brand X? To answer this question,the camera manufacturer uses a 0.01 significance level and knows that the populations are normally distributed with equal variances.Sample data are:
-What is the decision rule?
Unlock Deck
Unlock for access to all 149 flashcards in this deck.
Unlock Deck
k this deck
68
NARRBEGIN: Battery Manufacturer
A battery manufacturer claims that their new "long-lasting" battery has an average life that is significantly longer than their competitor's "regular" battery.Both types of batteries were tested and the number of hours each battery lasted is shown in the following table.
Assume unequal variances.State the null and alternative hypothesis.
Unlock Deck
Unlock for access to all 149 flashcards in this deck.
Unlock Deck
k this deck
69
NARRBEGIN: Coffee breaks
Do government employees take longer coffee breaks than private sector workers? That is a question that interested a management consultant. To examine the issue, he took a random sample of ten government employees and another random sample of ten private sector workers and measured the amount of time (in minutes) they spent in coffee breaks during the day. The results are listed below. Assume that the two populations are normally distributed.
Explain what the interval estimate tells you.
Unlock Deck
Unlock for access to all 149 flashcards in this deck.
Unlock Deck
k this deck
70
NARRBEGIN: 1000 companies
From the top 1000 companies in valuation,a comparison of the mean dividend yield of the top and bottom ten electric utility companies is desired.Let 1 = top ten,and 2 = bottom ten,electric utility companies respectively.The data shown below are for two independent samples,which are drawn at random from populations that are normally distributed.
Use Excel or Minitab to summarize the data using descriptive statistics
Unlock Deck
Unlock for access to all 149 flashcards in this deck.
Unlock Deck
k this deck
71
NARRBEGIN: Realtor
A new realtor in a large community is attempting to determine differences in the selling prices of houses in two sections of the community.Population 1 is the Northeast and Population 2 is the Southwest.The realtor is going to perform the hypothesis test: H0: H1: A random sample of 35 sale homes is taken from the Northeast and 41 from those in the Southwest using the multiple listing services.A Minitab summary of the results of the two samples expressed in thousands follows:
What is the conclusion?
A new realtor in a large community is attempting to determine differences in the selling prices of houses in two sections of the community.Population 1 is the Northeast and Population 2 is the Southwest.The realtor is going to perform the hypothesis test: H0:
H1: A random sample of 35 sale homes is taken from the Northeast and 41 from those in the Southwest using the multiple listing services.A Minitab summary of the results of the two samples expressed in thousands follows: What is the conclusion?
Unlock Deck
Unlock for access to all 149 flashcards in this deck.
Unlock Deck
k this deck
72
NARRBEGIN: Coffee breaks
Do government employees take longer coffee breaks than private sector workers? That is a question that interested a management consultant.To examine the issue,he took a random sample of ten government employees and another random sample of ten private sector workers and measured the amount of time (in minutes)they spent in coffee breaks during the day.The results are listed below.Assume that the two populations are normally distributed.
Do these data provide sufficient evidence at the 5% significance level to support the consultant's claim?
H0: ____________________
H1: ____________________
Appropriate test: ____________________
Test statistic = ____________________
Conclusion: ____________________
Interpretation: _________________________________________________
Unlock Deck
Unlock for access to all 149 flashcards in this deck.
Unlock Deck
k this deck
73
NARRBEGIN: Battery Manufacturer
A battery manufacturer claims that their new "long-lasting" battery has an average life that is significantly longer than their competitor's "regular" battery.Both types of batteries were tested and the number of hours each battery lasted is shown in the following table.
Assume unequal variances.How many degrees of freedom are associated with this test?
Unlock Deck
Unlock for access to all 149 flashcards in this deck.
Unlock Deck
k this deck
74
NARRBEGIN: Traffic Coordinator
A traffic coordinator for a community wishes to determine whether or not there is any difference in the average age of female and male drivers involved in rear-end accidents.The hypothesis test is: H0: (no difference in mean age)
H1: (mean age is different)A random sample of males and females involved in rear-end accidents results in the following Minitab summary:
What is the value of the test statistic?
Appropriate test: ____________________
Test statistic = ____________________
A traffic coordinator for a community wishes to determine whether or not there is any difference in the average age of female and male drivers involved in rear-end accidents.The hypothesis test is: H0:
(no difference in mean age)H1:
(mean age is different)A random sample of males and females involved in rear-end accidents results in the following Minitab summary: What is the value of the test statistic?
Appropriate test: ____________________
Test statistic = ____________________
Unlock Deck
Unlock for access to all 149 flashcards in this deck.
Unlock Deck
k this deck
75
Coffee breaks
Do government employees take longer coffee breaks than private sector workers? That is a question that interested a management consultant.To examine the issue,he took a random sample of ten government employees and another random sample of ten private sector workers and measured the amount of time (in minutes)they spent in coffee breaks during the day.The results are listed below.Assume that the two populations are normally distributed.
-Estimate with 95% confidence the difference in coffee breaks mean time between the two groups.
____________________ to ____________________
Unlock Deck
Unlock for access to all 149 flashcards in this deck.
Unlock Deck
k this deck
76
NARRBEGIN: Shooting club
A trap and skeet shooting club purchases clay pigeons.These are quite fragile and often break in the box during shipment without any outward sign of breakage.Even as the pigeons are loaded into the throwing machine,broken or cracked pigeons may not be noticed.Each pigeon broken is a net loss to the club so the club is anxious to purchase from suppliers who have a record of little or no breakage in shipping and handling.Two suppliers of clay pigeons are contacted and asked for price quotes.Supplier 1 quotes a higher price than Supplier 2 but says that the higher price is the result of better packaging and thus more usable pigeons per case.The shooting club manager decides to purchase 10 cases from both suppliers.Each case has 250 pigeons.Careful records are maintained on each case as to the number of good pigeons.The records after the cases were used are as follows:
Use Excel or Minitab to summarize this data using descriptive statistics
A trap and skeet shooting club purchases clay pigeons.These are quite fragile and often break in the box during shipment without any outward sign of breakage.Even as the pigeons are loaded into the throwing machine,broken or cracked pigeons may not be noticed.Each pigeon broken is a net loss to the club so the club is anxious to purchase from suppliers who have a record of little or no breakage in shipping and handling.Two suppliers of clay pigeons are contacted and asked for price quotes.Supplier 1 quotes a higher price than Supplier 2 but says that the higher price is the result of better packaging and thus more usable pigeons per case.The shooting club manager decides to purchase 10 cases from both suppliers.Each case has 250 pigeons.Careful records are maintained on each case as to the number of good pigeons.The records after the cases were used are as follows:
Use Excel or Minitab to summarize this data using descriptive statistics
Unlock Deck
Unlock for access to all 149 flashcards in this deck.
Unlock Deck
k this deck
77
NARRBEGIN: Battery
A new brand of battery for use in calculators and cameras is said to last significantly longer than another brand.A camera manufacturer is to test this brand (Y)with brand (X)to see if brand Y has a longer life.If brand Y does last longer,the camera manufacturer will equip their new cameras with them.If not,they will equip them with brand X that is less costly.Twenty cameras are equipped as follows: ten with brand Y batteries and ten with brand X batteries and the life of the batteries measured.Is brand Y superior (does it last longer)to brand X? To answer this question,the camera manufacturer uses a 0.01 significance level and knows that the populations are normally distributed with equal variances.Sample data are:
State the conclusion.
Unlock Deck
Unlock for access to all 149 flashcards in this deck.
Unlock Deck
k this deck
78
Traffic Coordinator
A traffic coordinator for a community wishes to determine whether or not there is any difference in the average age of female and male drivers involved in rear-end accidents.The hypothesis test is: H0: (no difference in mean age)
H1: (mean age is different)A random sample of males and females involved in rear-end accidents results in the following Minitab summary:
-What is the decision rule at the 0.025 level of significance?
Unlock Deck
Unlock for access to all 149 flashcards in this deck.
Unlock Deck
k this deck
79
NARRBEGIN: Battery Manufacturer
A battery manufacturer claims that their new "long-lasting" battery has an average life that is significantly longer than their competitor's "regular" battery.Both types of batteries were tested and the number of hours each battery lasted is shown in the following table.
Assume unequal variances.Using = 0.01,state the decision rule in terms of the critical value.
A battery manufacturer claims that their new "long-lasting" battery has an average life that is significantly longer than their competitor's "regular" battery.Both types of batteries were tested and the number of hours each battery lasted is shown in the following table.
Assume unequal variances.Using
= 0.01,state the decision rule in terms of the critical value. Unlock Deck
Unlock for access to all 149 flashcards in this deck.
Unlock Deck
k this deck
80
NARRBEGIN: Traffic Coordinator
A traffic coordinator for a community wishes to determine whether or not there is any difference in the average age of female and male drivers involved in rear-end accidents.The hypothesis test is: H0: (no difference in mean age)
H1: (mean age is different)A random sample of males and females involved in rear-end accidents results in the following Minitab summary:
What is the conclusion?
A traffic coordinator for a community wishes to determine whether or not there is any difference in the average age of female and male drivers involved in rear-end accidents.The hypothesis test is: H0:
(no difference in mean age)H1:
(mean age is different)A random sample of males and females involved in rear-end accidents results in the following Minitab summary: What is the conclusion?
Unlock Deck
Unlock for access to all 149 flashcards in this deck.
Unlock Deck
k this deck
Unlock Deck
Unlock for access to all 149 flashcards in this deck.


