Deck 11: Financial Statement Analysis
Full screen (f)
Question
Question
Question
Hamilton Corporation reports the following data:  If net sales increases by 15%,and cost of goods sold increases by 20%,gross margin would:
A) increase by 4.6%
B) decrease by 4.6%
C) decrease by 4.4%
D) increase by 4.4%
If net sales increases by 15%,and cost of goods sold increases by 20%,gross margin would:A) increase by 4.6%
B) decrease by 4.6%
C) decrease by 4.4%
D) increase by 4.4%
Question
Given the following data for total sales:  A table showing trend percentages for 2014-2017,respectively,using 2014 as the base year,would show:
A) 100%, 110%, and 95%
B) 100%, 110%, 112%, and 106%
C) 100%, 10%, 2%, and (5%)
D) 94%, 1.04%, 1.06%, and 100%
A table showing trend percentages for 2014-2017,respectively,using 2014 as the base year,would show:A) 100%, 110%, and 95%
B) 100%, 110%, 112%, and 106%
C) 100%, 10%, 2%, and (5%)
D) 94%, 1.04%, 1.06%, and 100%
Question
Prepare a horizontal analysis of the following comparative income statement for Westwind Corporation.Round percentage changes to the nearest one-tenth percent.
 Expenses:

Expenses: Question
Question
Question
Question
Data for the most recent four fiscal years of Burleigh Falls Corp.are given below:
 Required:
a.Prepare an analysis showing the trend percentages for the four-year period using 2014 as the base year.
b.What do the trend percentages indicate regarding Burleigh Falls Corp.'s income statement data?
Required:a.Prepare an analysis showing the trend percentages for the four-year period using 2014 as the base year.
b.What do the trend percentages indicate regarding Burleigh Falls Corp.'s income statement data?
Question
Given the following data:  If net sales decreases by 10%,and cost of goods sold increases by 15%,gross margin would:
A) increase by 40%
B) decrease by 40%
C) increase by 47.5%
D) decrease by 47.5%
If net sales decreases by 10%,and cost of goods sold increases by 15%,gross margin would:A) increase by 40%
B) decrease by 40%
C) increase by 47.5%
D) decrease by 47.5%
Question
Question
Question
Question
Question
Question
Question
Question
Question
Question
Question
Question
Question
Prepare a horizontal analysis for 2017 using the information provided by Rat Rack Incorporated below.What do these numbers tell you about Rat Rack's 2017 year? Using 2015 as the base year for Rat Rack prepare the trend percentages for the three year period 2015-2016.What do these trend percentages indicate about Rat Rack?

Question
Question
Question
Following is a comparative balance sheet for Barking Shark International Corporation:

 Current assets

 Current liabilities

 Shareholders' equity
 Total liabilities and shareholders'
 Required:
a.Calculate and show the percentages that would appear in a horizontal analysis for this balance sheet.
b.Indicate any positive or negative developments from one year to the next.
Current assets Current liabilities Shareholders' equity Total liabilities and shareholders' Required:a.Calculate and show the percentages that would appear in a horizontal analysis for this balance sheet.
b.Indicate any positive or negative developments from one year to the next.
Question
Question
Prepare vertical analysis calculations by filling in the far right column of the following balance sheet with the appropriate percentages.

 Current assets

 Current liabilities

 Shareholders' equity

Current assets Current liabilities Shareholders' equity Question
Question
Question
Question
Question
Question
Question
Question
Question
Question
Question
Question
Prepare a vertical analysis for Young's Point Corporation's balance sheet to determine the component percentages of its assets,liabilities,and shareholders' equity.Round percentages to the nearest one-tenth percent.
 Assets
 Liabilities
 Shareholders' equity

Assets Liabilities Shareholders' equity Question
Question
Question
Horizontal analysis and vertical analysis,including the preparation of common-size financial statements,are important analytical techniques used to evaluate the strength of published financial statements.
Required:
a.Define:
 b.How is each of these techniques helpful in the analysis of financial statements?
Required:
a.Define:
b.How is each of these techniques helpful in the analysis of financial statements? Question
Question
Question
Question
A company reports the following information from the statement of cash flows: 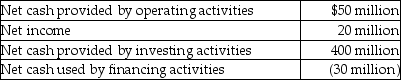 Which line item provides a signal that the company may have cash flow problems?
A) net cash provided by operating activities
B) net income
C) net cash provided by investing activities
D) net cash used by financing activities
Which line item provides a signal that the company may have cash flow problems?A) net cash provided by operating activities
B) net income
C) net cash provided by investing activities
D) net cash used by financing activities
Question
Question
Use the following data to prepare a common-size comparative income statement for Old Mill Corporation on December 31,2017.Round percentages to one-tenth percent.

 Expenses:

Expenses: Question
Question
Question
Question
Following is the income statement for Lovesick Lake Group Inc.,for the year ended December 31,2017:

 Expenses:
 Required:
a.Prepare a vertical analysis of the income statement showing appropriate percentages for each item listed above.Round percentages to one-tenth percent.
b.What additional information would you need to determine whether these percentages are good or bad?
Expenses: Required:a.Prepare a vertical analysis of the income statement showing appropriate percentages for each item listed above.Round percentages to one-tenth percent.
b.What additional information would you need to determine whether these percentages are good or bad?
Question
Prepare vertical analysis calculations by filling in the far right column of the following balance sheet with the appropriate percentages.

 Current assets

 Current liabilities

 Shareholders' equity

Current assets Current liabilities Shareholders' equity Question
Question
Question
Question
Question
Question
Question
The following data represent selected information from the comparative income statement and balance sheet for Hot Rolled Corporation for the years ended December 31,2017 and 2016:  • 10,000 shares of common shares have been issued and outstanding since the company was established.They had a market value of $90 per share on December 31,2016,and they were selling for $91.50 on December 31,2017.
Refer to the table above.The current ratio for Hot Rolled Corporation on December 31,2017,was:
A) 0.80
B) 0.67
C) 1.45
D) 1.26
• 10,000 shares of common shares have been issued and outstanding since the company was established.They had a market value of $90 per share on December 31,2016,and they were selling for $91.50 on December 31,2017.Refer to the table above.The current ratio for Hot Rolled Corporation on December 31,2017,was:
A) 0.80
B) 0.67
C) 1.45
D) 1.26
Question
Question
Question
The following data represent selected information from the comparative income statement and balance sheet for Hot Rolled Corporation for the years ended December 31,2017 and 2016:  •10,000 shares of common shares have been issued and outstanding since the company was established.They had a market value of $90 per share on December 31,2016,and they were selling for $91.50 on December 31,2017.
Refer to the table above.The accounts receivable turnover for Hot Rolled Corporation for the year ended December 31,2017,was:
A) 13.45
B) 13.32
C) 12.33
D) 12.11
•10,000 shares of common shares have been issued and outstanding since the company was established.They had a market value of $90 per share on December 31,2016,and they were selling for $91.50 on December 31,2017.Refer to the table above.The accounts receivable turnover for Hot Rolled Corporation for the year ended December 31,2017,was:
A) 13.45
B) 13.32
C) 12.33
D) 12.11
Question
Question
The following data represent selected information from the comparative income statement and balance sheet for Hot Rolled Corporation for the years ended December 31,2017 and 2016: 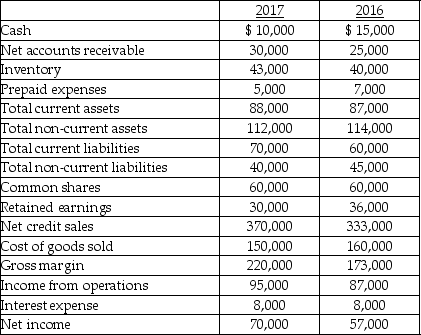 •10,000 shares of common shares have been issued and outstanding since the company was established.They had a market value of $90 per share on December 31,2016,and they were selling for $91.50 on December 31,2017.
Refer to the table above.The acid-test ratio for Hot Rolled Corporation on December 31,2016,was:
A) 0.67
B) 0.57
C) 1.26
D) 1.45
•10,000 shares of common shares have been issued and outstanding since the company was established.They had a market value of $90 per share on December 31,2016,and they were selling for $91.50 on December 31,2017.Refer to the table above.The acid-test ratio for Hot Rolled Corporation on December 31,2016,was:
A) 0.67
B) 0.57
C) 1.26
D) 1.45
Question
Question
Question
Question
Question
Question
Question
Question
Question
Question
Question
The following data represent selected information from the comparative income statement and balance sheet for Hot Rolled Corporation for the years ended December 31,2017 and 2016:  •10,000 shares of common shares have been issued and outstanding since the company was established.They had a market value of $90 per share on December 31,2016,and they were selling for $91.50 on December 31,2017.
Refer to the table above.The inventory turnover for Hot Rolled Corporation for the year ended December 31,2017,was:
A) 4.00
B) 3.86
C) 3.61
D) 3.49
•10,000 shares of common shares have been issued and outstanding since the company was established.They had a market value of $90 per share on December 31,2016,and they were selling for $91.50 on December 31,2017.Refer to the table above.The inventory turnover for Hot Rolled Corporation for the year ended December 31,2017,was:
A) 4.00
B) 3.86
C) 3.61
D) 3.49
Question
Discuss any strengths and/or weaknesses disclosed by the following cash flow statement:
 Operating activities:
 Investing activities:
 Financing activities:

Operating activities: Investing activities: Financing activities: Question
Question

Unlock Deck
Sign up to unlock the cards in this deck!
Unlock Deck
Unlock Deck
1/116
Play
Full screen (f)
Deck 11: Financial Statement Analysis
1
Horizontal analysis involves the study of:
A) percentage changes in comparative financial statements
B) percentage and/or dollar amount changes in various financial statement amounts from year to year
C) the change in key financial statement ratios over a certain time frame or horizon
D) the changes in individual financial statement amounts as a percentage of some related total
A
2
A company reported $75,000 of income for 2015,$80,000 for 2016,and $90,000 for 2017.The percentage change in net income from 2016 to 2017 was:
A) 9.1%
B) 11.1%
C) 12.5%
D) 16.7%
A) 9.1%
B) 11.1%
C) 12.5%
D) 16.7%
C
3
Hamilton Corporation reports the following data: If net sales increases by 15%,and cost of goods sold increases by 20%,gross margin would:
A) increase by 4.6%
B) decrease by 4.6%
C) decrease by 4.4%
D) increase by 4.4%
If net sales increases by 15%,and cost of goods sold increases by 20%,gross margin would:A) increase by 4.6%
B) decrease by 4.6%
C) decrease by 4.4%
D) increase by 4.4%
A
4
Given the following data for total sales: A table showing trend percentages for 2014-2017,respectively,using 2014 as the base year,would show:
A) 100%, 110%, and 95%
B) 100%, 110%, 112%, and 106%
C) 100%, 10%, 2%, and (5%)
D) 94%, 1.04%, 1.06%, and 100%
A table showing trend percentages for 2014-2017,respectively,using 2014 as the base year,would show:A) 100%, 110%, and 95%
B) 100%, 110%, 112%, and 106%
C) 100%, 10%, 2%, and (5%)
D) 94%, 1.04%, 1.06%, and 100%
Unlock Deck
Unlock for access to all 116 flashcards in this deck.
Unlock Deck
k this deck
5
Prepare a horizontal analysis of the following comparative income statement for Westwind Corporation.Round percentage changes to the nearest one-tenth percent.
Expenses:
Expenses: Unlock Deck
Unlock for access to all 116 flashcards in this deck.
Unlock Deck
k this deck
6
Horizontal analysis is the study of percentage changes in financial statement balances from one year to the next.
Unlock Deck
Unlock for access to all 116 flashcards in this deck.
Unlock Deck
k this deck
7
The form of analysis that looks at trend percentages over a representative period is known as:
A) trend analysis, which is considered a form of horizontal analysis
B) trend analysis, which is considered a form of vertical analysis
C) ratio analysis
D) economic value added analysis
A) trend analysis, which is considered a form of horizontal analysis
B) trend analysis, which is considered a form of vertical analysis
C) ratio analysis
D) economic value added analysis
Unlock Deck
Unlock for access to all 116 flashcards in this deck.
Unlock Deck
k this deck
8
A company reported $75,000 of income for 2015,$80,000 for 2016,and $90,000 for 2017.The percentage change in net income from 2015 to 2016 was:
A) 6.7%
B) 6.25%
C) 5.9%
D) 10.7%
A) 6.7%
B) 6.25%
C) 5.9%
D) 10.7%
Unlock Deck
Unlock for access to all 116 flashcards in this deck.
Unlock Deck
k this deck
9
Data for the most recent four fiscal years of Burleigh Falls Corp.are given below:
Required:
a.Prepare an analysis showing the trend percentages for the four-year period using 2014 as the base year.
b.What do the trend percentages indicate regarding Burleigh Falls Corp.'s income statement data?
Required:a.Prepare an analysis showing the trend percentages for the four-year period using 2014 as the base year.
b.What do the trend percentages indicate regarding Burleigh Falls Corp.'s income statement data?
Unlock Deck
Unlock for access to all 116 flashcards in this deck.
Unlock Deck
k this deck
10
Given the following data: If net sales decreases by 10%,and cost of goods sold increases by 15%,gross margin would:
A) increase by 40%
B) decrease by 40%
C) increase by 47.5%
D) decrease by 47.5%
If net sales decreases by 10%,and cost of goods sold increases by 15%,gross margin would:A) increase by 40%
B) decrease by 40%
C) increase by 47.5%
D) decrease by 47.5%
Unlock Deck
Unlock for access to all 116 flashcards in this deck.
Unlock Deck
k this deck
11
The percentage change in any individual item shown on comparative financial statements is calculated by dividing the dollar amount of the change from the base period to the current period by:
A) 100
B) the amount shown for the current period
C) the average of the amounts shown for the base and the current periods
D) the base-period amount
A) 100
B) the amount shown for the current period
C) the average of the amounts shown for the base and the current periods
D) the base-period amount
Unlock Deck
Unlock for access to all 116 flashcards in this deck.
Unlock Deck
k this deck
12
The analysis of trend percentages is a form of vertical analysis.
Unlock Deck
Unlock for access to all 116 flashcards in this deck.
Unlock Deck
k this deck
13
Which of the following would be most likely to reveal that cost of goods sold increased by $75,000 from 2016 to 2017?
A) horizontal analysis
B) trend analysis
C) vertical analysis
D) ratio analysis
A) horizontal analysis
B) trend analysis
C) vertical analysis
D) ratio analysis
Unlock Deck
Unlock for access to all 116 flashcards in this deck.
Unlock Deck
k this deck
14
Which of the following would be most likely to reveal that cost of goods sold is 125% of the amount shown for a base year?
A) trend analysis
B) ratio analysis
C) vertical analysis
D) horizontal analysis
A) trend analysis
B) ratio analysis
C) vertical analysis
D) horizontal analysis
Unlock Deck
Unlock for access to all 116 flashcards in this deck.
Unlock Deck
k this deck
15
When calculating trend percentages,all percentages shown are relative to:
A) the current year
B) the base year
C) the immediately preceding year
D) the average index calculated for all the years shown
A) the current year
B) the base year
C) the immediately preceding year
D) the average index calculated for all the years shown
Unlock Deck
Unlock for access to all 116 flashcards in this deck.
Unlock Deck
k this deck
16
The percentage change in financial statement balances is computed by dividing the dollar amount of the change from the base (earlier)period to the later period by the base-period amount.
Unlock Deck
Unlock for access to all 116 flashcards in this deck.
Unlock Deck
k this deck
17
The analysis of percentage changes in comparative statements is known as:
A) economic value added analysis
B) benchmarking analysis
C) horizontal analysis
D) vertical analysis
A) economic value added analysis
B) benchmarking analysis
C) horizontal analysis
D) vertical analysis
Unlock Deck
Unlock for access to all 116 flashcards in this deck.
Unlock Deck
k this deck
18
It is generally considered more useful to know the absolute dollar amount of change in financial statement amounts from year to year than to know the percentage change.
Unlock Deck
Unlock for access to all 116 flashcards in this deck.
Unlock Deck
k this deck
19
Most investors only need one year's worth of financial information to evaluate an organization.
Unlock Deck
Unlock for access to all 116 flashcards in this deck.
Unlock Deck
k this deck
20
Most financial analyses cover trends of three,five,or even 10 years.
Unlock Deck
Unlock for access to all 116 flashcards in this deck.
Unlock Deck
k this deck
21
Vertical analysis looks at:
A) percentage changes in the balances shown in comparative financial statements
B) the change in key financial statement ratios over a specified period of time
C) the dollar amount of the change in various financial statement amounts from year to year
D) individual financial statement items expressed as a percentage of a base (which represents 100%)
Unlock Deck
Unlock for access to all 116 flashcards in this deck.
Unlock Deck
k this deck
22
When performing vertical analysis on a balance,cash is compared to the total current assets figure.
Unlock Deck
Unlock for access to all 116 flashcards in this deck.
Unlock Deck
k this deck
23
Prepare a horizontal analysis for 2017 using the information provided by Rat Rack Incorporated below.What do these numbers tell you about Rat Rack's 2017 year? Using 2015 as the base year for Rat Rack prepare the trend percentages for the three year period 2015-2016.What do these trend percentages indicate about Rat Rack?
Unlock Deck
Unlock for access to all 116 flashcards in this deck.
Unlock Deck
k this deck
24
When performing vertical analysis on a balance,share capital is calculated as a percentage of total shareholders' equity.
Unlock Deck
Unlock for access to all 116 flashcards in this deck.
Unlock Deck
k this deck
25
When performing vertical analysis of an income statement,net income is usually used as the base.
Unlock Deck
Unlock for access to all 116 flashcards in this deck.
Unlock Deck
k this deck
26
Following is a comparative balance sheet for Barking Shark International Corporation:
Current assets
Current liabilities
Shareholders' equity
Total liabilities and shareholders'
Required:
a.Calculate and show the percentages that would appear in a horizontal analysis for this balance sheet.
b.Indicate any positive or negative developments from one year to the next.
Current assets Current liabilities Shareholders' equity Total liabilities and shareholders' Required:a.Calculate and show the percentages that would appear in a horizontal analysis for this balance sheet.
b.Indicate any positive or negative developments from one year to the next.
Unlock Deck
Unlock for access to all 116 flashcards in this deck.
Unlock Deck
k this deck
27
When performing vertical analysis on a balance,the current liabilities are compared typically to total liabilities.
Unlock Deck
Unlock for access to all 116 flashcards in this deck.
Unlock Deck
k this deck
28
Prepare vertical analysis calculations by filling in the far right column of the following balance sheet with the appropriate percentages.
Current assets
Current liabilities
Shareholders' equity
Current assets Current liabilities Shareholders' equity Unlock Deck
Unlock for access to all 116 flashcards in this deck.
Unlock Deck
k this deck
29
Assume you are using net sales as the base in vertical analysis.Cost of goods sold in 2016 is 67%,and is 70% in 2017.This would always indicate that:
A) gross margin has declined
B) cost of goods sold as a percentage of net sales has increased
C) the dollar amount of cost of goods sold has increased
D) gross margin has declined, cost of goods sold as a percentage of net sales has increased, and the dollar amount of cost of goods sold has increased
Unlock Deck
Unlock for access to all 116 flashcards in this deck.
Unlock Deck
k this deck
30
When performing vertical analysis of an income statement,which of the following is usually used as the base?
A) gross sales
B) net sales
C) net income
D) gross margin
A) gross sales
B) net sales
C) net income
D) gross margin
Unlock Deck
Unlock for access to all 116 flashcards in this deck.
Unlock Deck
k this deck
31
When performing vertical analysis on a balance,accounts receivable is calculated as a percentage of total assets.
Unlock Deck
Unlock for access to all 116 flashcards in this deck.
Unlock Deck
k this deck
32
When performing vertical analysis on a balance,non-current debt is calculated as a percentage of total liabilities and shareholders' equity.
Unlock Deck
Unlock for access to all 116 flashcards in this deck.
Unlock Deck
k this deck
33
If the assets shown on a balance sheet are subjected to vertical analysis (using total assets as the base),an increase in the figure for non-current assets from 40% to 55% would always mean that:
A) total non-current assets have increased as a percentage of total assets
B) the dollar amount of current assets has decreased
C) total current assets have decreased as a percentage of total assets
D) total non-current assets have increased as a percentage of total assets and total current assets have decreased as a percentage of total assets
Unlock Deck
Unlock for access to all 116 flashcards in this deck.
Unlock Deck
k this deck
34
If a balance sheet is subjected to vertical analysis which shows that current assets (using total assets as the base)have decreased from 53% to 36%,this would always mean that:
A) the dollar amount of current assets has decreased
B) current assets have decreased as a percentage of total assets
C) the dollar amount of total assets has decreased
D) the dollar amount of total assets has increased
A) the dollar amount of current assets has decreased
B) current assets have decreased as a percentage of total assets
C) the dollar amount of total assets has decreased
D) the dollar amount of total assets has increased
Unlock Deck
Unlock for access to all 116 flashcards in this deck.
Unlock Deck
k this deck
35
Assume you are using total assets as the base in vertical analysis.Current assets in 2016 are 42%,and are 36% in 2017.This would always indicate that:
A) the current ratio has decreased
B) the dollar amount of current assets has decreased
C) total non-current assets have increased as a percentage of total assets
D) the dollar amount of non-current assets has increased
A) the current ratio has decreased
B) the dollar amount of current assets has decreased
C) total non-current assets have increased as a percentage of total assets
D) the dollar amount of non-current assets has increased
Unlock Deck
Unlock for access to all 116 flashcards in this deck.
Unlock Deck
k this deck
36
Expressing gross margin for 2017 as a percentage of net sales in 2017 is an example of:
A) vertical analysis
B) horizontal analysis
C) ratio analysis
D) economic value added
A) vertical analysis
B) horizontal analysis
C) ratio analysis
D) economic value added
Unlock Deck
Unlock for access to all 116 flashcards in this deck.
Unlock Deck
k this deck
37
Vertical analysis could be used to determine what is happening to cost of goods sold from one year to the next.
Unlock Deck
Unlock for access to all 116 flashcards in this deck.
Unlock Deck
k this deck
38
Vertical analysis highlights changes in an item on the financial statements over time.
Unlock Deck
Unlock for access to all 116 flashcards in this deck.
Unlock Deck
k this deck
39
When performing vertical analysis,each financial statement item is shown as a percentage of the base amount.
Unlock Deck
Unlock for access to all 116 flashcards in this deck.
Unlock Deck
k this deck
40
Prepare a vertical analysis for Young's Point Corporation's balance sheet to determine the component percentages of its assets,liabilities,and shareholders' equity.Round percentages to the nearest one-tenth percent.
Assets
Liabilities
Shareholders' equity
Assets Liabilities Shareholders' equity Unlock Deck
Unlock for access to all 116 flashcards in this deck.
Unlock Deck
k this deck
41
On a statement of cash flows,which of the following is a sign of a healthy company?
A) Investing activities include more sales of long-term assets than purchases.
B) Financing activities are dominated by borrowing.
C) Operating activities are the major source of cash.
D) Net cash provided by operating activities is less than net income.
A) Investing activities include more sales of long-term assets than purchases.
B) Financing activities are dominated by borrowing.
C) Operating activities are the major source of cash.
D) Net cash provided by operating activities is less than net income.
Unlock Deck
Unlock for access to all 116 flashcards in this deck.
Unlock Deck
k this deck
42
Common-size financial statements represent a form of:
A) ratio analysis
B) vertical analysis
C) trend analysis
D) horizontal analysis
A) ratio analysis
B) vertical analysis
C) trend analysis
D) horizontal analysis
Unlock Deck
Unlock for access to all 116 flashcards in this deck.
Unlock Deck
k this deck
43
Horizontal analysis and vertical analysis,including the preparation of common-size financial statements,are important analytical techniques used to evaluate the strength of published financial statements.
Required:
a.Define:
b.How is each of these techniques helpful in the analysis of financial statements?
Required:
a.Define:
b.How is each of these techniques helpful in the analysis of financial statements? Unlock Deck
Unlock for access to all 116 flashcards in this deck.
Unlock Deck
k this deck
44
A common size statement aids in comparing different companies as their amounts are stated in percentages of the total base rather than numbers.
Unlock Deck
Unlock for access to all 116 flashcards in this deck.
Unlock Deck
k this deck
45
Which of the following would be most likely to reveal that net income represented 7% of total net sales in 2017,but only 4% in 2016?
A) common-size financial statements
B) horizontal analysis
C) trend analysis
D) ratio analysis
A) common-size financial statements
B) horizontal analysis
C) trend analysis
D) ratio analysis
Unlock Deck
Unlock for access to all 116 flashcards in this deck.
Unlock Deck
k this deck
46
Of the items listed below,the one most helpful in the comparison of different size companies is:
A) horizontal analysis
B) comparison of their net incomes
C) preparation of common-size financial statements
D) comparison of their working capital balances
A) horizontal analysis
B) comparison of their net incomes
C) preparation of common-size financial statements
D) comparison of their working capital balances
Unlock Deck
Unlock for access to all 116 flashcards in this deck.
Unlock Deck
k this deck
47
A company reports the following information from the statement of cash flows: Which line item provides a signal that the company may have cash flow problems?
A) net cash provided by operating activities
B) net income
C) net cash provided by investing activities
D) net cash used by financing activities
Which line item provides a signal that the company may have cash flow problems?A) net cash provided by operating activities
B) net income
C) net cash provided by investing activities
D) net cash used by financing activities
Unlock Deck
Unlock for access to all 116 flashcards in this deck.
Unlock Deck
k this deck
48
A common size statement reports each item as a percentage of the previous years figure.
Unlock Deck
Unlock for access to all 116 flashcards in this deck.
Unlock Deck
k this deck
49
Use the following data to prepare a common-size comparative income statement for Old Mill Corporation on December 31,2017.Round percentages to one-tenth percent.
Expenses:
Expenses: Unlock Deck
Unlock for access to all 116 flashcards in this deck.
Unlock Deck
k this deck
50
On a statement of cash flows of a healthy company,net income would ordinarily be:
A) less than depreciation expense
B) more than depreciation expense
C) greater than Net cash provided by operating activities
D) less than Net cash provided by operating activities
A) less than depreciation expense
B) more than depreciation expense
C) greater than Net cash provided by operating activities
D) less than Net cash provided by operating activities
Unlock Deck
Unlock for access to all 116 flashcards in this deck.
Unlock Deck
k this deck
51
Bench marking involves comparing your company's results to a standard set by other.
Unlock Deck
Unlock for access to all 116 flashcards in this deck.
Unlock Deck
k this deck
52
Benchmarking is the practice of comparing a company to a standard set by other companies with similar characteristics.
Unlock Deck
Unlock for access to all 116 flashcards in this deck.
Unlock Deck
k this deck
53
Following is the income statement for Lovesick Lake Group Inc.,for the year ended December 31,2017:
Expenses:
Required:
a.Prepare a vertical analysis of the income statement showing appropriate percentages for each item listed above.Round percentages to one-tenth percent.
b.What additional information would you need to determine whether these percentages are good or bad?
Expenses: Required:a.Prepare a vertical analysis of the income statement showing appropriate percentages for each item listed above.Round percentages to one-tenth percent.
b.What additional information would you need to determine whether these percentages are good or bad?
Unlock Deck
Unlock for access to all 116 flashcards in this deck.
Unlock Deck
k this deck
54
Prepare vertical analysis calculations by filling in the far right column of the following balance sheet with the appropriate percentages.
Current assets
Current liabilities
Shareholders' equity
Current assets Current liabilities Shareholders' equity Unlock Deck
Unlock for access to all 116 flashcards in this deck.
Unlock Deck
k this deck
55
Analysts find the cash flow statement more helpful for spotting weakness in a company than for gauging success.
Unlock Deck
Unlock for access to all 116 flashcards in this deck.
Unlock Deck
k this deck
56
Common-size financial statements may identify the need for corrective action.
Unlock Deck
Unlock for access to all 116 flashcards in this deck.
Unlock Deck
k this deck
57
Analyzing the cash flow statement may help analysts determine the financial health of a company.Which of the following signs below is not an indicator of a financially healthy company?
A) The company's operations are a major source (not a use) of cash.
B) The company's operations are a major use (not a source) of cash.
C) The company's investing activities include more purchases than sales of non-current assets.
D) The company's financing activities are not dominated by borrowing.
Unlock Deck
Unlock for access to all 116 flashcards in this deck.
Unlock Deck
k this deck
58
Benchmarking is the process of comparing a company to a standard set by one or more other companies,with a view toward improvement.
Unlock Deck
Unlock for access to all 116 flashcards in this deck.
Unlock Deck
k this deck
59
A common-size statement eases the comparison of different companies because their amounts are stated in percentages.
Unlock Deck
Unlock for access to all 116 flashcards in this deck.
Unlock Deck
k this deck
60
Common size statements include the relation of each item on the statement of earnings to net sales.
Unlock Deck
Unlock for access to all 116 flashcards in this deck.
Unlock Deck
k this deck
61
The following data represent selected information from the comparative income statement and balance sheet for Hot Rolled Corporation for the years ended December 31,2017 and 2016: • 10,000 shares of common shares have been issued and outstanding since the company was established.They had a market value of $90 per share on December 31,2016,and they were selling for $91.50 on December 31,2017.
Refer to the table above.The current ratio for Hot Rolled Corporation on December 31,2017,was:
A) 0.80
B) 0.67
C) 1.45
D) 1.26
• 10,000 shares of common shares have been issued and outstanding since the company was established.They had a market value of $90 per share on December 31,2016,and they were selling for $91.50 on December 31,2017.Refer to the table above.The current ratio for Hot Rolled Corporation on December 31,2017,was:
A) 0.80
B) 0.67
C) 1.45
D) 1.26
Unlock Deck
Unlock for access to all 116 flashcards in this deck.
Unlock Deck
k this deck
62
The rate of return on net sales is calculated as:
A) gross margin / net sales
B) net income / net sales
C) operating income / net sales
D) dividends paid during the year / net sales
A) gross margin / net sales
B) net income / net sales
C) operating income / net sales
D) dividends paid during the year / net sales
Unlock Deck
Unlock for access to all 116 flashcards in this deck.
Unlock Deck
k this deck
63
Which of the following statements about inventory turnover is most appropriate?
A) Companies generally strive to have the highest possible inventory turnover ratio.
B) A high ratio indicates the company is having trouble selling its inventory.
C) The most profitable turnover ratio may not necessarily be the highest.
D) A low ratio generally means the company is not keeping enough inventory on hand.
Unlock Deck
Unlock for access to all 116 flashcards in this deck.
Unlock Deck
k this deck
64
The following data represent selected information from the comparative income statement and balance sheet for Hot Rolled Corporation for the years ended December 31,2017 and 2016: •10,000 shares of common shares have been issued and outstanding since the company was established.They had a market value of $90 per share on December 31,2016,and they were selling for $91.50 on December 31,2017.
Refer to the table above.The accounts receivable turnover for Hot Rolled Corporation for the year ended December 31,2017,was:
A) 13.45
B) 13.32
C) 12.33
D) 12.11
•10,000 shares of common shares have been issued and outstanding since the company was established.They had a market value of $90 per share on December 31,2016,and they were selling for $91.50 on December 31,2017.Refer to the table above.The accounts receivable turnover for Hot Rolled Corporation for the year ended December 31,2017,was:
A) 13.45
B) 13.32
C) 12.33
D) 12.11
Unlock Deck
Unlock for access to all 116 flashcards in this deck.
Unlock Deck
k this deck
65
If all else is held equal,an increase in the current ratio of a company is generally considered to be:
A) an indication that current assets have decreased
B) an indication that current liabilities have increased
C) an indication that the company will have increased difficulty meeting short-term obligations
D) an indication that the company will be better able to meet short-term debt obligations
A) an indication that current assets have decreased
B) an indication that current liabilities have increased
C) an indication that the company will have increased difficulty meeting short-term obligations
D) an indication that the company will be better able to meet short-term debt obligations
Unlock Deck
Unlock for access to all 116 flashcards in this deck.
Unlock Deck
k this deck
66
The following data represent selected information from the comparative income statement and balance sheet for Hot Rolled Corporation for the years ended December 31,2017 and 2016: •10,000 shares of common shares have been issued and outstanding since the company was established.They had a market value of $90 per share on December 31,2016,and they were selling for $91.50 on December 31,2017.
Refer to the table above.The acid-test ratio for Hot Rolled Corporation on December 31,2016,was:
A) 0.67
B) 0.57
C) 1.26
D) 1.45
•10,000 shares of common shares have been issued and outstanding since the company was established.They had a market value of $90 per share on December 31,2016,and they were selling for $91.50 on December 31,2017.Refer to the table above.The acid-test ratio for Hot Rolled Corporation on December 31,2016,was:
A) 0.67
B) 0.57
C) 1.26
D) 1.45
Unlock Deck
Unlock for access to all 116 flashcards in this deck.
Unlock Deck
k this deck
67
The current ratio is calculated as:
A) total assets / total liabilities
B) current assets / total liabilities
C) current assets × current liabilities
D) current assets / current liabilities
A) total assets / total liabilities
B) current assets / total liabilities
C) current assets × current liabilities
D) current assets / current liabilities
Unlock Deck
Unlock for access to all 116 flashcards in this deck.
Unlock Deck
k this deck
68
The times-interest-earned ratio is calculated as:
A) income from operations / interest expense
B) net income / interest expense
C) net income after taxes + interest expense/interest expense
D) income from operations - interest expense/interest expense
A) income from operations / interest expense
B) net income / interest expense
C) net income after taxes + interest expense/interest expense
D) income from operations - interest expense/interest expense
Unlock Deck
Unlock for access to all 116 flashcards in this deck.
Unlock Deck
k this deck
69
Yukon Company has total current liabilities equal to $600,000 and working capital of $30,000.North Company has the same amount of working capital,but it has total current liabilities of $40,000.The company with the better working capital position is:
A) North Company
B) Yukon Company
C) They both have exactly the same working capital position.
D) indeterminable with the information given
A) North Company
B) Yukon Company
C) They both have exactly the same working capital position.
D) indeterminable with the information given
Unlock Deck
Unlock for access to all 116 flashcards in this deck.
Unlock Deck
k this deck
70
Assume a company's current ratio is less than one.If the company pays current liabilities with cash,the new current ratio will:
A) increase
B) decrease
C) remain the same
D) cannot be determined with the information given
A) increase
B) decrease
C) remain the same
D) cannot be determined with the information given
Unlock Deck
Unlock for access to all 116 flashcards in this deck.
Unlock Deck
k this deck
71
A very high accounts receivable turnover would most likely indicate that:
A) net credit sales for the year have been understated
B) policies for extending credit to customers are too tight
C) accounts receivable balances have been overstated
D) the company is unsuccessful in its efforts to collect cash from customers
A) net credit sales for the year have been understated
B) policies for extending credit to customers are too tight
C) accounts receivable balances have been overstated
D) the company is unsuccessful in its efforts to collect cash from customers
Unlock Deck
Unlock for access to all 116 flashcards in this deck.
Unlock Deck
k this deck
72
Which of the following statements about current ratios is most appropriate?
A) The determination of whether a current ratio is acceptable is best made by reference to industry norms.
B) A current ratio less than 1.5 is unacceptable.
C) A current ratio greater than 1.0 is excellent.
D) The determination of whether a current ratio is acceptable is best made by reference to industry norms, a current ratio less than 1.5 is unacceptable and a current ratio greater than 1.0 is excellent.
Unlock Deck
Unlock for access to all 116 flashcards in this deck.
Unlock Deck
k this deck
73
Trent Corporation has total current assets equal to $50,000 and working capital of $20,000.Fleming Company has the same amount of working capital,but it has total current assets of $300,000.The company with the better working capital position is:
A) Fleming Company
B) Trent Corporation
C) They both have equally good working capital positions.
D) indeterminable with the information given
A) Fleming Company
B) Trent Corporation
C) They both have equally good working capital positions.
D) indeterminable with the information given
Unlock Deck
Unlock for access to all 116 flashcards in this deck.
Unlock Deck
k this deck
74
Identify three cash flow signs of a healthy company.
Unlock Deck
Unlock for access to all 116 flashcards in this deck.
Unlock Deck
k this deck
75
Accounts receivable turnover is calculated as:
A) total cost of goods sold / 365 days
B) total net credit sales / average net accounts receivable
C) average net accounts receivable / 365 days
D) total net credit sales / cost of goods sold
A) total cost of goods sold / 365 days
B) total net credit sales / average net accounts receivable
C) average net accounts receivable / 365 days
D) total net credit sales / cost of goods sold
Unlock Deck
Unlock for access to all 116 flashcards in this deck.
Unlock Deck
k this deck
76
Inventory turnover is calculated as:
A) average inventory for the period / cost of goods sold
B) cost of goods sold / average inventory for the period
C) gross margin for the period / average inventory for the period
D) average inventory for the period / gross margin for the period
A) average inventory for the period / cost of goods sold
B) cost of goods sold / average inventory for the period
C) gross margin for the period / average inventory for the period
D) average inventory for the period / gross margin for the period
Unlock Deck
Unlock for access to all 116 flashcards in this deck.
Unlock Deck
k this deck
77
The following data represent selected information from the comparative income statement and balance sheet for Hot Rolled Corporation for the years ended December 31,2017 and 2016: •10,000 shares of common shares have been issued and outstanding since the company was established.They had a market value of $90 per share on December 31,2016,and they were selling for $91.50 on December 31,2017.
Refer to the table above.The inventory turnover for Hot Rolled Corporation for the year ended December 31,2017,was:
A) 4.00
B) 3.86
C) 3.61
D) 3.49
•10,000 shares of common shares have been issued and outstanding since the company was established.They had a market value of $90 per share on December 31,2016,and they were selling for $91.50 on December 31,2017.Refer to the table above.The inventory turnover for Hot Rolled Corporation for the year ended December 31,2017,was:
A) 4.00
B) 3.86
C) 3.61
D) 3.49
Unlock Deck
Unlock for access to all 116 flashcards in this deck.
Unlock Deck
k this deck
78
Discuss any strengths and/or weaknesses disclosed by the following cash flow statement:
Operating activities:
Investing activities:
Financing activities:
Operating activities: Investing activities: Financing activities: Unlock Deck
Unlock for access to all 116 flashcards in this deck.
Unlock Deck
k this deck
79
Working capital is defined as:
A) current liabilities - current assets
B) current assets - current liabilities
C) total assets - total liabilities
D) current assets + current liabilities
A) current liabilities - current assets
B) current assets - current liabilities
C) total assets - total liabilities
D) current assets + current liabilities
Unlock Deck
Unlock for access to all 116 flashcards in this deck.
Unlock Deck
k this deck
80
Which of the following ratios measures profitability?
A) rate of return on total assets
B) times-interest-earned ratio
C) inventory turnover
D) book value per share of common shares
A) rate of return on total assets
B) times-interest-earned ratio
C) inventory turnover
D) book value per share of common shares
Unlock Deck
Unlock for access to all 116 flashcards in this deck.
Unlock Deck
k this deck
Unlock Deck
Unlock for access to all 116 flashcards in this deck.


