Deck 8: Productivity and Growth
Full screen (f)
Question
Question
The figure below shows a per-worker production function.A technological improvement would make Point C attainable.
Figure 8.2

Figure 8.2
Question
Question
Question
Question
Question
Question
Question
Question
Question
Question
Question
Question
Question
The figure below shows a per-worker production function.Point C in the figure below represents the level of output per worker that is unattainable with current technology.
Figure 8.2
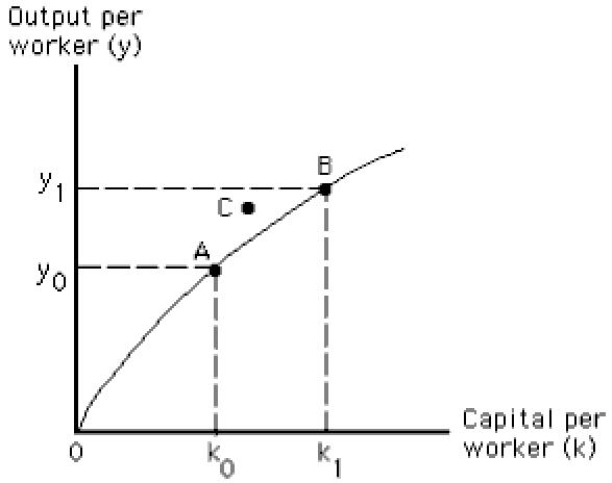
Figure 8.2
Question
The figure below shows a per-worker production function.The bowed shape of the per-worker production function illustrates the law of diminishing returns to scale.
Figure 8.2

Figure 8.2
Question
Question
Question
Question
The figure below shows a per-worker production function.The shape of the per-worker production function illustrates the law of diminishing marginal returns to labor.
Figure 8.2

Figure 8.2
Question
Question
Question
Question
Question
Question
Question
Question
Question
Question
Question
Question
Question
Question
Question
Question
Question
Question
Question
Question
Question
Question
Question
Question
Question
Question
Question
Question
Question
Question
Question
Question
Question
Question
Question
Question
Question
Question
Question
Question
Question
Question
Question
Question
Question
Question
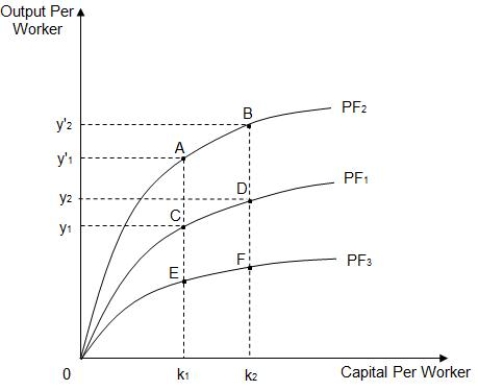
The figure below shows three different per-worker production functions: PF1,PF2,and PF3.The diminishing slopes of the curves reflect _____.
Figure 8.1
A)increasing returns to scale
B)increasing marginal returns from capital
C)diminishing marginal returns from capital
D)decreasing returns to scale
E)diminishing marginal returns from labor
Figure 8.1
A)increasing returns to scale
B)increasing marginal returns from capital
C)diminishing marginal returns from capital
D)decreasing returns to scale
E)diminishing marginal returns from labor
Question
The figure below shows three different per-worker production functions: PF1,PF2,and PF3.If PF1 is the initial per-worker production function for a farm,which of the following reflects an increase in the number of tractors per worker in the farm?
Figure 8.1

A)A movement from point D to point C
B)An upward shift from PF1 to PF2
C)A downward shift from PF1 to PF3
D)A movement from point C to point D
E)A movement from point D to point B
Figure 8.1
A)A movement from point D to point C
B)An upward shift from PF1 to PF2
C)A downward shift from PF1 to PF3
D)A movement from point C to point D
E)A movement from point D to point B
Question
Question
Question
Question
Question
Question
Question
Question
The movement from point A to point B in the figure below illustrates the effect of:
Figure 8.1

A)an increase in the capital stock relative to the workforce.
B)an increase in the labor productivity growth rate.
C)an increase in labor productivity because of higher quality capital.
D)a decrease in labor productivity.
E)a decrease in the capital stock.
Figure 8.1
A)an increase in the capital stock relative to the workforce.
B)an increase in the labor productivity growth rate.
C)an increase in labor productivity because of higher quality capital.
D)a decrease in labor productivity.
E)a decrease in the capital stock.
Question
The figure below shows three different per-worker production functions: PF1,PF2,and PF3.If PF1 is the initial per-worker production function,which of the following reflects the impact of an increase in the level of technology?
Figure 8.1

A)A movement from point D to point C
B)An upward shift from PF1 to PF2
C)A downward shift from PF1 to PF3
D)A movement from point C to point D
E)A movement from point D to point F
Figure 8.1
A)A movement from point D to point C
B)An upward shift from PF1 to PF2
C)A downward shift from PF1 to PF3
D)A movement from point C to point D
E)A movement from point D to point F
Question
Question
Question
Question

Unlock Deck
Sign up to unlock the cards in this deck!
Unlock Deck
Unlock Deck
1/150
Play
Full screen (f)
Deck 8: Productivity and Growth
1
Since 1870,U.S.labor productivity growth has averaged roughly 2.1 percent annually.
True
2
The figure below shows a per-worker production function.A technological improvement would make Point C attainable.
Figure 8.2
Figure 8.2
True
3
Improvements in technology shift the per-worker production function downward.
False
4
Between the 1880s and the early 21st century,U.S.productivity increased at a constant annual rate.
Unlock Deck
Unlock for access to all 150 flashcards in this deck.
Unlock Deck
k this deck
5
The productivity of land is the most important factor that determines the standard of living of a country.
Unlock Deck
Unlock for access to all 150 flashcards in this deck.
Unlock Deck
k this deck
6
Education makes workers aware of the latest production techniques and more receptive to new approaches and methods.
Unlock Deck
Unlock for access to all 150 flashcards in this deck.
Unlock Deck
k this deck
7
The most important factor in determining a nation's standard of living in the long run is the productivity of its resources.
Unlock Deck
Unlock for access to all 150 flashcards in this deck.
Unlock Deck
k this deck
8
If the ratio of labor to capital increases,we can expect that labor productivity will increase.
Unlock Deck
Unlock for access to all 150 flashcards in this deck.
Unlock Deck
k this deck
9
Labor productivity tends to fall as the capital to labor ratio rises.
Unlock Deck
Unlock for access to all 150 flashcards in this deck.
Unlock Deck
k this deck
10
Productivity is measured as output per unit of productive input.
Unlock Deck
Unlock for access to all 150 flashcards in this deck.
Unlock Deck
k this deck
11
Human capital includes the machinery,equipment,and other manufactured creations used to produce goods and services.
Unlock Deck
Unlock for access to all 150 flashcards in this deck.
Unlock Deck
k this deck
12
Productivity growth in the U.S.averaged approximately 3 percent per year between 1947 and 1973; it has averaged approximately 5 percent annually since then.
Unlock Deck
Unlock for access to all 150 flashcards in this deck.
Unlock Deck
k this deck
13
An increase in the production of capital goods and a reduction in the production of consumer goods would most likely lead to a faster rate of future economic growth.
Unlock Deck
Unlock for access to all 150 flashcards in this deck.
Unlock Deck
k this deck
14
An increase in the amount of capital per worker always increases the value of output.
Unlock Deck
Unlock for access to all 150 flashcards in this deck.
Unlock Deck
k this deck
15
The figure below shows a per-worker production function.Point C in the figure below represents the level of output per worker that is unattainable with current technology.
Figure 8.2
Figure 8.2
Unlock Deck
Unlock for access to all 150 flashcards in this deck.
Unlock Deck
k this deck
16
The figure below shows a per-worker production function.The bowed shape of the per-worker production function illustrates the law of diminishing returns to scale.
Figure 8.2
Figure 8.2
Unlock Deck
Unlock for access to all 150 flashcards in this deck.
Unlock Deck
k this deck
17
The diminishing slope of the per-worker production function reflects the law of diminishing marginal returns.
Unlock Deck
Unlock for access to all 150 flashcards in this deck.
Unlock Deck
k this deck
18
On-the-job experience causes labor productivity to increase through an improvement in human capital.
Unlock Deck
Unlock for access to all 150 flashcards in this deck.
Unlock Deck
k this deck
19
The process of adding more capital per worker is called capital deepening.
Unlock Deck
Unlock for access to all 150 flashcards in this deck.
Unlock Deck
k this deck
20
The figure below shows a per-worker production function.The shape of the per-worker production function illustrates the law of diminishing marginal returns to labor.
Figure 8.2
Figure 8.2
Unlock Deck
Unlock for access to all 150 flashcards in this deck.
Unlock Deck
k this deck
21
Between 1982 and 2002,U.S.GDP per capita grew at an average rate of 5.5 percent per year.
Unlock Deck
Unlock for access to all 150 flashcards in this deck.
Unlock Deck
k this deck
22
Applied research is the search for knowledge without a clue about the end of the research.
Unlock Deck
Unlock for access to all 150 flashcards in this deck.
Unlock Deck
k this deck
23
Technological change leads to unemployment.
Unlock Deck
Unlock for access to all 150 flashcards in this deck.
Unlock Deck
k this deck
24
Industrial policy involves governments using taxes,subsidies,and regulations to nurture the development of specific industries.
Unlock Deck
Unlock for access to all 150 flashcards in this deck.
Unlock Deck
k this deck
25
Workers displaced due to technological change usually find it difficult to get new jobs.
Unlock Deck
Unlock for access to all 150 flashcards in this deck.
Unlock Deck
k this deck
26
Basic research seeks to answer specific questions or to apply scientific discoveries to the development of specific products.
Unlock Deck
Unlock for access to all 150 flashcards in this deck.
Unlock Deck
k this deck
27
The growing use of computers led to a substantial increase in the overall U.S.productivity growth from 1995 to 2005.
Unlock Deck
Unlock for access to all 150 flashcards in this deck.
Unlock Deck
k this deck
28
The share of research and development funding supported by the private sector has increased over the past three decades.
Unlock Deck
Unlock for access to all 150 flashcards in this deck.
Unlock Deck
k this deck
29
Basic research has less immediate payoff to society.
Unlock Deck
Unlock for access to all 150 flashcards in this deck.
Unlock Deck
k this deck
30
The productivity growth slowdown of the late 1970s and early 1980s may have been due,in part,to the environmental and workplace safety regulations.
Unlock Deck
Unlock for access to all 150 flashcards in this deck.
Unlock Deck
k this deck
31
Basic research is conducted primarily by manufacturing industries.
Unlock Deck
Unlock for access to all 150 flashcards in this deck.
Unlock Deck
k this deck
32
A group of musicians performing at a concert for charity in New York is an example of a cluster in economics.
Unlock Deck
Unlock for access to all 150 flashcards in this deck.
Unlock Deck
k this deck
33
In the long run,the economy needs applied research geared toward specific products more than it needs basic research,which is not motivated by or directed toward manufacturing.
Unlock Deck
Unlock for access to all 150 flashcards in this deck.
Unlock Deck
k this deck
34
Technological change creates long-term hardships for workers with specialized skills.
Unlock Deck
Unlock for access to all 150 flashcards in this deck.
Unlock Deck
k this deck
35
Per capita GDP in the United States has declined since 1950.
Unlock Deck
Unlock for access to all 150 flashcards in this deck.
Unlock Deck
k this deck
36
Over the long run,technological change increases both labor productivity and unemployment rates.
Unlock Deck
Unlock for access to all 150 flashcards in this deck.
Unlock Deck
k this deck
37
Which of the following does not contribute to an improved standard of living?
A)Increases in the amount and quality of available resources
B)Better technology
C)Higher prices for the necessities of life
D)Improvements in the "rules of the game"
E)Increases in the quality of labor
A)Increases in the amount and quality of available resources
B)Better technology
C)Higher prices for the necessities of life
D)Improvements in the "rules of the game"
E)Increases in the quality of labor
Unlock Deck
Unlock for access to all 150 flashcards in this deck.
Unlock Deck
k this deck
38
The only way standard of living can increase is through increases in labor productivity.
Unlock Deck
Unlock for access to all 150 flashcards in this deck.
Unlock Deck
k this deck
39
When firms in the same industry locate in the same geographic region,it is known as dumping.
Unlock Deck
Unlock for access to all 150 flashcards in this deck.
Unlock Deck
k this deck
40
The rules of the game refer to:
A)any factor that facilitates production and exchange,such as tax laws and property rights.
B)a gradual but consistent change in the price level until a fair price is attained.
C)the set of election laws that ensure that all elections are fair.
D)the rules that a firm must follow in order to earn a profit.
E)the requirement that households must supply labor to firms.
Unlock Deck
Unlock for access to all 150 flashcards in this deck.
Unlock Deck
k this deck
41
Which of the following is the correct formula to calculate productivity?
A)Output + quantity of input
B)Output ─ quantity of input
C)Quantity of input ÷ output
D)Output ÷ quantity of input
E)Output × quantity of input
A)Output + quantity of input
B)Output ─ quantity of input
C)Quantity of input ÷ output
D)Output ÷ quantity of input
E)Output × quantity of input
Unlock Deck
Unlock for access to all 150 flashcards in this deck.
Unlock Deck
k this deck
42
Labor cost on an average accounts for about _____ percent of the total cost of production.
A)10
B)30
C)50
D)70
E)98
A)10
B)30
C)50
D)70
E)98
Unlock Deck
Unlock for access to all 150 flashcards in this deck.
Unlock Deck
k this deck
43
If Q is total real output,K is capital in use,and L is labor employed,then _____ is the formula to calculate the productivity of labor.
A)K/L
B)L/K
C)Q/L
D)Q/K
E)(Q + K)/L
A)K/L
B)L/K
C)Q/L
D)Q/K
E)(Q + K)/L
Unlock Deck
Unlock for access to all 150 flashcards in this deck.
Unlock Deck
k this deck
44
Joe runs a pizzeria at a busy place in a city.Around 125 customers visit every day and they each buy 3 pizzas on average.Joe has employed 20 laborers to make pizzas.The productivity of one laborer per day in the pizzeria is equal to _____.
A)6.25 pizzas per worker
B)18.75 pizzas per worker
C)6.67 pizzas per worker
D)41.67 pizzas per worker
E)20.75 pizzas per worker
A)6.25 pizzas per worker
B)18.75 pizzas per worker
C)6.67 pizzas per worker
D)41.67 pizzas per worker
E)20.75 pizzas per worker
Unlock Deck
Unlock for access to all 150 flashcards in this deck.
Unlock Deck
k this deck
45
Productivity measures:
A)how efficiently resources are turned into goods and services.
B)how efficiently goods and services are consumed by the consumers.
C)the level of skills embodied in a unit of labor.
D)the ratio of inputs to a specific amount of output.
E)the availability of resources in an economy.
A)how efficiently resources are turned into goods and services.
B)how efficiently goods and services are consumed by the consumers.
C)the level of skills embodied in a unit of labor.
D)the ratio of inputs to a specific amount of output.
E)the availability of resources in an economy.
Unlock Deck
Unlock for access to all 150 flashcards in this deck.
Unlock Deck
k this deck
46
Which of the following can expand the production possibilities frontier?
A)Improved patent laws
B)Legal reforms that increase transaction costs
C)Reductions in the length of patent protection
D)Stringent tax laws for R&D companies
E)The advent of a labor deepening technology
A)Improved patent laws
B)Legal reforms that increase transaction costs
C)Reductions in the length of patent protection
D)Stringent tax laws for R&D companies
E)The advent of a labor deepening technology
Unlock Deck
Unlock for access to all 150 flashcards in this deck.
Unlock Deck
k this deck
47
Human capital represents:
A)the equipment that labor uses on-the-job to improve labor productivity.
B)the ratio of capital to labor.
C)the education,skill,and training embodied in workers.
D)the technology developed by humans that is embodied in equipment.
E)the social institutions created by people which promote the accumulation of equipment for production.
Unlock Deck
Unlock for access to all 150 flashcards in this deck.
Unlock Deck
k this deck
48
_____ is the resource whose productivity is most commonly measured.
A)Labor
B)Capital
C)Land
D)Energy
E)Money
A)Labor
B)Capital
C)Land
D)Energy
E)Money
Unlock Deck
Unlock for access to all 150 flashcards in this deck.
Unlock Deck
k this deck
49
Surgeons earn more than janitors because:
A)of the negative correlation between level of education and productivity.
B)of the inverse relationship between wages and productivity.
C)the accumulation of human capital leads to an improvement in productivity.
D)of the negative relation between productivity and the amount of physical capital.
E)surgeons spend more time at work than janitors.
Unlock Deck
Unlock for access to all 150 flashcards in this deck.
Unlock Deck
k this deck
50
Suppose a production possibilities frontier (PPF)has been plotted on a graph.If the horizontal axis of the graph measures the output of capital goods and the vertical axis measures the output of consumer goods,then a point outside the PPF represents:
A)a smaller quantity of consumer goods than that represented by a point inside the PPF.
B)an inefficient output combination of the two goods in the economy.
C)an unattainable output combination of the two goods in the economy.
D)an output combination of more consumer goods than capital goods.
E)a smaller quantity of capital goods than that represented by a point inside the PPF.
Unlock Deck
Unlock for access to all 150 flashcards in this deck.
Unlock Deck
k this deck
51
The production possibilities frontier of an economy is based on the assumption that the:
A)amount of consumer goods produced in the economy is constant during a given year.
B)quality of labor available in the economy is variable during a given year.
C)patent laws applicable in the economy are constant during a given year.
D)level of technology available in the economy is variable during a given year.
E)economy can either produce capital goods or consumer goods during a given year.
Unlock Deck
Unlock for access to all 150 flashcards in this deck.
Unlock Deck
k this deck
52
Suppose a production possibilities frontier (PPF)has been plotted on a graph.If the horizontal axis of the graph measures the output of capital goods and the vertical axis measures the output of consumer goods,then a point inside the PPF represents:
A)a larger quantity of capital goods than that represented by a point along the PPF.
B)an inefficient output combination of the two goods in the economy.
C)an unattainable output combination of the two goods in the economy.
D)an output combination of more consumer goods than capital goods.
E)a larger quantity of consumer goods than that represented by a point along the PPF.
Unlock Deck
Unlock for access to all 150 flashcards in this deck.
Unlock Deck
k this deck
53
Which of the following could cause the production possibilities frontier to shift to the right?
A)More government regulation that stunts economic growth
B)Changes in the rules of the game that stunt economic growth
C)Lower quality resources
D)Fewer productive resources
E)Production of more capital goods and fewer consumer goods
A)More government regulation that stunts economic growth
B)Changes in the rules of the game that stunt economic growth
C)Lower quality resources
D)Fewer productive resources
E)Production of more capital goods and fewer consumer goods
Unlock Deck
Unlock for access to all 150 flashcards in this deck.
Unlock Deck
k this deck
54
Long-term growth in production can be explained by:
A)an improvement in the quality of resources available.
B)a gradual but consistent rise in the price level.
C)a rapid and accelerating increase in the price level.
D)a trade surplus that leads to the accumulation of gold.
E)the peaks and troughs of economic fluctuations.
A)an improvement in the quality of resources available.
B)a gradual but consistent rise in the price level.
C)a rapid and accelerating increase in the price level.
D)a trade surplus that leads to the accumulation of gold.
E)the peaks and troughs of economic fluctuations.
Unlock Deck
Unlock for access to all 150 flashcards in this deck.
Unlock Deck
k this deck
55
If Q is total real output,K is capital in use,L is labor employed,an increase in the productivity of labor would imply a(n):
A)increase in K/L.
B)increase in L/K.
C)increase in Q/L.
D)decrease in Q/K.
E)decrease in (Q + K)/L.
A)increase in K/L.
B)increase in L/K.
C)increase in Q/L.
D)decrease in Q/K.
E)decrease in (Q + K)/L.
Unlock Deck
Unlock for access to all 150 flashcards in this deck.
Unlock Deck
k this deck
56
Which of the following factors can influence the production possibilities frontier in the future?
A)The amount of capital produced
B)A fall in the rate of inflation
C)A decrease in consumption in an economy
D)An increase in the tax rate
E)A legal reform that increases transaction costs
A)The amount of capital produced
B)A fall in the rate of inflation
C)A decrease in consumption in an economy
D)An increase in the tax rate
E)A legal reform that increases transaction costs
Unlock Deck
Unlock for access to all 150 flashcards in this deck.
Unlock Deck
k this deck
57
A water bottle manufacturing plant uses a three-step procedure to produce each unit of bottle.The first step is casting,which needs 35 workers to operate the furnace.The second step is quenching,which needs 35 workers.At the third step,bottles are prepared for dispatch in the assembly line with the help of 70 workers.If the factory produces 14,000 bottles per day,then the productivity of labor in the factory is equal to _____.
A)200 bottles per worker
B)400 bottles per worker
C)100 bottles per worker
D)140 bottles per worker
E)220 bottles per worker
A)200 bottles per worker
B)400 bottles per worker
C)100 bottles per worker
D)140 bottles per worker
E)220 bottles per worker
Unlock Deck
Unlock for access to all 150 flashcards in this deck.
Unlock Deck
k this deck
58
In an iron and steel plant with 4 blast furnaces,40 laborers produce 160 tons of pig iron every day.The labor productivity in the firm is equal to _____.
A)0.25 ton per worker
B)4 tons per worker
C)10 tons per worker
D)0.1 ton per worker
E)40 tons per worker
A)0.25 ton per worker
B)4 tons per worker
C)10 tons per worker
D)0.1 ton per worker
E)40 tons per worker
Unlock Deck
Unlock for access to all 150 flashcards in this deck.
Unlock Deck
k this deck
59
Productivity is defined as:
A)the ratio of a specific measure of output to a specific measure of input.
B)the production of worthwhile goods and services.
C)the market value of goods,services,and resources produced per time period (e.g.,per year).
D)average input divided by average output.
E)total input divided by average output.
Unlock Deck
Unlock for access to all 150 flashcards in this deck.
Unlock Deck
k this deck
60
The production possibilities curve for capital and consumer goods is concave to the origin because:
A)of decreasing opportunity costs of production.
B)resources are not perfectly adaptable to the production of both goods.
C)both consumer goods and capital goods equally contribute to economic growth.
D)the level of technology along the frontier is assumed to vary.
E)of constant returns to scale.
A)of decreasing opportunity costs of production.
B)resources are not perfectly adaptable to the production of both goods.
C)both consumer goods and capital goods equally contribute to economic growth.
D)the level of technology along the frontier is assumed to vary.
E)of constant returns to scale.
Unlock Deck
Unlock for access to all 150 flashcards in this deck.
Unlock Deck
k this deck
61
An increase in the amount of capital per worker will:
A)increase labor productivity but not capital productivity.
B)increase capital productivity but not labor productivity.
C)increase both labor and capital productivity.
D)shift the per-worker production function upward.
E)increase total output but not the productivity levels of individual workers.
A)increase labor productivity but not capital productivity.
B)increase capital productivity but not labor productivity.
C)increase both labor and capital productivity.
D)shift the per-worker production function upward.
E)increase total output but not the productivity levels of individual workers.
Unlock Deck
Unlock for access to all 150 flashcards in this deck.
Unlock Deck
k this deck
62
Which of the following factors pushes the per-worker production function of an economy downward?
A)A stable political environment
B)A high risk of terror attack
C)An increase in educated workforce in the country
D)An increase in road networks in the country
E)A law encouraging foreign investment
A)A stable political environment
B)A high risk of terror attack
C)An increase in educated workforce in the country
D)An increase in road networks in the country
E)A law encouraging foreign investment
Unlock Deck
Unlock for access to all 150 flashcards in this deck.
Unlock Deck
k this deck
63
Which of the following does not contribute to labor productivity growth?
A)A steepening of the per-worker production function
B)An increase in the amount of capital per unit of labor
C)A growth in the labor force
D)An improvement in the quality of capital
E)A decrease in the labor-capital ratio
A)A steepening of the per-worker production function
B)An increase in the amount of capital per unit of labor
C)A growth in the labor force
D)An improvement in the quality of capital
E)A decrease in the labor-capital ratio
Unlock Deck
Unlock for access to all 150 flashcards in this deck.
Unlock Deck
k this deck
64
Which of the following would increase labor productivity?
A)A labor deepening production method
B)A decrease in the amount of capital per unit of labor
C)A lower unemployment rate
D)Recruitment of new and young labor force
E)An increase in the education level of per unit of labor
A)A labor deepening production method
B)A decrease in the amount of capital per unit of labor
C)A lower unemployment rate
D)Recruitment of new and young labor force
E)An increase in the education level of per unit of labor
Unlock Deck
Unlock for access to all 150 flashcards in this deck.
Unlock Deck
k this deck
65
An improvement in the quality of capital would:
A)rotate the per-worker production function upward.
B)make the per-worker production function flatter.
C)shift the per-worker production function downward.
D)rotate the per-worker production function downward.
E)have no effect on the per-worker production function.
A)rotate the per-worker production function upward.
B)make the per-worker production function flatter.
C)shift the per-worker production function downward.
D)rotate the per-worker production function downward.
E)have no effect on the per-worker production function.
Unlock Deck
Unlock for access to all 150 flashcards in this deck.
Unlock Deck
k this deck
66
The figure below shows three different per-worker production functions: PF1,PF2,and PF3.The diminishing slopes of the curves reflect _____.
Figure 8.1
A)increasing returns to scale
B)increasing marginal returns from capital
C)diminishing marginal returns from capital
D)decreasing returns to scale
E)diminishing marginal returns from labor
Figure 8.1
A)increasing returns to scale
B)increasing marginal returns from capital
C)diminishing marginal returns from capital
D)decreasing returns to scale
E)diminishing marginal returns from labor
Unlock Deck
Unlock for access to all 150 flashcards in this deck.
Unlock Deck
k this deck
67
The figure below shows three different per-worker production functions: PF1,PF2,and PF3.If PF1 is the initial per-worker production function for a farm,which of the following reflects an increase in the number of tractors per worker in the farm?
Figure 8.1
A)A movement from point D to point C
B)An upward shift from PF1 to PF2
C)A downward shift from PF1 to PF3
D)A movement from point C to point D
E)A movement from point D to point B
Figure 8.1
A)A movement from point D to point C
B)An upward shift from PF1 to PF2
C)A downward shift from PF1 to PF3
D)A movement from point C to point D
E)A movement from point D to point B
Unlock Deck
Unlock for access to all 150 flashcards in this deck.
Unlock Deck
k this deck
68
The law of diminishing marginal returns states that as the quantity of capital per worker increases,other things constant,output per worker eventually:
A)increases at a constant rate.
B)increases at a decreasing rate.
C)increases at an increasing rate.
D)decreases.
E)remains constant.
A)increases at a constant rate.
B)increases at a decreasing rate.
C)increases at an increasing rate.
D)decreases.
E)remains constant.
Unlock Deck
Unlock for access to all 150 flashcards in this deck.
Unlock Deck
k this deck
69
The slope of the per-worker production function diminishes as the amount of capital per-worker increases.This is a reflection of the law of _____.
A)increasing marginal returns
B)diminishing marginal returns
C)constant marginal returns
D)first diminishing then increasing marginal returns
E)demand
A)increasing marginal returns
B)diminishing marginal returns
C)constant marginal returns
D)first diminishing then increasing marginal returns
E)demand
Unlock Deck
Unlock for access to all 150 flashcards in this deck.
Unlock Deck
k this deck
70
An increase in the quantity of capital per worker would:
A)rotate the per-worker production function outward.
B)rotate the per-worker production function inward.
C)shift the per-worker production function downwards.
D)shift the per-worker production function upwards.
E)result in a rightward movement along the current per-worker production function.
A)rotate the per-worker production function outward.
B)rotate the per-worker production function inward.
C)shift the per-worker production function downwards.
D)shift the per-worker production function upwards.
E)result in a rightward movement along the current per-worker production function.
Unlock Deck
Unlock for access to all 150 flashcards in this deck.
Unlock Deck
k this deck
71
If increases in capital per worker lead to increased output per worker,but by decreasing amounts as capital increases,the per-worker production function _____.
A)is vertical
B)has a decreasing slope
C)has an increasing slope
D)has a negative slope
E)is horizontal
A)is vertical
B)has a decreasing slope
C)has an increasing slope
D)has a negative slope
E)is horizontal
Unlock Deck
Unlock for access to all 150 flashcards in this deck.
Unlock Deck
k this deck
72
Which of the following implies a decline in labor productivity in an economy?
A)A high rate of growth in capital formation
B)An improvement in input quality
C)A decrease in the production of goods and services
D)An increase in the budget surplus in the economy
E)A decrease in the prices of goods and services
A)A high rate of growth in capital formation
B)An improvement in input quality
C)A decrease in the production of goods and services
D)An increase in the budget surplus in the economy
E)A decrease in the prices of goods and services
Unlock Deck
Unlock for access to all 150 flashcards in this deck.
Unlock Deck
k this deck
73
A point on the per-worker production function shows:
A)the total output produced by the labor force of an industry on the vertical axis for each level of capital per worker on the horizontal axis.
B)the marginal output per worker on the vertical axis for each level of worker per unit of capital on the horizontal axis.
C)the marginal output per worker on the vertical axis for each level of capital per worker on the horizontal axis.
D)the level of capital per worker on the vertical axis for respective average output per worker on the horizontal axis.
E)the average output per worker on the vertical axis for each level of capital per worker on the horizontal axis.
Unlock Deck
Unlock for access to all 150 flashcards in this deck.
Unlock Deck
k this deck
74
Which of the following is assumed to be constant along a per-worker production function?
A)Output per worker
B)Capital per worker
C)Level of technology
D)Amount of capital
E)Amount of output
A)Output per worker
B)Capital per worker
C)Level of technology
D)Amount of capital
E)Amount of output
Unlock Deck
Unlock for access to all 150 flashcards in this deck.
Unlock Deck
k this deck
75
The movement from point A to point B in the figure below illustrates the effect of:
Figure 8.1
A)an increase in the capital stock relative to the workforce.
B)an increase in the labor productivity growth rate.
C)an increase in labor productivity because of higher quality capital.
D)a decrease in labor productivity.
E)a decrease in the capital stock.
Figure 8.1
A)an increase in the capital stock relative to the workforce.
B)an increase in the labor productivity growth rate.
C)an increase in labor productivity because of higher quality capital.
D)a decrease in labor productivity.
E)a decrease in the capital stock.
Unlock Deck
Unlock for access to all 150 flashcards in this deck.
Unlock Deck
k this deck
76
The figure below shows three different per-worker production functions: PF1,PF2,and PF3.If PF1 is the initial per-worker production function,which of the following reflects the impact of an increase in the level of technology?
Figure 8.1
A)A movement from point D to point C
B)An upward shift from PF1 to PF2
C)A downward shift from PF1 to PF3
D)A movement from point C to point D
E)A movement from point D to point F
Figure 8.1
A)A movement from point D to point C
B)An upward shift from PF1 to PF2
C)A downward shift from PF1 to PF3
D)A movement from point C to point D
E)A movement from point D to point F
Unlock Deck
Unlock for access to all 150 flashcards in this deck.
Unlock Deck
k this deck
77
Which of the following factors of production is likely to be most productive?
A)A certified doctor working in a well-equipped hospital
B)A medical student working as a volunteer in a rural health clinic
C)A trained nurse without access to the latest medical technology
D)A knowledgeable chemist without a degree in medical sciences
E)A specialist doctor working in a hospital with poor infrastructure
Unlock Deck
Unlock for access to all 150 flashcards in this deck.
Unlock Deck
k this deck
78
The per-worker production function illustrates the fact that as the amount of capital per worker increases,output per worker:
A)increases at an increasing rate.
B)increases then decreases.
C)decreases but at an increasing rate.
D)decreases.
E)increases but at a decreasing rate.
A)increases at an increasing rate.
B)increases then decreases.
C)decreases but at an increasing rate.
D)decreases.
E)increases but at a decreasing rate.
Unlock Deck
Unlock for access to all 150 flashcards in this deck.
Unlock Deck
k this deck
79
A decrease in the capital-labor ratio would result in:
A)higher labor productivity because labor does more work.
B)lower labor productivity because labor is working with relatively less capital.
C)higher labor productivity because labor is producing less capital and more of other goods.
D)lower labor productivity because more capital is available.
E)higher labor productivity because more capital is available.
Unlock Deck
Unlock for access to all 150 flashcards in this deck.
Unlock Deck
k this deck
80
If a nation moves upward along its per-worker production function relating output per worker to capital per worker,then:
A)labor productivity rises.
B)labor productivity falls.
C)the amount of capital decreases,other things constant.
D)labor input decreases.
E)the productivity of capital rises.
A)labor productivity rises.
B)labor productivity falls.
C)the amount of capital decreases,other things constant.
D)labor input decreases.
E)the productivity of capital rises.
Unlock Deck
Unlock for access to all 150 flashcards in this deck.
Unlock Deck
k this deck
Unlock Deck
Unlock for access to all 150 flashcards in this deck.


