Deck 8: Supply: the Costs of Doing Business
Full screen (f)
Question
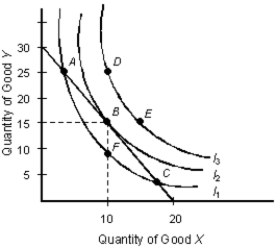
The below figure shows the various combinations of the goods X and Y that yield different levels of utility.Figure 7.3
Which of the following reflects the correct relationship between average total cost (ATC) and marginal cost (MC)?
A)When MC > ATC; ATC is falling.
B)When ATC is minimum; ATC < MC.
C)When MC < ATC; ATC is falling.
D)When MC < ATC; ATC is constant.
E)When ATC < MC; MC is falling.
Which of the following reflects the correct relationship between average total cost (ATC) and marginal cost (MC)?
A)When MC > ATC; ATC is falling.
B)When ATC is minimum; ATC < MC.
C)When MC < ATC; ATC is falling.
D)When MC < ATC; ATC is constant.
E)When ATC < MC; MC is falling.
Question
The below figure shows the various combinations of the goods X and Y that yield different levels of utility.Figure 7.3
Which of these is true of the law of diminishing marginal returns?
A)It is a long run phenomena where all inputs are variable.
B)It applies mostly to the short run because some inputs remain fixed.
C)It is a long run phenomena experienced under monopoly.
D)It applies to fixed inputs in the long run.
E)It applies to fixed inputs in the short run.
Question
The below figure shows the various combinations of the goods X and Y that yield different levels of utility.Figure 7.3
The average total cost incurred by a firm is calculated by dividing:
A)the change in total cost by the change in the quantity of output.
B)total output by the number of people employed.
C)the change in total output by the change in the number of people employed.
D)total cost by total output.
E)total output by total cost.
Question
The below figure shows the various combinations of the goods X and Y that yield different levels of utility.Figure 7.3
If an average cost curve is U-shaped, then:
A)costs per unit remainconstant throughout the entire range of production.
B)costs per unit fall throughout the entire range of production.
C)costs per unit increase throughout the entire range of production.
D)costs per unit first rise, then reach a maximum, and then begin to fall as output is increased.
E)costs per unit first fall, then reach a minimum, and then increase as output is increased.
Question
The below figure shows the various combinations of the goods X and Y that yield different levels of utility.Figure 7.3
When the average total cost is at its minimum, it is:
A)equal to average variable cost.
B)greater than marginal cost.
C)equal to average fixed cost.
D)equal to marginal cost.
E)less than marginal cost.
When the average total cost is at its minimum, it is:
A)equal to average variable cost.
B)greater than marginal cost.
C)equal to average fixed cost.
D)equal to marginal cost.
E)less than marginal cost.
Question
The below figure shows the various combinations of the goods X and Y that yield different levels of utility.Figure 7.3
"As I add more workers to the factory line, the additional output produced by each additional worker seems to decline. Eventually, the workers just get in each others' way." This statement by a factory supervisor refers to the law of:
A)comparative advantage.
B)demand.
C)supply.
D)increasing returns to scale.
E)diminishing marginal returns.
Question
The below figure shows the various combinations of the goods X and Y that yield different levels of utility.Figure 7.3
If labor is the only variable input, an increase in the quantity of labor:
A)does not have any effect on the quantity of output.
B)causes the output to increase initially at a diminishing rate and then at an increasing rate.
C)causes the output to increase at a constant rate till the last worker is hired.
D)causes the output to increase initially at an increasing rate and then at a decreasing rate.
E)causes the output to decrease at a constant rate till the last worker is hired.
Question
The below figure shows the various combinations of the goods X and Y that yield different levels of utility.Figure 7.3
Suppose that the total fixed cost of producing five sailboats is $4,000, total variable cost is $4,000, and the total cost of producing six sailboats is $10,000. The marginal cost of the sixth sailboat is:
A)$2,000.
B)$4,000.
C)$8,000.
D)$10,000.
E)$6,000.
Suppose that the total fixed cost of producing five sailboats is $4,000, total variable cost is $4,000, and the total cost of producing six sailboats is $10,000. The marginal cost of the sixth sailboat is:
A)$2,000.
B)$4,000.
C)$8,000.
D)$10,000.
E)$6,000.
Question
The below figure shows the various combinations of the goods X and Y that yield different levels of utility.Figure 7.3
When more and more units of a variable factor are combined with constant amount of a fixed factor, such that the variable factor becomes abundant compared to the fixed factor, the output will eventually:
A)increase at an increasing rate.
B)increase at a diminishing rate.
C)increase at a constant rate.
D)become constant.
E)fall to zero.
Question
The below figure shows the various combinations of the goods X and Y that yield different levels of utility.Figure 7.3
The marginal fixed cost of a firm:
A)is a positive constant irrespective of output level.
B)declines as output is increased because a fixed numerator is divided by an ever-growing denominator.
C)generally increases as output is increased.
D)is equal to average variable cost and average total cost at their minimum points.
E)is always equal to zero and is therefore ignored by economists.
Question
The below figure shows the various combinations of the goods X and Y that yield different levels of utility.Figure 7.3
Fixed costs are costs paid for:
A)medical reimbursements and health insurance of workers.
B)obsolete plant and equipment not used anymore.
C)plant and equipment in the long run.
D)hiring temporary workers.
E)resources that do not change with changes in output.
Fixed costs are costs paid for:
A)medical reimbursements and health insurance of workers.
B)obsolete plant and equipment not used anymore.
C)plant and equipment in the long run.
D)hiring temporary workers.
E)resources that do not change with changes in output.
Question
The below figure shows the various combinations of the goods X and Y that yield different levels of utility.Figure 7.3
At its minimum point, the average-total-cost curve is intersected by the:
A)average fixed cost curve.
B)average variable cost curve.
C)total fixed cost curve.
D)total variable cost curve.
E)marginal cost curve.
At its minimum point, the average-total-cost curve is intersected by the:
A)average fixed cost curve.
B)average variable cost curve.
C)total fixed cost curve.
D)total variable cost curve.
E)marginal cost curve.
Question
The below figure shows the various combinations of the goods X and Y that yield different levels of utility.Figure 7.3
Assume that one laborer produces 6 units of output, two laborers produce 14 units, three laborers 22 units, four laborers 24 units, and five laborers 25 units. Diminishing returns set in when the firm hires:
A)the first laborer.
B)the second laborer.
C)the third laborer.
D)the fourth laborer.
E)the fifth laborer.
Question
The below figure shows the various combinations of the goods X and Y that yield different levels of utility.Figure 7.3
If a firm is experiencing diminishing returns to a variable input, then:
A)it must be hiring less-productive units of the variable resource.
B)it must be experiencing diseconomies of scale.
C)the marginal physical product of the variable input must be decreasing.
D)the average physical product of the variable input must be decreasing.
E)its total product must be decreasing.
Question
The below figure shows the various combinations of the goods X and Y that yield different levels of utility.Figure 7.3
A firm's marginal cost equals the:
A)ratio of total cost to total quantity.
B)slope of the demand curve under perfect competition.
C)slope of the total product curve when the latter is at its maximum.
D)change in total cost divided by the change in total output.
E)slope of the supply curve.
A firm's marginal cost equals the:
A)ratio of total cost to total quantity.
B)slope of the demand curve under perfect competition.
C)slope of the total product curve when the latter is at its maximum.
D)change in total cost divided by the change in total output.
E)slope of the supply curve.
Question
The below figure shows the various combinations of the goods X and Y that yield different levels of utility.Figure 7.3
If the total cost of producing 2 pounds of cheese is $6 and the total cost of producing 4 pounds of cheese is $8, then:
A)marginal cost of producing cheese declines as output increases.
B)average total cost of producing cheese declines as output increases.
C)average total cost of producing cheese increases as output increases.
D)average total cost remains constant irrespective of the change in output.
E)marginal cost remains constant irrespective of the change in output.
Question
The below figure shows the various combinations of the goods X and Y that yield different levels of utility.Figure 7.3
Short run refers to a period of time during which:
A)all the factors are constant.
B)all the factors are variable.
C)the producer can shift from one plant size to another.
D)some factors are fixed while some others are variable.
E)the producer cannot change the level of output.
Short run refers to a period of time during which:
A)all the factors are constant.
B)all the factors are variable.
C)the producer can shift from one plant size to another.
D)some factors are fixed while some others are variable.
E)the producer cannot change the level of output.
Question
The below figure shows the various combinations of the goods X and Y that yield different levels of utility.Figure 7.3
Diminishing marginal returns means that as you combine more units of a variable resource with a set of fixed resources:
A)the average physical product of the fixed inputs increases at an increasing rate.
B)the marginal physical product of the variable input decreases.
C)the total output decreases.
D)the marginal physical product of the variable input increases at a constant rate.
E)the marginal physical product of the variable input increases at a decreasing rate.
Question
The below figure shows the various combinations of the goods X and Y that yield different levels of utility.Figure 7.3
After hiring a new employee, a manager finds that the total output has increased. When the manager hires another employee however, he realizes that although the total production has increased, the increment is less than the previous case. This is the result of:
A)diseconomies of scale.
B)a general economic downturn.
C)diminishing marginal returns.
D)the lack of skills of the two new employees.
E)constant returns to scale.
Question
The below figure shows the various combinations of the goods X and Y that yield different levels of utility.Figure 7.3
If the average variable cost of a firm is falling, then the:
A)average fixed cost must be rising.
B)marginal cost must be falling.
C)marginal cost must be rising.
D)marginal cost lies below the average variable cost.
E)marginal cost lies above the average variable cost.
If the average variable cost of a firm is falling, then the:
A)average fixed cost must be rising.
B)marginal cost must be falling.
C)marginal cost must be rising.
D)marginal cost lies below the average variable cost.
E)marginal cost lies above the average variable cost.
Question
The figure given below shows cost curves of a firm.Figure: 8.2
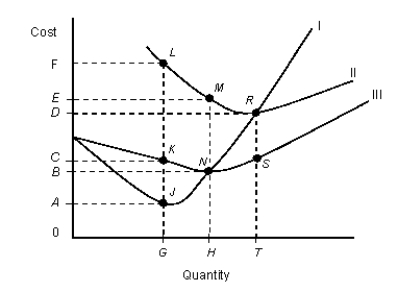 In the figure,
|: Marginal cost curve
||: Average total cost curve
|||: Average variable cost curve
Refer to Figure 8.2. At an output level of G:
A)both average total cost and average variable cost are falling.
B)average fixed cost is equal to the distance JK.
C)average variable cost exceeds marginal cost by the amount LJ.
D)average total cost exceeds marginal cost by the amount KJ.
E)total cost is equal to the area 0AJG.
In the figure,|: Marginal cost curve
||: Average total cost curve
|||: Average variable cost curve
Refer to Figure 8.2. At an output level of G:
A)both average total cost and average variable cost are falling.
B)average fixed cost is equal to the distance JK.
C)average variable cost exceeds marginal cost by the amount LJ.
D)average total cost exceeds marginal cost by the amount KJ.
E)total cost is equal to the area 0AJG.
Question
The below figure shows the various combinations of the goods X and Y that yield different levels of utility.Figure 7.3
Assume that for 20 bicycles, the total fixed cost is $100 and the total variable cost is $300. Then the average fixed cost and the average variable cost are:
A)$5 and $10 respectively.
B)$5 and $15 respectively.
C)$10 and $15 respectively.
D)$15 and $10 respectively.
E)$10 and $5 respectively.
Assume that for 20 bicycles, the total fixed cost is $100 and the total variable cost is $300. Then the average fixed cost and the average variable cost are:
A)$5 and $10 respectively.
B)$5 and $15 respectively.
C)$10 and $15 respectively.
D)$15 and $10 respectively.
E)$10 and $5 respectively.
Question
The below figure shows the various combinations of the goods X and Y that yield different levels of utility.Figure 7.3
Assume that one laborer produces 6 units of output, two laborers produce 14 units, three produce 20 units, and four produce 24 units. If the cost is $20 per unit of labor and fixed costs are $100, what is the average total cost of producing 14 units of output?
A)$50
B)$20
C)$10
D)$100
E)$40
Assume that one laborer produces 6 units of output, two laborers produce 14 units, three produce 20 units, and four produce 24 units. If the cost is $20 per unit of labor and fixed costs are $100, what is the average total cost of producing 14 units of output?
A)$50
B)$20
C)$10
D)$100
E)$40
Question
The figure given below shows cost curves of a firm.Figure: 8.2
In the figure,
|: Marginal cost curve
||: Average total cost curve
|||: Average variable cost curve
Refer to Figure 8.2. At an output level of H, total fixed cost is:
A)SR.
B)LK.
C)BE.
D)area BEMN.
E)area 0EMH.
In the figure,|: Marginal cost curve
||: Average total cost curve
|||: Average variable cost curve
Refer to Figure 8.2. At an output level of H, total fixed cost is:
A)SR.
B)LK.
C)BE.
D)area BEMN.
E)area 0EMH.
Question
The figure given below shows the average fixed cost (AFC) and the average variable cost (AVC) curves of a competitive firm.Figure 8.1
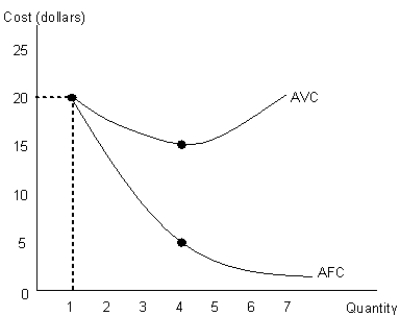
Using Figure 8.1 determine the average total cost of producing the first unit of the output.
A)$10
B)$20
C)$30
D)$40
E)$50
Using Figure 8.1 determine the average total cost of producing the first unit of the output.
A)$10
B)$20
C)$30
D)$40
E)$50
Question
The figure given below shows cost curves of a firm.Figure: 8.2
In the figure,
|: Marginal cost curve
||: Average total cost curve
|||: Average variable cost curve
Refer to Figure 8.2. When Average Variable Cost (AVC) is at a minimum, which of the following is true?
A)AVC equals AB
B)Marginal cost (MC) equals 0G
C)Average total cost exceeds AVC by SR
D)MC equals HN
E)MC equals GJ
In the figure,|: Marginal cost curve
||: Average total cost curve
|||: Average variable cost curve
Refer to Figure 8.2. When Average Variable Cost (AVC) is at a minimum, which of the following is true?
A)AVC equals AB
B)Marginal cost (MC) equals 0G
C)Average total cost exceeds AVC by SR
D)MC equals HN
E)MC equals GJ
Question
The following table shows the cost of producing different units of ball point pens by a firm.Table 8.1
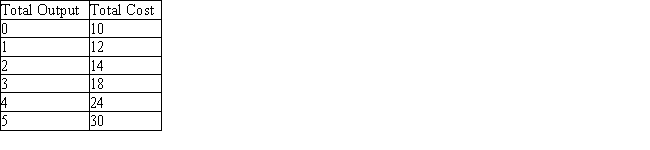
According to Table 8.1, the total fixed cost of the firm equals:
A)$18.
B)$10.
C)$2.
D)$12.
E)$8.
According to Table 8.1, the total fixed cost of the firm equals:
A)$18.
B)$10.
C)$2.
D)$12.
E)$8.
Question
The following table shows the cost of producing different units of ball point pens by a firm.Table 8.1
Refer to Table 8.1. What will be the average fixed cost of producing five ball point pens?
A)$2
B)$5
C)$4
D)$3.33
E)$10
Refer to Table 8.1. What will be the average fixed cost of producing five ball point pens?
A)$2
B)$5
C)$4
D)$3.33
E)$10
Question
The following table shows the cost of producing different units of ball point pens by a firm.Table 8.1
According to Table 8.1, the average variable cost of producing five ball point pens is:
A)$3.5.
B)$2.
C)$4.
D)$2.5
E)$4.5
According to Table 8.1, the average variable cost of producing five ball point pens is:
A)$3.5.
B)$2.
C)$4.
D)$2.5
E)$4.5
Question
The following table shows the cost of producing different units of ball point pens by a firm.Table 8.1
For a steel manufacturing firm, overhead costs would include:
A)cost of iron ore.
B)cost incurred in buying blast furnaces.
C)insurance premiums of the firm.
D)wages of the workers.
E)cost of electricity for running the machines in the factory.
For a steel manufacturing firm, overhead costs would include:
A)cost of iron ore.
B)cost incurred in buying blast furnaces.
C)insurance premiums of the firm.
D)wages of the workers.
E)cost of electricity for running the machines in the factory.
Question
The below figure shows the various combinations of the goods X and Y that yield different levels of utility.Figure 7.3
With expansion in the level of output, total fixed cost:
A)declines but remains positive.
B)increases.
C)falls to zero.
D)remains constant.
E)becomes negative.
With expansion in the level of output, total fixed cost:
A)declines but remains positive.
B)increases.
C)falls to zero.
D)remains constant.
E)becomes negative.
Question
The below figure shows the various combinations of the goods X and Y that yield different levels of utility.Figure 7.3
If the total cost of producing 6 units is $228 and the total cost of producing 7 units is $245, what is the marginal cost of producing the seventh unit?
A)$35
B)$245
C)$3
D)$38
E)$17
If the total cost of producing 6 units is $228 and the total cost of producing 7 units is $245, what is the marginal cost of producing the seventh unit?
A)$35
B)$245
C)$3
D)$38
E)$17
Question
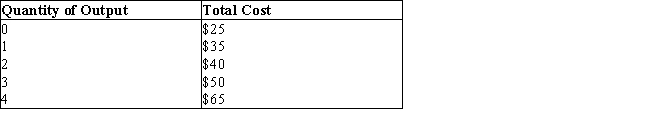
The table below shows the total cost of producing different units of a commodity.Table 8.2
Refer to Table 8.2. If the production of 2 extra units (units 11 and 12) increases total cost by $162, then:
A)the marginal cost of the twelfth unit will be $162.
B)the total cost of producing 12 units will be $894.
C)the average variable cost of producing 11 units is $732.
D)the average total cost of producing 12 units is $61.
E)the marginal cost of the thirteenth unit will be $0.
Question
The figure given below shows the average fixed cost (AFC) and the average variable cost (AVC) curves of a competitive firm.Figure 8.1
Refer to Figure 8.1. Compute the total cost of producing 4 units of the output.
A)$64
B)$72
C)$80
D)$84
E)$90
Refer to Figure 8.1. Compute the total cost of producing 4 units of the output.
A)$64
B)$72
C)$80
D)$84
E)$90
Question
The table below shows the total cost of producing different units of a commodity.Table 8.2
From Table 8.2, derive the value of total fixed costs.
A)$10
B)$100
C)$98
D)$50
E)$60
From Table 8.2, derive the value of total fixed costs.
A)$10
B)$100
C)$98
D)$50
E)$60
Question
The following table shows the cost of producing different units of ball point pens by a firm.Table 8.1
If the average total cost of producing 2 pounds of cheese is $4 and the average total cost of producing 3 pounds of cheese is $4.2, then the marginal cost of producing third pound of cheese is equal to:
A)$4.2.
B)$8.
C)$4.5.
D)$4.6.
E)$4.1.
If the average total cost of producing 2 pounds of cheese is $4 and the average total cost of producing 3 pounds of cheese is $4.2, then the marginal cost of producing third pound of cheese is equal to:
A)$4.2.
B)$8.
C)$4.5.
D)$4.6.
E)$4.1.
Question
The following table shows the cost of producing different units of ball point pens by a firm.Table 8.1
Refer to Table 8.1. What is the marginal cost of producing the fifth unit?
A)$4
B)$6
C)$8
D)$2
E)$10
Refer to Table 8.1. What is the marginal cost of producing the fifth unit?
A)$4
B)$6
C)$8
D)$2
E)$10
Question
The figure given below shows cost curves of a firm.Figure: 8.2
In the figure,
|: Marginal cost curve
||: Average total cost curve
|||: Average variable cost curve
Which of the following is not correct for an individual firm?
A)If the average variable cost (AVC) is decreasing, average total cost (ATC) must be decreasing.
B)AVC reaches minimum before ATC.
C)If ATC is increasing, AVC must be increasing.
D)If AVC is increasing, marginal cost (MC) is increasing.
E)If average fixed cost (AFC) is decreasing, ATC must be decreasing.
In the figure,|: Marginal cost curve
||: Average total cost curve
|||: Average variable cost curve
Which of the following is not correct for an individual firm?
A)If the average variable cost (AVC) is decreasing, average total cost (ATC) must be decreasing.
B)AVC reaches minimum before ATC.
C)If ATC is increasing, AVC must be increasing.
D)If AVC is increasing, marginal cost (MC) is increasing.
E)If average fixed cost (AFC) is decreasing, ATC must be decreasing.
Question
The table below shows the total cost of producing different units of a commodity.Table 8.2
According to Table 8.2, the average variable cost of producing two units of output is:
A)$48.
B)$50.
C)$62.
D)$55.
E)$60.
According to Table 8.2, the average variable cost of producing two units of output is:
A)$48.
B)$50.
C)$62.
D)$55.
E)$60.
Question
The figure given below shows cost curves of a firm.Figure: 8.2
In the figure,
|: Marginal cost curve
||: Average total cost curve
|||: Average variable cost curve
Refer to Figure 8.2. At an output level of H, average total cost is:
A)0E.
B)BE.
C)area 0EMH.
D)0B.
E)area 0BNH.
In the figure,|: Marginal cost curve
||: Average total cost curve
|||: Average variable cost curve
Refer to Figure 8.2. At an output level of H, average total cost is:
A)0E.
B)BE.
C)area 0EMH.
D)0B.
E)area 0BNH.
Question
The table given below shows the total fixed and variable costs of a firm.Table 8.3
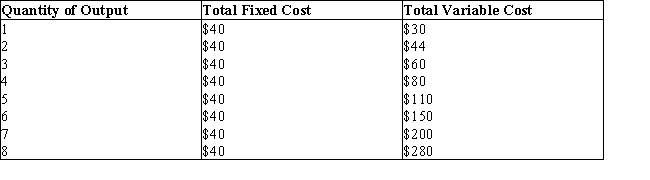
Refer to Table 8.3. At what level of output does the average total cost starts increasing?
A)1 unit
B)6 units
C)5 units
D)7 units
E)4 units
Refer to Table 8.3. At what level of output does the average total cost starts increasing?
A)1 unit
B)6 units
C)5 units
D)7 units
E)4 units
Question
The table given below shows the average total cost of production of a firm at different levels of the output.Table 8.5
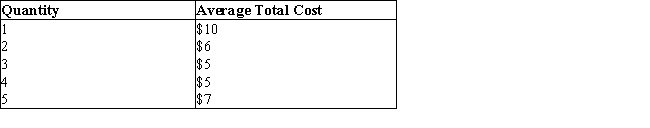
In the long run, the total variable cost of a firm:
A)is equal to its total fixed cost.
B)is equal to its total cost.
C)is equal to its average fixed cost.
D)is more than its total fixed cost.
E)is less than its total cost.
In the long run, the total variable cost of a firm:
A)is equal to its total fixed cost.
B)is equal to its total cost.
C)is equal to its average fixed cost.
D)is more than its total fixed cost.
E)is less than its total cost.
Question
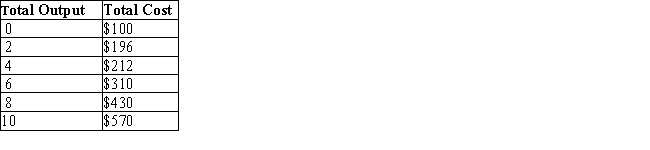
The table given below shows the total cost of producing different units of the output by a competitive firm.Table 8.4
In Table 8.4, at 4 units of output marginal cost is:
A)$10.
B)$15.
C)$20.
D)$25
E)$30.
In Table 8.4, at 4 units of output marginal cost is:
A)$10.
B)$15.
C)$20.
D)$25
E)$30.
Question
The table given below shows the average total cost of production of a firm at different levels of the output.Table 8.5
As the output produced by a firm increases, the average fixed cost:
A)continues to decline.
B)initially increases, and then declines.
C)quickly drops to zero.
D)becomes constant.
E)declines and finally becomes negative.
As the output produced by a firm increases, the average fixed cost:
A)continues to decline.
B)initially increases, and then declines.
C)quickly drops to zero.
D)becomes constant.
E)declines and finally becomes negative.
Question
The table given below shows the average total cost of production of a firm at different levels of the output.Table 8.5
In Table 8.5, if the total fixed cost is $3, what is the total variable cost of producing 5 units?
A)$38
B)$32
C)$3
D)$8
E)Cannot be determined from the information given.
In Table 8.5, if the total fixed cost is $3, what is the total variable cost of producing 5 units?
A)$38
B)$32
C)$3
D)$8
E)Cannot be determined from the information given.
Question
The table given below shows the total fixed and variable costs of a firm.Table 8.3
In Table 8.3, the average fixed cost of the first unit of output is ____ while the average fixed cost of producing 8 units of output is ____.
A)$30; $40
B)$40; $5
C)$40; $40
D)$40; $280
E)$40; $320
In Table 8.3, the average fixed cost of the first unit of output is ____ while the average fixed cost of producing 8 units of output is ____.
A)$30; $40
B)$40; $5
C)$40; $40
D)$40; $280
E)$40; $320
Question
The table given below shows the total cost of producing different units of the output by a competitive firm.Table 8.4
Which of the following is correct if the firm described in Table 8.4 decides to produce nothing?
A)The total cost of production will be zero.
B)The total fixed cost of production will be zero.
C)The total variable cost of production will be zero.
D)The average cost of production will be zero.
E)It is impossible for the firm to produce nothing in the short run.
Question
The table given below shows the average total cost of production of a firm at different levels of the output.Table 8.5
According to economic theory, the difference between the long run and the short run is:
A)about two months.
B)about two years.
C)not relevant for executive decision makers.
D)strictly theoretical so that in practice there is no difference between them.
E)the ability for a firm to vary all resources.
Question
The table given below shows the average total cost of production of a firm at different levels of the output.Table 8.5
In the short run when output is zero, total cost is:
A)equal to total variable cost.
B)greater than total fixed cost.
C)equal to total fixed cost.
D)less than total fixed cost.
E)less than total variable cost.
In the short run when output is zero, total cost is:
A)equal to total variable cost.
B)greater than total fixed cost.
C)equal to total fixed cost.
D)less than total fixed cost.
E)less than total variable cost.
Question
The table given below shows the total fixed and variable costs of a firm.Table 8.3
If the firm described in Table 8.3 decides to produce nothing, its:
A)total cost will fall to zero.
B)total variable cost will be equal to $30.
C)total cost will equal $40.
D)average total cost will equal zero.
E)marginal cost will equal $10.
If the firm described in Table 8.3 decides to produce nothing, its:
A)total cost will fall to zero.
B)total variable cost will be equal to $30.
C)total cost will equal $40.
D)average total cost will equal zero.
E)marginal cost will equal $10.
Question
The table given below shows the average total cost of production of a firm at different levels of the output.Table 8.5
If a firm doubles its resources and generates an output level which is more than double, it is said to be experiencing:
A)economic fluctuations.
B)recession.
C)diseconomies of scale.
D)increasing marginal returns to a factor.
E)economies of scale.
If a firm doubles its resources and generates an output level which is more than double, it is said to be experiencing:
A)economic fluctuations.
B)recession.
C)diseconomies of scale.
D)increasing marginal returns to a factor.
E)economies of scale.
Question
The table given below shows the total cost of producing different units of the output by a competitive firm.Table 8.4
Refer to Table 8.4. At 4 units of output,
A)AFC is $6.25 and AVC is $10.
B)AFC is $6.25 and AVC is $40.
C)AFC is $40 and AVC is $6.25.
D)AFC is $25 and AVC is $40.
E)AFC and AVC cannot be determined for the firm in question.
Refer to Table 8.4. At 4 units of output,
A)AFC is $6.25 and AVC is $10.
B)AFC is $6.25 and AVC is $40.
C)AFC is $40 and AVC is $6.25.
D)AFC is $25 and AVC is $40.
E)AFC and AVC cannot be determined for the firm in question.
Question
The table given below shows the total fixed and variable costs of a firm.Table 8.3
According to Table 8.3, the firm's marginal cost is equal to its average total cost at _____ unit(s) of output.
A)1
B)3
C)4
D)5
E)8
According to Table 8.3, the firm's marginal cost is equal to its average total cost at _____ unit(s) of output.
A)1
B)3
C)4
D)5
E)8
Question
The table given below shows the average total cost of production of a firm at different levels of the output.Table 8.5
Refer to Table 8.5. At what level of production will the average total cost curve intersect the marginal cost curve?
A)3 units
B)2 units
C)1 unit
D)5 units
E)4 units
Refer to Table 8.5. At what level of production will the average total cost curve intersect the marginal cost curve?
A)3 units
B)2 units
C)1 unit
D)5 units
E)4 units
Question
The table given below shows the average total cost of production of a firm at different levels of the output.Table 8.5
In Table 8.5, the marginal cost of producing the third unit of output is:
A)$7.
B)$8.
C)$3.
D)$4.
E)$6.
In Table 8.5, the marginal cost of producing the third unit of output is:
A)$7.
B)$8.
C)$3.
D)$4.
E)$6.
Question
The table given below shows the average total cost of production of a firm at different levels of the output.Table 8.5
The law of diminishing return does not apply to a firm in the long run because in this phase:
A)all the factors of production are fixed.
B)there are no fixed factors of production.
C)there are some fixed and some variable factors of production.
D)the producer is required to produce a fixed level of output.
E)the producer can change the level of output only by changing the variable factors, fixed factors remaining unchanged.
Question
The table given below shows the average total cost of production of a firm at different levels of the output.Table 8.5
In Table 8.5, what is the total cost of producing 4 units?
A)$28
B)$10
C)$15
D)$20
E)$35
In Table 8.5, what is the total cost of producing 4 units?
A)$28
B)$10
C)$15
D)$20
E)$35
Question
The table given below shows the total fixed and variable costs of a firm.Table 8.3
Using the information in Table 8.3 we can conclude that the marginal cost curve intersects the average variable cost curve at ____ unit(s) of output.
A)1
B)2
C)5
D)4
E)6
Using the information in Table 8.3 we can conclude that the marginal cost curve intersects the average variable cost curve at ____ unit(s) of output.
A)1
B)2
C)5
D)4
E)6
Question
The table below shows the total cost of producing different units of a commodity.Table 8.2
Refer to Table 8.2. The average fixed cost of the first unit of output is:
A)$46.
B)$98.
C)$100.
D)$50.
E)$140.
Refer to Table 8.2. The average fixed cost of the first unit of output is:
A)$46.
B)$98.
C)$100.
D)$50.
E)$140.
Question
The table given below shows the average total cost of production of a firm at different levels of the output.Table 8.5
In the long run,
A)some resources are variable and some resources are fixed.
B)all the resources can be varied.
C)all resources are fixed.
D)at least one resource is fixed.
E)there are no explicit costs.
In the long run,
A)some resources are variable and some resources are fixed.
B)all the resources can be varied.
C)all resources are fixed.
D)at least one resource is fixed.
E)there are no explicit costs.
Question
The table given below shows the average total cost of production of a firm at different levels of the output.Table 8.5
The long-run average total cost curve represents:
A)the maximum cost of producing any level of output when all the factors are fixed.
B)the lowest cost of producing any level of output when all the factors are variable.
C)the maximum cost of producing any level of output when all the factors are variable.
D)the lowest cost of producing any level of output when all the factors are fixed.
E)the lowest cost of producing any level of output when at least one factor is fixed.
Question
The figure given below shows three Short Run Average Total Cost (SRATC) curves and the Long Run Average Total Cost (LRATC) curve of a firm.Figure 8.3
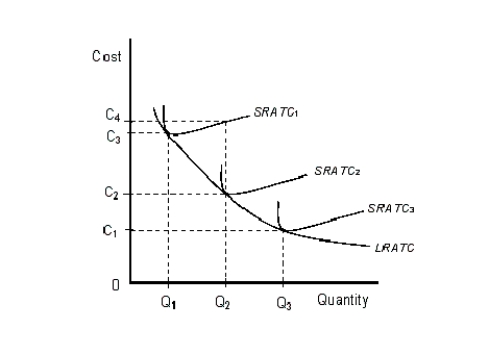
Refer to the Figure 8.3. In the long run, an increase in production from Q1 to Q3 would:
A)increase average cost by C4 - C1.
B)increase average cost by C3 - C1.
C)increase average cost by C3 - C2.
D)decrease average cost by C3 - C1.
E)decrease average cost by C3 - C2.
Refer to the Figure 8.3. In the long run, an increase in production from Q1 to Q3 would:
A)increase average cost by C4 - C1.
B)increase average cost by C3 - C1.
C)increase average cost by C3 - C2.
D)decrease average cost by C3 - C1.
E)decrease average cost by C3 - C2.
Question
The table given below shows the average total cost of production of a firm at different levels of the output.Table 8.5
The long-run average total cost curve is U-shaped because:
A)a firm initially experiences economies of scale and then diseconomies of scale.
B)the law of diminishing returns to a factor sets in beyond a certain level of output.
C)a firm initially experiences diseconomies of scale and then economies of scale.
D)division of labor keeps labor productivity constant irrespective of expansion or contraction in production.
E)the efficiency of capital increases over a period of time.
Question
The table given below shows the average total cost of production of a firm at different levels of the output.Table 8.5
All these factors can lead to economies of scale in production, except:
A)division of labor that helps in specialization.
B)merger of two firms.
C)hiring larger machines which are more efficient than the smaller ones.
D)increase in overhead expenses.
E)research and development.
All these factors can lead to economies of scale in production, except:
A)division of labor that helps in specialization.
B)merger of two firms.
C)hiring larger machines which are more efficient than the smaller ones.
D)increase in overhead expenses.
E)research and development.
Question
The figure given below shows three Short Run Average Total Cost (SRATC) curves and the Long Run Average Total Cost (LRATC) curve of a firm.Figure 8.3
In the electricity generation industry, the cost per kilowatt hour of electricity declines as the capacity to generate output increases. This situation represents:
A)a poor opportunity for investors.
B)constant returns to scale.
C)diseconomies of scale.
D)economies of scale.
E)decreasing returns to scale.
Question
The figure given below shows three Short Run Average Total Cost (SRATC) curves and the Long Run Average Total Cost (LRATC) curve of a firm.Figure 8.3
Which of the following would account for the shape of the long-run average-total-cost curve in Figure 8.3?
A)Low worker morale
B)Low productivity
C)Administration overhead
D)Specialization of labor
E)Managerial problems
Which of the following would account for the shape of the long-run average-total-cost curve in Figure 8.3?
A)Low worker morale
B)Low productivity
C)Administration overhead
D)Specialization of labor
E)Managerial problems
Question
The table given below shows the average total cost of production of a firm at different levels of the output.Table 8.5
Diseconomies of scale:
A)occur only in the short run.
B)occur when at least one resource is fixed and unit costs decrease as the quantity of production increases.
C)occur when at least one resource is fixed and unit costs increase as the quantity of production increases.
D)are represented by the upward-sloping portion of the short run average total cost curve.
E)occur when all resources are variable and unit costs increase as the quantity of production increases.
Question
The figure given below shows three Short Run Average Total Cost (SRATC) curves and the Long Run Average Total Cost (LRATC) curve of a firm.Figure 8.3
If a company is producing at a level of output at which the long-run average-total-cost curve reaches a minimum, then the company:
A)is experiencing economies of scale.
B)is operating at its minimum efficient scale.
C)is experiencing increasing returns to scale.
D)will shut down.
E)is experiencing diseconomies of scale.
Question
The figure given below shows three Short Run Average Total Cost (SRATC) curves and the Long Run Average Total Cost (LRATC) curve of a firm.Figure 8.3
As the confectionary, Mrs. Fields' Cookies, gained popularity in California and decided to expand its operations to Utah, it was able to achieve economies of scale. This means that:
A)property taxes were lower in its new location in Utah.
B)transport and communication systems were more developed in Utah.
C)wages were higher in Utah compared to California.
D)expansion of output and firm size led to specialization among the workers.
E)government policies were more favorable in Utah.
Question
The figure given below shows three Short Run Average Total Cost (SRATC) curves and the Long Run Average Total Cost (LRATC) curve of a firm.Figure 8.3
Which of the following statements is true?
A)When long-run average total costs are increasing, the firm enjoys economies of scale.
B)Most industries exhibit long-run average costs that are shaped like an upside-down U.
C)Constant returns to scale occur when the short-run average-total-cost curve is horizontal.
D)When long-run average total costs are increasing, the firm has diseconomies of scale.
E)Constant returns to scale are never present in the real world.
Question
The figure given below shows three Short Run Average Total Cost (SRATC) curves and the Long Run Average Total Cost (LRATC) curve of a firm.Figure 8.3
The long run is referred to as a planning horizon because:
A)the firm has committed to a fixed quantity of at least one resource and the other resources are variable.
B)the manager has selected the size of the firm that appears to be the least profitable and does not have the option of selecting any other plant size.
C)the firm has not committed to a fixed quantity of any resource and has all options available to it.
D)the manager has selected a scale of production.
E)the firm is operating along a specific average-cost curve.
Question
The table given below shows the average total cost of production of a firm at different levels of the output.Table 8.5
A positively sloped long run average cost implies:
A)economies of scale.
B)constant returns to scale.
C)diseconomies of scale.
D)diminishing marginal returns to a factor.
E)increasing returns to scale.
A positively sloped long run average cost implies:
A)economies of scale.
B)constant returns to scale.
C)diseconomies of scale.
D)diminishing marginal returns to a factor.
E)increasing returns to scale.
Question
The figure given below shows three Short Run Average Total Cost (SRATC) curves and the Long Run Average Total Cost (LRATC) curve of a firm.Figure 8.3
The term minimum efficient scale refers to:
A)the output corresponding to the minimum point of the short-run average-total-cost curve.
B)the total of all efficient points along the long-run average-cost curve.
C)the output corresponding to the highest point of the short-run average-total-cost curve.
D)the minimum point of the long-run average-cost curve, or the output level at which the cost per unit of output is the lowest.
E)the maximum point of the long-run average-cost curve, or the output level at which the cost per unit of output is the highest.
Question
The table given below shows the average total cost of production of a firm at different levels of the output.Table 8.5
Which of the following may lead to diseconomies of scale?
A)Specialization on the basis of comparative advantage
B)Lack of coordination among the division heads
C)Using larger and more efficient machineries
D)Division of labor on the basis of capability
E)Specialization of marketing, pricing, and research
Question
The figure given below shows three Short Run Average Total Cost (SRATC) curves and the Long Run Average Total Cost (LRATC) curve of a firm.Figure 8.3
If a firm experiences constant returns to scale throughout:
A)the long-run average-total-cost curve is negatively sloped.
B)the short-run average-total-cost curves are tangential to the long-run average-total-cost curve at a point on their positively sloped portion.
C)the short-run average-total-cost curves are tangential to the long-run average-total-cost curve at their minimum points.
D)the short-run average-total-cost curves are tangential to the long-run average-total-cost curve at a point on their negatively sloped portion.
E)the long-run average-total-cost curve is positively sloped.
Question
The table given below shows the average total cost of production of a firm at different levels of the output.Table 8.5
If a firm experiences economies of scale,
A)it moves up along the long run average total cost curve.
B)expansion of output becomes more expensive for the firm.
C)the firm can reduce its per unit cost by producing less.
D)the firm must shut down in the long run.
E)the firm can reduce its per unit cost by expanding production.
Question
The figure given below shows three Short Run Average Total Cost (SRATC) curves and the Long Run Average Total Cost (LRATC) curve of a firm.Figure 8.3
When a firm is experiencing economies of scale, it will:
A)underuse a larger plant size than is indicated by short-run efficiency concerns.
B)underuse a smaller plant than is indicated by short-run efficiency concerns.
C)overuse a larger plant size than is indicated by short-run efficiency concerns.
D)overuse a smaller plant size than is indicated by short-run efficiency concerns.
E)produce at the minimum short-run and long-run average costs.
Question
The table given below shows the average total cost of production of a firm at different levels of the output.Table 8.5
A firm gets less efficient as it gets bigger, if it is experiencing:
A)economies of scale.
B)constant returns to scale.
C)increasing returns to factors.
D)diseconomies of scale.
E)a period of post war recovery.
A firm gets less efficient as it gets bigger, if it is experiencing:
A)economies of scale.
B)constant returns to scale.
C)increasing returns to factors.
D)diseconomies of scale.
E)a period of post war recovery.
Question
The figure given below shows three Short Run Average Total Cost (SRATC) curves and the Long Run Average Total Cost (LRATC) curve of a firm.Figure 8.3
If long-run costs are plotted on the vertical axis and quantity of output plotted on the horizontal axis, a positively sloped line implies _____.
A)constant returns to scale
B)economies of scale
C)diseconomies of scale
D)an increase in capital-labor ratio
E)a decrease in cost-output ratio
If long-run costs are plotted on the vertical axis and quantity of output plotted on the horizontal axis, a positively sloped line implies _____.
A)constant returns to scale
B)economies of scale
C)diseconomies of scale
D)an increase in capital-labor ratio
E)a decrease in cost-output ratio
Question
The table given below shows the average total cost of production of a firm at different levels of the output.Table 8.5
If long-run costs are plotted on the vertical axis and the quantity of output is plotted on the horizontal axis, a line that is perfectly horizontal implies:
A)constant returns to scale.
B)economies of scale.
C)diseconomies of scale.
D)inefficient use of capital.
E)inefficient use of labor.
If long-run costs are plotted on the vertical axis and the quantity of output is plotted on the horizontal axis, a line that is perfectly horizontal implies:
A)constant returns to scale.
B)economies of scale.
C)diseconomies of scale.
D)inefficient use of capital.
E)inefficient use of labor.

Unlock Deck
Sign up to unlock the cards in this deck!
Unlock Deck
Unlock Deck
1/105
Play
Full screen (f)
Deck 8: Supply: the Costs of Doing Business
1
The below figure shows the various combinations of the goods X and Y that yield different levels of utility.Figure 7.3
Which of the following reflects the correct relationship between average total cost (ATC) and marginal cost (MC)?
A)When MC > ATC; ATC is falling.
B)When ATC is minimum; ATC < MC.
C)When MC < ATC; ATC is falling.
D)When MC < ATC; ATC is constant.
E)When ATC < MC; MC is falling.
Which of the following reflects the correct relationship between average total cost (ATC) and marginal cost (MC)?
A)When MC > ATC; ATC is falling.
B)When ATC is minimum; ATC < MC.
C)When MC < ATC; ATC is falling.
D)When MC < ATC; ATC is constant.
E)When ATC < MC; MC is falling.
When MC < ATC; ATC is falling.
2
The below figure shows the various combinations of the goods X and Y that yield different levels of utility.Figure 7.3
Which of these is true of the law of diminishing marginal returns?
A)It is a long run phenomena where all inputs are variable.
B)It applies mostly to the short run because some inputs remain fixed.
C)It is a long run phenomena experienced under monopoly.
D)It applies to fixed inputs in the long run.
E)It applies to fixed inputs in the short run.
It applies mostly to the short run because some inputs remain fixed.
3
The below figure shows the various combinations of the goods X and Y that yield different levels of utility.Figure 7.3
The average total cost incurred by a firm is calculated by dividing:
A)the change in total cost by the change in the quantity of output.
B)total output by the number of people employed.
C)the change in total output by the change in the number of people employed.
D)total cost by total output.
E)total output by total cost.
total cost by total output.
4
The below figure shows the various combinations of the goods X and Y that yield different levels of utility.Figure 7.3
If an average cost curve is U-shaped, then:
A)costs per unit remainconstant throughout the entire range of production.
B)costs per unit fall throughout the entire range of production.
C)costs per unit increase throughout the entire range of production.
D)costs per unit first rise, then reach a maximum, and then begin to fall as output is increased.
E)costs per unit first fall, then reach a minimum, and then increase as output is increased.
Unlock Deck
Unlock for access to all 105 flashcards in this deck.
Unlock Deck
k this deck
5
The below figure shows the various combinations of the goods X and Y that yield different levels of utility.Figure 7.3
When the average total cost is at its minimum, it is:
A)equal to average variable cost.
B)greater than marginal cost.
C)equal to average fixed cost.
D)equal to marginal cost.
E)less than marginal cost.
When the average total cost is at its minimum, it is:
A)equal to average variable cost.
B)greater than marginal cost.
C)equal to average fixed cost.
D)equal to marginal cost.
E)less than marginal cost.
Unlock Deck
Unlock for access to all 105 flashcards in this deck.
Unlock Deck
k this deck
6
The below figure shows the various combinations of the goods X and Y that yield different levels of utility.Figure 7.3
"As I add more workers to the factory line, the additional output produced by each additional worker seems to decline. Eventually, the workers just get in each others' way." This statement by a factory supervisor refers to the law of:
A)comparative advantage.
B)demand.
C)supply.
D)increasing returns to scale.
E)diminishing marginal returns.
Unlock Deck
Unlock for access to all 105 flashcards in this deck.
Unlock Deck
k this deck
7
The below figure shows the various combinations of the goods X and Y that yield different levels of utility.Figure 7.3
If labor is the only variable input, an increase in the quantity of labor:
A)does not have any effect on the quantity of output.
B)causes the output to increase initially at a diminishing rate and then at an increasing rate.
C)causes the output to increase at a constant rate till the last worker is hired.
D)causes the output to increase initially at an increasing rate and then at a decreasing rate.
E)causes the output to decrease at a constant rate till the last worker is hired.
Unlock Deck
Unlock for access to all 105 flashcards in this deck.
Unlock Deck
k this deck
8
The below figure shows the various combinations of the goods X and Y that yield different levels of utility.Figure 7.3
Suppose that the total fixed cost of producing five sailboats is $4,000, total variable cost is $4,000, and the total cost of producing six sailboats is $10,000. The marginal cost of the sixth sailboat is:
A)$2,000.
B)$4,000.
C)$8,000.
D)$10,000.
E)$6,000.
Suppose that the total fixed cost of producing five sailboats is $4,000, total variable cost is $4,000, and the total cost of producing six sailboats is $10,000. The marginal cost of the sixth sailboat is:
A)$2,000.
B)$4,000.
C)$8,000.
D)$10,000.
E)$6,000.
Unlock Deck
Unlock for access to all 105 flashcards in this deck.
Unlock Deck
k this deck
9
The below figure shows the various combinations of the goods X and Y that yield different levels of utility.Figure 7.3
When more and more units of a variable factor are combined with constant amount of a fixed factor, such that the variable factor becomes abundant compared to the fixed factor, the output will eventually:
A)increase at an increasing rate.
B)increase at a diminishing rate.
C)increase at a constant rate.
D)become constant.
E)fall to zero.
Unlock Deck
Unlock for access to all 105 flashcards in this deck.
Unlock Deck
k this deck
10
The below figure shows the various combinations of the goods X and Y that yield different levels of utility.Figure 7.3
The marginal fixed cost of a firm:
A)is a positive constant irrespective of output level.
B)declines as output is increased because a fixed numerator is divided by an ever-growing denominator.
C)generally increases as output is increased.
D)is equal to average variable cost and average total cost at their minimum points.
E)is always equal to zero and is therefore ignored by economists.
Unlock Deck
Unlock for access to all 105 flashcards in this deck.
Unlock Deck
k this deck
11
The below figure shows the various combinations of the goods X and Y that yield different levels of utility.Figure 7.3
Fixed costs are costs paid for:
A)medical reimbursements and health insurance of workers.
B)obsolete plant and equipment not used anymore.
C)plant and equipment in the long run.
D)hiring temporary workers.
E)resources that do not change with changes in output.
Fixed costs are costs paid for:
A)medical reimbursements and health insurance of workers.
B)obsolete plant and equipment not used anymore.
C)plant and equipment in the long run.
D)hiring temporary workers.
E)resources that do not change with changes in output.
Unlock Deck
Unlock for access to all 105 flashcards in this deck.
Unlock Deck
k this deck
12
The below figure shows the various combinations of the goods X and Y that yield different levels of utility.Figure 7.3
At its minimum point, the average-total-cost curve is intersected by the:
A)average fixed cost curve.
B)average variable cost curve.
C)total fixed cost curve.
D)total variable cost curve.
E)marginal cost curve.
At its minimum point, the average-total-cost curve is intersected by the:
A)average fixed cost curve.
B)average variable cost curve.
C)total fixed cost curve.
D)total variable cost curve.
E)marginal cost curve.
Unlock Deck
Unlock for access to all 105 flashcards in this deck.
Unlock Deck
k this deck
13
The below figure shows the various combinations of the goods X and Y that yield different levels of utility.Figure 7.3
Assume that one laborer produces 6 units of output, two laborers produce 14 units, three laborers 22 units, four laborers 24 units, and five laborers 25 units. Diminishing returns set in when the firm hires:
A)the first laborer.
B)the second laborer.
C)the third laborer.
D)the fourth laborer.
E)the fifth laborer.
Unlock Deck
Unlock for access to all 105 flashcards in this deck.
Unlock Deck
k this deck
14
The below figure shows the various combinations of the goods X and Y that yield different levels of utility.Figure 7.3
If a firm is experiencing diminishing returns to a variable input, then:
A)it must be hiring less-productive units of the variable resource.
B)it must be experiencing diseconomies of scale.
C)the marginal physical product of the variable input must be decreasing.
D)the average physical product of the variable input must be decreasing.
E)its total product must be decreasing.
Unlock Deck
Unlock for access to all 105 flashcards in this deck.
Unlock Deck
k this deck
15
The below figure shows the various combinations of the goods X and Y that yield different levels of utility.Figure 7.3
A firm's marginal cost equals the:
A)ratio of total cost to total quantity.
B)slope of the demand curve under perfect competition.
C)slope of the total product curve when the latter is at its maximum.
D)change in total cost divided by the change in total output.
E)slope of the supply curve.
A firm's marginal cost equals the:
A)ratio of total cost to total quantity.
B)slope of the demand curve under perfect competition.
C)slope of the total product curve when the latter is at its maximum.
D)change in total cost divided by the change in total output.
E)slope of the supply curve.
Unlock Deck
Unlock for access to all 105 flashcards in this deck.
Unlock Deck
k this deck
16
The below figure shows the various combinations of the goods X and Y that yield different levels of utility.Figure 7.3
If the total cost of producing 2 pounds of cheese is $6 and the total cost of producing 4 pounds of cheese is $8, then:
A)marginal cost of producing cheese declines as output increases.
B)average total cost of producing cheese declines as output increases.
C)average total cost of producing cheese increases as output increases.
D)average total cost remains constant irrespective of the change in output.
E)marginal cost remains constant irrespective of the change in output.
Unlock Deck
Unlock for access to all 105 flashcards in this deck.
Unlock Deck
k this deck
17
The below figure shows the various combinations of the goods X and Y that yield different levels of utility.Figure 7.3
Short run refers to a period of time during which:
A)all the factors are constant.
B)all the factors are variable.
C)the producer can shift from one plant size to another.
D)some factors are fixed while some others are variable.
E)the producer cannot change the level of output.
Short run refers to a period of time during which:
A)all the factors are constant.
B)all the factors are variable.
C)the producer can shift from one plant size to another.
D)some factors are fixed while some others are variable.
E)the producer cannot change the level of output.
Unlock Deck
Unlock for access to all 105 flashcards in this deck.
Unlock Deck
k this deck
18
The below figure shows the various combinations of the goods X and Y that yield different levels of utility.Figure 7.3
Diminishing marginal returns means that as you combine more units of a variable resource with a set of fixed resources:
A)the average physical product of the fixed inputs increases at an increasing rate.
B)the marginal physical product of the variable input decreases.
C)the total output decreases.
D)the marginal physical product of the variable input increases at a constant rate.
E)the marginal physical product of the variable input increases at a decreasing rate.
Unlock Deck
Unlock for access to all 105 flashcards in this deck.
Unlock Deck
k this deck
19
The below figure shows the various combinations of the goods X and Y that yield different levels of utility.Figure 7.3
After hiring a new employee, a manager finds that the total output has increased. When the manager hires another employee however, he realizes that although the total production has increased, the increment is less than the previous case. This is the result of:
A)diseconomies of scale.
B)a general economic downturn.
C)diminishing marginal returns.
D)the lack of skills of the two new employees.
E)constant returns to scale.
Unlock Deck
Unlock for access to all 105 flashcards in this deck.
Unlock Deck
k this deck
20
The below figure shows the various combinations of the goods X and Y that yield different levels of utility.Figure 7.3
If the average variable cost of a firm is falling, then the:
A)average fixed cost must be rising.
B)marginal cost must be falling.
C)marginal cost must be rising.
D)marginal cost lies below the average variable cost.
E)marginal cost lies above the average variable cost.
If the average variable cost of a firm is falling, then the:
A)average fixed cost must be rising.
B)marginal cost must be falling.
C)marginal cost must be rising.
D)marginal cost lies below the average variable cost.
E)marginal cost lies above the average variable cost.
Unlock Deck
Unlock for access to all 105 flashcards in this deck.
Unlock Deck
k this deck
21
The figure given below shows cost curves of a firm.Figure: 8.2
In the figure,
|: Marginal cost curve
||: Average total cost curve
|||: Average variable cost curve
Refer to Figure 8.2. At an output level of G:
A)both average total cost and average variable cost are falling.
B)average fixed cost is equal to the distance JK.
C)average variable cost exceeds marginal cost by the amount LJ.
D)average total cost exceeds marginal cost by the amount KJ.
E)total cost is equal to the area 0AJG.
In the figure,|: Marginal cost curve
||: Average total cost curve
|||: Average variable cost curve
Refer to Figure 8.2. At an output level of G:
A)both average total cost and average variable cost are falling.
B)average fixed cost is equal to the distance JK.
C)average variable cost exceeds marginal cost by the amount LJ.
D)average total cost exceeds marginal cost by the amount KJ.
E)total cost is equal to the area 0AJG.
Unlock Deck
Unlock for access to all 105 flashcards in this deck.
Unlock Deck
k this deck
22
The below figure shows the various combinations of the goods X and Y that yield different levels of utility.Figure 7.3
Assume that for 20 bicycles, the total fixed cost is $100 and the total variable cost is $300. Then the average fixed cost and the average variable cost are:
A)$5 and $10 respectively.
B)$5 and $15 respectively.
C)$10 and $15 respectively.
D)$15 and $10 respectively.
E)$10 and $5 respectively.
Assume that for 20 bicycles, the total fixed cost is $100 and the total variable cost is $300. Then the average fixed cost and the average variable cost are:
A)$5 and $10 respectively.
B)$5 and $15 respectively.
C)$10 and $15 respectively.
D)$15 and $10 respectively.
E)$10 and $5 respectively.
Unlock Deck
Unlock for access to all 105 flashcards in this deck.
Unlock Deck
k this deck
23
The below figure shows the various combinations of the goods X and Y that yield different levels of utility.Figure 7.3
Assume that one laborer produces 6 units of output, two laborers produce 14 units, three produce 20 units, and four produce 24 units. If the cost is $20 per unit of labor and fixed costs are $100, what is the average total cost of producing 14 units of output?
A)$50
B)$20
C)$10
D)$100
E)$40
Assume that one laborer produces 6 units of output, two laborers produce 14 units, three produce 20 units, and four produce 24 units. If the cost is $20 per unit of labor and fixed costs are $100, what is the average total cost of producing 14 units of output?
A)$50
B)$20
C)$10
D)$100
E)$40
Unlock Deck
Unlock for access to all 105 flashcards in this deck.
Unlock Deck
k this deck
24
The figure given below shows cost curves of a firm.Figure: 8.2
In the figure,
|: Marginal cost curve
||: Average total cost curve
|||: Average variable cost curve
Refer to Figure 8.2. At an output level of H, total fixed cost is:
A)SR.
B)LK.
C)BE.
D)area BEMN.
E)area 0EMH.
In the figure,|: Marginal cost curve
||: Average total cost curve
|||: Average variable cost curve
Refer to Figure 8.2. At an output level of H, total fixed cost is:
A)SR.
B)LK.
C)BE.
D)area BEMN.
E)area 0EMH.
Unlock Deck
Unlock for access to all 105 flashcards in this deck.
Unlock Deck
k this deck
25
The figure given below shows the average fixed cost (AFC) and the average variable cost (AVC) curves of a competitive firm.Figure 8.1
Using Figure 8.1 determine the average total cost of producing the first unit of the output.
A)$10
B)$20
C)$30
D)$40
E)$50
Using Figure 8.1 determine the average total cost of producing the first unit of the output.
A)$10
B)$20
C)$30
D)$40
E)$50
Unlock Deck
Unlock for access to all 105 flashcards in this deck.
Unlock Deck
k this deck
26
The figure given below shows cost curves of a firm.Figure: 8.2
In the figure,
|: Marginal cost curve
||: Average total cost curve
|||: Average variable cost curve
Refer to Figure 8.2. When Average Variable Cost (AVC) is at a minimum, which of the following is true?
A)AVC equals AB
B)Marginal cost (MC) equals 0G
C)Average total cost exceeds AVC by SR
D)MC equals HN
E)MC equals GJ
In the figure,|: Marginal cost curve
||: Average total cost curve
|||: Average variable cost curve
Refer to Figure 8.2. When Average Variable Cost (AVC) is at a minimum, which of the following is true?
A)AVC equals AB
B)Marginal cost (MC) equals 0G
C)Average total cost exceeds AVC by SR
D)MC equals HN
E)MC equals GJ
Unlock Deck
Unlock for access to all 105 flashcards in this deck.
Unlock Deck
k this deck
27
The following table shows the cost of producing different units of ball point pens by a firm.Table 8.1
According to Table 8.1, the total fixed cost of the firm equals:
A)$18.
B)$10.
C)$2.
D)$12.
E)$8.
According to Table 8.1, the total fixed cost of the firm equals:
A)$18.
B)$10.
C)$2.
D)$12.
E)$8.
Unlock Deck
Unlock for access to all 105 flashcards in this deck.
Unlock Deck
k this deck
28
The following table shows the cost of producing different units of ball point pens by a firm.Table 8.1
Refer to Table 8.1. What will be the average fixed cost of producing five ball point pens?
A)$2
B)$5
C)$4
D)$3.33
E)$10
Refer to Table 8.1. What will be the average fixed cost of producing five ball point pens?
A)$2
B)$5
C)$4
D)$3.33
E)$10
Unlock Deck
Unlock for access to all 105 flashcards in this deck.
Unlock Deck
k this deck
29
The following table shows the cost of producing different units of ball point pens by a firm.Table 8.1
According to Table 8.1, the average variable cost of producing five ball point pens is:
A)$3.5.
B)$2.
C)$4.
D)$2.5
E)$4.5
According to Table 8.1, the average variable cost of producing five ball point pens is:
A)$3.5.
B)$2.
C)$4.
D)$2.5
E)$4.5
Unlock Deck
Unlock for access to all 105 flashcards in this deck.
Unlock Deck
k this deck
30
The following table shows the cost of producing different units of ball point pens by a firm.Table 8.1
For a steel manufacturing firm, overhead costs would include:
A)cost of iron ore.
B)cost incurred in buying blast furnaces.
C)insurance premiums of the firm.
D)wages of the workers.
E)cost of electricity for running the machines in the factory.
For a steel manufacturing firm, overhead costs would include:
A)cost of iron ore.
B)cost incurred in buying blast furnaces.
C)insurance premiums of the firm.
D)wages of the workers.
E)cost of electricity for running the machines in the factory.
Unlock Deck
Unlock for access to all 105 flashcards in this deck.
Unlock Deck
k this deck
31
The below figure shows the various combinations of the goods X and Y that yield different levels of utility.Figure 7.3
With expansion in the level of output, total fixed cost:
A)declines but remains positive.
B)increases.
C)falls to zero.
D)remains constant.
E)becomes negative.
With expansion in the level of output, total fixed cost:
A)declines but remains positive.
B)increases.
C)falls to zero.
D)remains constant.
E)becomes negative.
Unlock Deck
Unlock for access to all 105 flashcards in this deck.
Unlock Deck
k this deck
32
The below figure shows the various combinations of the goods X and Y that yield different levels of utility.Figure 7.3
If the total cost of producing 6 units is $228 and the total cost of producing 7 units is $245, what is the marginal cost of producing the seventh unit?
A)$35
B)$245
C)$3
D)$38
E)$17
If the total cost of producing 6 units is $228 and the total cost of producing 7 units is $245, what is the marginal cost of producing the seventh unit?
A)$35
B)$245
C)$3
D)$38
E)$17
Unlock Deck
Unlock for access to all 105 flashcards in this deck.
Unlock Deck
k this deck
33
The table below shows the total cost of producing different units of a commodity.Table 8.2
Refer to Table 8.2. If the production of 2 extra units (units 11 and 12) increases total cost by $162, then:
A)the marginal cost of the twelfth unit will be $162.
B)the total cost of producing 12 units will be $894.
C)the average variable cost of producing 11 units is $732.
D)the average total cost of producing 12 units is $61.
E)the marginal cost of the thirteenth unit will be $0.
Unlock Deck
Unlock for access to all 105 flashcards in this deck.
Unlock Deck
k this deck
34
The figure given below shows the average fixed cost (AFC) and the average variable cost (AVC) curves of a competitive firm.Figure 8.1
Refer to Figure 8.1. Compute the total cost of producing 4 units of the output.
A)$64
B)$72
C)$80
D)$84
E)$90
Refer to Figure 8.1. Compute the total cost of producing 4 units of the output.
A)$64
B)$72
C)$80
D)$84
E)$90
Unlock Deck
Unlock for access to all 105 flashcards in this deck.
Unlock Deck
k this deck
35
The table below shows the total cost of producing different units of a commodity.Table 8.2
From Table 8.2, derive the value of total fixed costs.
A)$10
B)$100
C)$98
D)$50
E)$60
From Table 8.2, derive the value of total fixed costs.
A)$10
B)$100
C)$98
D)$50
E)$60
Unlock Deck
Unlock for access to all 105 flashcards in this deck.
Unlock Deck
k this deck
36
The following table shows the cost of producing different units of ball point pens by a firm.Table 8.1
If the average total cost of producing 2 pounds of cheese is $4 and the average total cost of producing 3 pounds of cheese is $4.2, then the marginal cost of producing third pound of cheese is equal to:
A)$4.2.
B)$8.
C)$4.5.
D)$4.6.
E)$4.1.
If the average total cost of producing 2 pounds of cheese is $4 and the average total cost of producing 3 pounds of cheese is $4.2, then the marginal cost of producing third pound of cheese is equal to:
A)$4.2.
B)$8.
C)$4.5.
D)$4.6.
E)$4.1.
Unlock Deck
Unlock for access to all 105 flashcards in this deck.
Unlock Deck
k this deck
37
The following table shows the cost of producing different units of ball point pens by a firm.Table 8.1
Refer to Table 8.1. What is the marginal cost of producing the fifth unit?
A)$4
B)$6
C)$8
D)$2
E)$10
Refer to Table 8.1. What is the marginal cost of producing the fifth unit?
A)$4
B)$6
C)$8
D)$2
E)$10
Unlock Deck
Unlock for access to all 105 flashcards in this deck.
Unlock Deck
k this deck
38
The figure given below shows cost curves of a firm.Figure: 8.2
In the figure,
|: Marginal cost curve
||: Average total cost curve
|||: Average variable cost curve
Which of the following is not correct for an individual firm?
A)If the average variable cost (AVC) is decreasing, average total cost (ATC) must be decreasing.
B)AVC reaches minimum before ATC.
C)If ATC is increasing, AVC must be increasing.
D)If AVC is increasing, marginal cost (MC) is increasing.
E)If average fixed cost (AFC) is decreasing, ATC must be decreasing.
In the figure,|: Marginal cost curve
||: Average total cost curve
|||: Average variable cost curve
Which of the following is not correct for an individual firm?
A)If the average variable cost (AVC) is decreasing, average total cost (ATC) must be decreasing.
B)AVC reaches minimum before ATC.
C)If ATC is increasing, AVC must be increasing.
D)If AVC is increasing, marginal cost (MC) is increasing.
E)If average fixed cost (AFC) is decreasing, ATC must be decreasing.
Unlock Deck
Unlock for access to all 105 flashcards in this deck.
Unlock Deck
k this deck
39
The table below shows the total cost of producing different units of a commodity.Table 8.2
According to Table 8.2, the average variable cost of producing two units of output is:
A)$48.
B)$50.
C)$62.
D)$55.
E)$60.
According to Table 8.2, the average variable cost of producing two units of output is:
A)$48.
B)$50.
C)$62.
D)$55.
E)$60.
Unlock Deck
Unlock for access to all 105 flashcards in this deck.
Unlock Deck
k this deck
40
The figure given below shows cost curves of a firm.Figure: 8.2
In the figure,
|: Marginal cost curve
||: Average total cost curve
|||: Average variable cost curve
Refer to Figure 8.2. At an output level of H, average total cost is:
A)0E.
B)BE.
C)area 0EMH.
D)0B.
E)area 0BNH.
In the figure,|: Marginal cost curve
||: Average total cost curve
|||: Average variable cost curve
Refer to Figure 8.2. At an output level of H, average total cost is:
A)0E.
B)BE.
C)area 0EMH.
D)0B.
E)area 0BNH.
Unlock Deck
Unlock for access to all 105 flashcards in this deck.
Unlock Deck
k this deck
41
The table given below shows the total fixed and variable costs of a firm.Table 8.3
Refer to Table 8.3. At what level of output does the average total cost starts increasing?
A)1 unit
B)6 units
C)5 units
D)7 units
E)4 units
Refer to Table 8.3. At what level of output does the average total cost starts increasing?
A)1 unit
B)6 units
C)5 units
D)7 units
E)4 units
Unlock Deck
Unlock for access to all 105 flashcards in this deck.
Unlock Deck
k this deck
42
The table given below shows the average total cost of production of a firm at different levels of the output.Table 8.5
In the long run, the total variable cost of a firm:
A)is equal to its total fixed cost.
B)is equal to its total cost.
C)is equal to its average fixed cost.
D)is more than its total fixed cost.
E)is less than its total cost.
In the long run, the total variable cost of a firm:
A)is equal to its total fixed cost.
B)is equal to its total cost.
C)is equal to its average fixed cost.
D)is more than its total fixed cost.
E)is less than its total cost.
Unlock Deck
Unlock for access to all 105 flashcards in this deck.
Unlock Deck
k this deck
43
The table given below shows the total cost of producing different units of the output by a competitive firm.Table 8.4
In Table 8.4, at 4 units of output marginal cost is:
A)$10.
B)$15.
C)$20.
D)$25
E)$30.
In Table 8.4, at 4 units of output marginal cost is:
A)$10.
B)$15.
C)$20.
D)$25
E)$30.
Unlock Deck
Unlock for access to all 105 flashcards in this deck.
Unlock Deck
k this deck
44
The table given below shows the average total cost of production of a firm at different levels of the output.Table 8.5
As the output produced by a firm increases, the average fixed cost:
A)continues to decline.
B)initially increases, and then declines.
C)quickly drops to zero.
D)becomes constant.
E)declines and finally becomes negative.
As the output produced by a firm increases, the average fixed cost:
A)continues to decline.
B)initially increases, and then declines.
C)quickly drops to zero.
D)becomes constant.
E)declines and finally becomes negative.
Unlock Deck
Unlock for access to all 105 flashcards in this deck.
Unlock Deck
k this deck
45
The table given below shows the average total cost of production of a firm at different levels of the output.Table 8.5
In Table 8.5, if the total fixed cost is $3, what is the total variable cost of producing 5 units?
A)$38
B)$32
C)$3
D)$8
E)Cannot be determined from the information given.
In Table 8.5, if the total fixed cost is $3, what is the total variable cost of producing 5 units?
A)$38
B)$32
C)$3
D)$8
E)Cannot be determined from the information given.
Unlock Deck
Unlock for access to all 105 flashcards in this deck.
Unlock Deck
k this deck
46
The table given below shows the total fixed and variable costs of a firm.Table 8.3
In Table 8.3, the average fixed cost of the first unit of output is ____ while the average fixed cost of producing 8 units of output is ____.
A)$30; $40
B)$40; $5
C)$40; $40
D)$40; $280
E)$40; $320
In Table 8.3, the average fixed cost of the first unit of output is ____ while the average fixed cost of producing 8 units of output is ____.
A)$30; $40
B)$40; $5
C)$40; $40
D)$40; $280
E)$40; $320
Unlock Deck
Unlock for access to all 105 flashcards in this deck.
Unlock Deck
k this deck
47
The table given below shows the total cost of producing different units of the output by a competitive firm.Table 8.4
Which of the following is correct if the firm described in Table 8.4 decides to produce nothing?
A)The total cost of production will be zero.
B)The total fixed cost of production will be zero.
C)The total variable cost of production will be zero.
D)The average cost of production will be zero.
E)It is impossible for the firm to produce nothing in the short run.
Unlock Deck
Unlock for access to all 105 flashcards in this deck.
Unlock Deck
k this deck
48
The table given below shows the average total cost of production of a firm at different levels of the output.Table 8.5
According to economic theory, the difference between the long run and the short run is:
A)about two months.
B)about two years.
C)not relevant for executive decision makers.
D)strictly theoretical so that in practice there is no difference between them.
E)the ability for a firm to vary all resources.
Unlock Deck
Unlock for access to all 105 flashcards in this deck.
Unlock Deck
k this deck
49
The table given below shows the average total cost of production of a firm at different levels of the output.Table 8.5
In the short run when output is zero, total cost is:
A)equal to total variable cost.
B)greater than total fixed cost.
C)equal to total fixed cost.
D)less than total fixed cost.
E)less than total variable cost.
In the short run when output is zero, total cost is:
A)equal to total variable cost.
B)greater than total fixed cost.
C)equal to total fixed cost.
D)less than total fixed cost.
E)less than total variable cost.
Unlock Deck
Unlock for access to all 105 flashcards in this deck.
Unlock Deck
k this deck
50
The table given below shows the total fixed and variable costs of a firm.Table 8.3
If the firm described in Table 8.3 decides to produce nothing, its:
A)total cost will fall to zero.
B)total variable cost will be equal to $30.
C)total cost will equal $40.
D)average total cost will equal zero.
E)marginal cost will equal $10.
If the firm described in Table 8.3 decides to produce nothing, its:
A)total cost will fall to zero.
B)total variable cost will be equal to $30.
C)total cost will equal $40.
D)average total cost will equal zero.
E)marginal cost will equal $10.
Unlock Deck
Unlock for access to all 105 flashcards in this deck.
Unlock Deck
k this deck
51
The table given below shows the average total cost of production of a firm at different levels of the output.Table 8.5
If a firm doubles its resources and generates an output level which is more than double, it is said to be experiencing:
A)economic fluctuations.
B)recession.
C)diseconomies of scale.
D)increasing marginal returns to a factor.
E)economies of scale.
If a firm doubles its resources and generates an output level which is more than double, it is said to be experiencing:
A)economic fluctuations.
B)recession.
C)diseconomies of scale.
D)increasing marginal returns to a factor.
E)economies of scale.
Unlock Deck
Unlock for access to all 105 flashcards in this deck.
Unlock Deck
k this deck
52
The table given below shows the total cost of producing different units of the output by a competitive firm.Table 8.4
Refer to Table 8.4. At 4 units of output,
A)AFC is $6.25 and AVC is $10.
B)AFC is $6.25 and AVC is $40.
C)AFC is $40 and AVC is $6.25.
D)AFC is $25 and AVC is $40.
E)AFC and AVC cannot be determined for the firm in question.
Refer to Table 8.4. At 4 units of output,
A)AFC is $6.25 and AVC is $10.
B)AFC is $6.25 and AVC is $40.
C)AFC is $40 and AVC is $6.25.
D)AFC is $25 and AVC is $40.
E)AFC and AVC cannot be determined for the firm in question.
Unlock Deck
Unlock for access to all 105 flashcards in this deck.
Unlock Deck
k this deck
53
The table given below shows the total fixed and variable costs of a firm.Table 8.3
According to Table 8.3, the firm's marginal cost is equal to its average total cost at _____ unit(s) of output.
A)1
B)3
C)4
D)5
E)8
According to Table 8.3, the firm's marginal cost is equal to its average total cost at _____ unit(s) of output.
A)1
B)3
C)4
D)5
E)8
Unlock Deck
Unlock for access to all 105 flashcards in this deck.
Unlock Deck
k this deck
54
The table given below shows the average total cost of production of a firm at different levels of the output.Table 8.5
Refer to Table 8.5. At what level of production will the average total cost curve intersect the marginal cost curve?
A)3 units
B)2 units
C)1 unit
D)5 units
E)4 units
Refer to Table 8.5. At what level of production will the average total cost curve intersect the marginal cost curve?
A)3 units
B)2 units
C)1 unit
D)5 units
E)4 units
Unlock Deck
Unlock for access to all 105 flashcards in this deck.
Unlock Deck
k this deck
55
The table given below shows the average total cost of production of a firm at different levels of the output.Table 8.5
In Table 8.5, the marginal cost of producing the third unit of output is:
A)$7.
B)$8.
C)$3.
D)$4.
E)$6.
In Table 8.5, the marginal cost of producing the third unit of output is:
A)$7.
B)$8.
C)$3.
D)$4.
E)$6.
Unlock Deck
Unlock for access to all 105 flashcards in this deck.
Unlock Deck
k this deck
56
The table given below shows the average total cost of production of a firm at different levels of the output.Table 8.5
The law of diminishing return does not apply to a firm in the long run because in this phase:
A)all the factors of production are fixed.
B)there are no fixed factors of production.
C)there are some fixed and some variable factors of production.
D)the producer is required to produce a fixed level of output.
E)the producer can change the level of output only by changing the variable factors, fixed factors remaining unchanged.
Unlock Deck
Unlock for access to all 105 flashcards in this deck.
Unlock Deck
k this deck
57
The table given below shows the average total cost of production of a firm at different levels of the output.Table 8.5
In Table 8.5, what is the total cost of producing 4 units?
A)$28
B)$10
C)$15
D)$20
E)$35
In Table 8.5, what is the total cost of producing 4 units?
A)$28
B)$10
C)$15
D)$20
E)$35
Unlock Deck
Unlock for access to all 105 flashcards in this deck.
Unlock Deck
k this deck
58
The table given below shows the total fixed and variable costs of a firm.Table 8.3
Using the information in Table 8.3 we can conclude that the marginal cost curve intersects the average variable cost curve at ____ unit(s) of output.
A)1
B)2
C)5
D)4
E)6
Using the information in Table 8.3 we can conclude that the marginal cost curve intersects the average variable cost curve at ____ unit(s) of output.
A)1
B)2
C)5
D)4
E)6
Unlock Deck
Unlock for access to all 105 flashcards in this deck.
Unlock Deck
k this deck
59
The table below shows the total cost of producing different units of a commodity.Table 8.2
Refer to Table 8.2. The average fixed cost of the first unit of output is:
A)$46.
B)$98.
C)$100.
D)$50.
E)$140.
Refer to Table 8.2. The average fixed cost of the first unit of output is:
A)$46.
B)$98.
C)$100.
D)$50.
E)$140.
Unlock Deck
Unlock for access to all 105 flashcards in this deck.
Unlock Deck
k this deck
60
The table given below shows the average total cost of production of a firm at different levels of the output.Table 8.5
In the long run,
A)some resources are variable and some resources are fixed.
B)all the resources can be varied.
C)all resources are fixed.
D)at least one resource is fixed.
E)there are no explicit costs.
In the long run,
A)some resources are variable and some resources are fixed.
B)all the resources can be varied.
C)all resources are fixed.
D)at least one resource is fixed.
E)there are no explicit costs.
Unlock Deck
Unlock for access to all 105 flashcards in this deck.
Unlock Deck
k this deck
61
The table given below shows the average total cost of production of a firm at different levels of the output.Table 8.5
The long-run average total cost curve represents:
A)the maximum cost of producing any level of output when all the factors are fixed.
B)the lowest cost of producing any level of output when all the factors are variable.
C)the maximum cost of producing any level of output when all the factors are variable.
D)the lowest cost of producing any level of output when all the factors are fixed.
E)the lowest cost of producing any level of output when at least one factor is fixed.
Unlock Deck
Unlock for access to all 105 flashcards in this deck.
Unlock Deck
k this deck
62
The figure given below shows three Short Run Average Total Cost (SRATC) curves and the Long Run Average Total Cost (LRATC) curve of a firm.Figure 8.3
Refer to the Figure 8.3. In the long run, an increase in production from Q1 to Q3 would:
A)increase average cost by C4 - C1.
B)increase average cost by C3 - C1.
C)increase average cost by C3 - C2.
D)decrease average cost by C3 - C1.
E)decrease average cost by C3 - C2.
Refer to the Figure 8.3. In the long run, an increase in production from Q1 to Q3 would:
A)increase average cost by C4 - C1.
B)increase average cost by C3 - C1.
C)increase average cost by C3 - C2.
D)decrease average cost by C3 - C1.
E)decrease average cost by C3 - C2.
Unlock Deck
Unlock for access to all 105 flashcards in this deck.
Unlock Deck
k this deck
63
The table given below shows the average total cost of production of a firm at different levels of the output.Table 8.5
The long-run average total cost curve is U-shaped because:
A)a firm initially experiences economies of scale and then diseconomies of scale.
B)the law of diminishing returns to a factor sets in beyond a certain level of output.
C)a firm initially experiences diseconomies of scale and then economies of scale.
D)division of labor keeps labor productivity constant irrespective of expansion or contraction in production.
E)the efficiency of capital increases over a period of time.
Unlock Deck
Unlock for access to all 105 flashcards in this deck.
Unlock Deck
k this deck
64
The table given below shows the average total cost of production of a firm at different levels of the output.Table 8.5
All these factors can lead to economies of scale in production, except:
A)division of labor that helps in specialization.
B)merger of two firms.
C)hiring larger machines which are more efficient than the smaller ones.
D)increase in overhead expenses.
E)research and development.
All these factors can lead to economies of scale in production, except:
A)division of labor that helps in specialization.
B)merger of two firms.
C)hiring larger machines which are more efficient than the smaller ones.
D)increase in overhead expenses.
E)research and development.
Unlock Deck
Unlock for access to all 105 flashcards in this deck.
Unlock Deck
k this deck
65
The figure given below shows three Short Run Average Total Cost (SRATC) curves and the Long Run Average Total Cost (LRATC) curve of a firm.Figure 8.3
In the electricity generation industry, the cost per kilowatt hour of electricity declines as the capacity to generate output increases. This situation represents:
A)a poor opportunity for investors.
B)constant returns to scale.
C)diseconomies of scale.
D)economies of scale.
E)decreasing returns to scale.
Unlock Deck
Unlock for access to all 105 flashcards in this deck.
Unlock Deck
k this deck
66
The figure given below shows three Short Run Average Total Cost (SRATC) curves and the Long Run Average Total Cost (LRATC) curve of a firm.Figure 8.3
Which of the following would account for the shape of the long-run average-total-cost curve in Figure 8.3?
A)Low worker morale
B)Low productivity
C)Administration overhead
D)Specialization of labor
E)Managerial problems
Which of the following would account for the shape of the long-run average-total-cost curve in Figure 8.3?
A)Low worker morale
B)Low productivity
C)Administration overhead
D)Specialization of labor
E)Managerial problems
Unlock Deck
Unlock for access to all 105 flashcards in this deck.
Unlock Deck
k this deck
67
The table given below shows the average total cost of production of a firm at different levels of the output.Table 8.5
Diseconomies of scale:
A)occur only in the short run.
B)occur when at least one resource is fixed and unit costs decrease as the quantity of production increases.
C)occur when at least one resource is fixed and unit costs increase as the quantity of production increases.
D)are represented by the upward-sloping portion of the short run average total cost curve.
E)occur when all resources are variable and unit costs increase as the quantity of production increases.
Unlock Deck
Unlock for access to all 105 flashcards in this deck.
Unlock Deck
k this deck
68
The figure given below shows three Short Run Average Total Cost (SRATC) curves and the Long Run Average Total Cost (LRATC) curve of a firm.Figure 8.3
If a company is producing at a level of output at which the long-run average-total-cost curve reaches a minimum, then the company:
A)is experiencing economies of scale.
B)is operating at its minimum efficient scale.
C)is experiencing increasing returns to scale.
D)will shut down.
E)is experiencing diseconomies of scale.
Unlock Deck
Unlock for access to all 105 flashcards in this deck.
Unlock Deck
k this deck
69
The figure given below shows three Short Run Average Total Cost (SRATC) curves and the Long Run Average Total Cost (LRATC) curve of a firm.Figure 8.3
As the confectionary, Mrs. Fields' Cookies, gained popularity in California and decided to expand its operations to Utah, it was able to achieve economies of scale. This means that:
A)property taxes were lower in its new location in Utah.
B)transport and communication systems were more developed in Utah.
C)wages were higher in Utah compared to California.
D)expansion of output and firm size led to specialization among the workers.
E)government policies were more favorable in Utah.
Unlock Deck
Unlock for access to all 105 flashcards in this deck.
Unlock Deck
k this deck
70
The figure given below shows three Short Run Average Total Cost (SRATC) curves and the Long Run Average Total Cost (LRATC) curve of a firm.Figure 8.3
Which of the following statements is true?
A)When long-run average total costs are increasing, the firm enjoys economies of scale.
B)Most industries exhibit long-run average costs that are shaped like an upside-down U.
C)Constant returns to scale occur when the short-run average-total-cost curve is horizontal.
D)When long-run average total costs are increasing, the firm has diseconomies of scale.
E)Constant returns to scale are never present in the real world.
Unlock Deck
Unlock for access to all 105 flashcards in this deck.
Unlock Deck
k this deck
71
The figure given below shows three Short Run Average Total Cost (SRATC) curves and the Long Run Average Total Cost (LRATC) curve of a firm.Figure 8.3
The long run is referred to as a planning horizon because:
A)the firm has committed to a fixed quantity of at least one resource and the other resources are variable.
B)the manager has selected the size of the firm that appears to be the least profitable and does not have the option of selecting any other plant size.
C)the firm has not committed to a fixed quantity of any resource and has all options available to it.
D)the manager has selected a scale of production.
E)the firm is operating along a specific average-cost curve.
Unlock Deck
Unlock for access to all 105 flashcards in this deck.
Unlock Deck
k this deck
72
The table given below shows the average total cost of production of a firm at different levels of the output.Table 8.5
A positively sloped long run average cost implies:
A)economies of scale.
B)constant returns to scale.
C)diseconomies of scale.
D)diminishing marginal returns to a factor.
E)increasing returns to scale.
A positively sloped long run average cost implies:
A)economies of scale.
B)constant returns to scale.
C)diseconomies of scale.
D)diminishing marginal returns to a factor.
E)increasing returns to scale.
Unlock Deck
Unlock for access to all 105 flashcards in this deck.
Unlock Deck
k this deck
73
The figure given below shows three Short Run Average Total Cost (SRATC) curves and the Long Run Average Total Cost (LRATC) curve of a firm.Figure 8.3
The term minimum efficient scale refers to:
A)the output corresponding to the minimum point of the short-run average-total-cost curve.
B)the total of all efficient points along the long-run average-cost curve.
C)the output corresponding to the highest point of the short-run average-total-cost curve.
D)the minimum point of the long-run average-cost curve, or the output level at which the cost per unit of output is the lowest.
E)the maximum point of the long-run average-cost curve, or the output level at which the cost per unit of output is the highest.
Unlock Deck
Unlock for access to all 105 flashcards in this deck.
Unlock Deck
k this deck
74
The table given below shows the average total cost of production of a firm at different levels of the output.Table 8.5
Which of the following may lead to diseconomies of scale?
A)Specialization on the basis of comparative advantage
B)Lack of coordination among the division heads
C)Using larger and more efficient machineries
D)Division of labor on the basis of capability
E)Specialization of marketing, pricing, and research
Unlock Deck
Unlock for access to all 105 flashcards in this deck.
Unlock Deck
k this deck
75
The figure given below shows three Short Run Average Total Cost (SRATC) curves and the Long Run Average Total Cost (LRATC) curve of a firm.Figure 8.3
If a firm experiences constant returns to scale throughout:
A)the long-run average-total-cost curve is negatively sloped.
B)the short-run average-total-cost curves are tangential to the long-run average-total-cost curve at a point on their positively sloped portion.
C)the short-run average-total-cost curves are tangential to the long-run average-total-cost curve at their minimum points.
D)the short-run average-total-cost curves are tangential to the long-run average-total-cost curve at a point on their negatively sloped portion.
E)the long-run average-total-cost curve is positively sloped.
Unlock Deck
Unlock for access to all 105 flashcards in this deck.
Unlock Deck
k this deck
76
The table given below shows the average total cost of production of a firm at different levels of the output.Table 8.5
If a firm experiences economies of scale,
A)it moves up along the long run average total cost curve.
B)expansion of output becomes more expensive for the firm.
C)the firm can reduce its per unit cost by producing less.
D)the firm must shut down in the long run.
E)the firm can reduce its per unit cost by expanding production.
Unlock Deck
Unlock for access to all 105 flashcards in this deck.
Unlock Deck
k this deck
77
The figure given below shows three Short Run Average Total Cost (SRATC) curves and the Long Run Average Total Cost (LRATC) curve of a firm.Figure 8.3
When a firm is experiencing economies of scale, it will:
A)underuse a larger plant size than is indicated by short-run efficiency concerns.
B)underuse a smaller plant than is indicated by short-run efficiency concerns.
C)overuse a larger plant size than is indicated by short-run efficiency concerns.
D)overuse a smaller plant size than is indicated by short-run efficiency concerns.
E)produce at the minimum short-run and long-run average costs.
Unlock Deck
Unlock for access to all 105 flashcards in this deck.
Unlock Deck
k this deck
78
The table given below shows the average total cost of production of a firm at different levels of the output.Table 8.5
A firm gets less efficient as it gets bigger, if it is experiencing:
A)economies of scale.
B)constant returns to scale.
C)increasing returns to factors.
D)diseconomies of scale.
E)a period of post war recovery.
A firm gets less efficient as it gets bigger, if it is experiencing:
A)economies of scale.
B)constant returns to scale.
C)increasing returns to factors.
D)diseconomies of scale.
E)a period of post war recovery.
Unlock Deck
Unlock for access to all 105 flashcards in this deck.
Unlock Deck
k this deck
79
The figure given below shows three Short Run Average Total Cost (SRATC) curves and the Long Run Average Total Cost (LRATC) curve of a firm.Figure 8.3
If long-run costs are plotted on the vertical axis and quantity of output plotted on the horizontal axis, a positively sloped line implies _____.
A)constant returns to scale
B)economies of scale
C)diseconomies of scale
D)an increase in capital-labor ratio
E)a decrease in cost-output ratio
If long-run costs are plotted on the vertical axis and quantity of output plotted on the horizontal axis, a positively sloped line implies _____.
A)constant returns to scale
B)economies of scale
C)diseconomies of scale
D)an increase in capital-labor ratio
E)a decrease in cost-output ratio
Unlock Deck
Unlock for access to all 105 flashcards in this deck.
Unlock Deck
k this deck
80
The table given below shows the average total cost of production of a firm at different levels of the output.Table 8.5
If long-run costs are plotted on the vertical axis and the quantity of output is plotted on the horizontal axis, a line that is perfectly horizontal implies:
A)constant returns to scale.
B)economies of scale.
C)diseconomies of scale.
D)inefficient use of capital.
E)inefficient use of labor.
If long-run costs are plotted on the vertical axis and the quantity of output is plotted on the horizontal axis, a line that is perfectly horizontal implies:
A)constant returns to scale.
B)economies of scale.
C)diseconomies of scale.
D)inefficient use of capital.
E)inefficient use of labor.
Unlock Deck
Unlock for access to all 105 flashcards in this deck.
Unlock Deck
k this deck
Unlock Deck
Unlock for access to all 105 flashcards in this deck.


