Deck 25: Exploring and Collecting Data
Full screen (f)
Question
Use the following to answer the question(s) below.
Suppose that in 2010 data were collected on the percent of people in Canada who had no employer pension plan. Summary statistics and a histogram for these data are shown below.

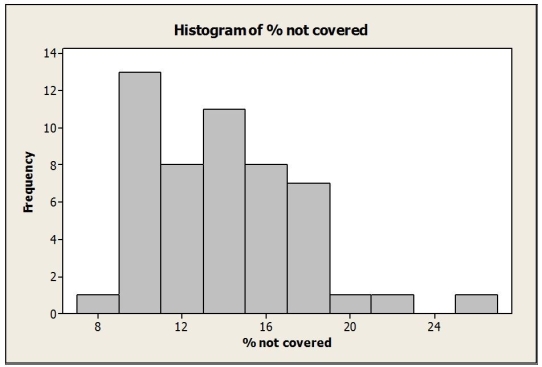
The IQR for these data is
A) 16.7 %
B) 5.9 %
C) 17.9 %
D) 3.6 %
E) 13.4 %
Suppose that in 2010 data were collected on the percent of people in Canada who had no employer pension plan. Summary statistics and a histogram for these data are shown below.
The IQR for these data is
A) 16.7 %
B) 5.9 %
C) 17.9 %
D) 3.6 %
E) 13.4 %
Question
Question
Question
Question
Question
Below is a stem-and-leaf display of prices for a sample homes recently sold in a metropolitan area in Canada. 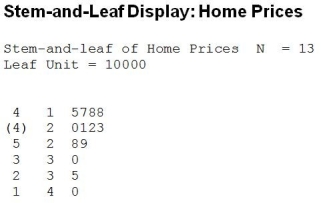 Which of the following statements is true?
A) The mean would be more appropriate than the median to describe the centre of this distribution.
B) This distribution is fairly symmetric.
C) This distribution is right skewed.
D) This distribution is left skewed.
E) Both A and C
Which of the following statements is true?A) The mean would be more appropriate than the median to describe the centre of this distribution.
B) This distribution is fairly symmetric.
C) This distribution is right skewed.
D) This distribution is left skewed.
E) Both A and C
Question
Question
Use the following to answer the question(s) below.
A magazine that publishes product reviews conducted a survey of teenagers' preferences for cell phones. Three brands of cell phone designed specifically with teens in mind were the focus of the study. The table summarizes responses by brand and gender.
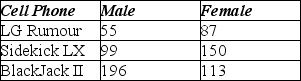
What percent of teenagers preferred LG Rumour?
A) 50%
B) 41%
C) 25%
D) 16%
E) 20%
A magazine that publishes product reviews conducted a survey of teenagers' preferences for cell phones. Three brands of cell phone designed specifically with teens in mind were the focus of the study. The table summarizes responses by brand and gender.
What percent of teenagers preferred LG Rumour?
A) 50%
B) 41%
C) 25%
D) 16%
E) 20%
Question
Question
Use the following to answer the question(s) below.
A magazine that publishes product reviews conducted a survey of teenagers' preferences for cell phones. Three brands of cell phone designed specifically with teens in mind were the focus of the study. The table summarizes responses by brand and gender.
Which of the following charts would be appropriate for displaying the marginal distribution of brands?
A) Histogram
B) Boxplot
C) Pie Chart
D) Line Graph
E) Stem-and-Leaf Display
Question
Which is true of the data shown in the histogram? 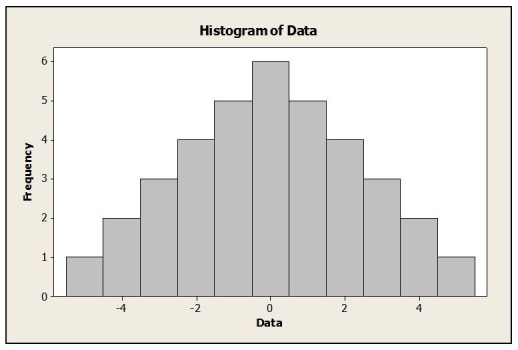 I. The distribution is approximately symmetric.
II) The mean and median are approximately equal.
III) The median and IQR to summarize these data summarize the data better than the mean and standard deviation.
A) I only
B) III only
C) I and II
D) I and III
E) I, II and III
I. The distribution is approximately symmetric.II) The mean and median are approximately equal.
III) The median and IQR to summarize these data summarize the data better than the mean and standard deviation.
A) I only
B) III only
C) I and II
D) I and III
E) I, II and III
Question
Question
An office supply chain has stores in two locations, Toronto and Vancouver. One of these stores is to be closed within the coming year, and to help make the decision, management reviews sales data. Below are boxplots for monthly unit sales for both locations. 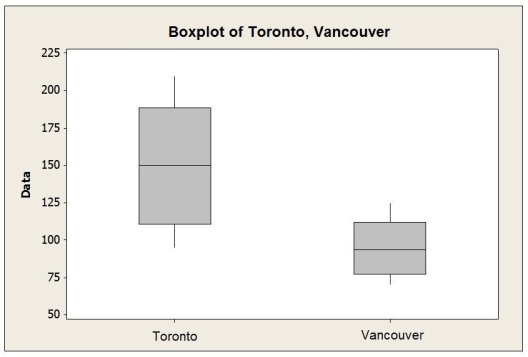 Which of the following statements is not correct?
A) Monthly sales are higher in Toronto compared to Vancouver.
B) The IQR for sales in Toronto is larger than that for Vancouver.
C) Monthly sales are less variable in Vancouver compared to Toronto.
D) Both distributions are fairly symmetric.
E) Monthly sales are more variable in Vancouver compared to Toronto.
Which of the following statements is not correct?A) Monthly sales are higher in Toronto compared to Vancouver.
B) The IQR for sales in Toronto is larger than that for Vancouver.
C) Monthly sales are less variable in Vancouver compared to Toronto.
D) Both distributions are fairly symmetric.
E) Monthly sales are more variable in Vancouver compared to Toronto.
Question
Question
Question
Use the following to answer the question(s) below.
A recent survey of online shoppers asked them to indicate the primary reason they shop via the Internet. The table summarizes responses by reason and gender.
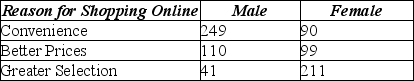
What percent of respondents cite Convenience as the primary reason they shop online?
A) 42%
B) 23%
C) 62%
D) 85%
E) 33%
A recent survey of online shoppers asked them to indicate the primary reason they shop via the Internet. The table summarizes responses by reason and gender.
What percent of respondents cite Convenience as the primary reason they shop online?
A) 42%
B) 23%
C) 62%
D) 85%
E) 33%
Question
Use the following to answer the question(s) below.
A magazine that publishes product reviews conducted a survey of teenagers' preferences for cell phones. Three brands of cell phone designed specifically with teens in mind were the focus of the study. The table summarizes responses by brand and gender.
What percent of teenagers who preferred the BlackJack II were males?
A) 63%
B) 32%
C) 16%
D) 50%
E) 41%
Question
Use the following to answer the question(s) below.
A magazine that publishes product reviews conducted a survey of teenagers' preferences for cell phones. Three brands of cell phone designed specifically with teens in mind were the focus of the study. The table summarizes responses by brand and gender.
What percent of female teenagers preferred the Sidekick LX?
A) 43%
B) 60%
C) 21%
D) 50%
E) 16%
Question
Use the following to answer the question(s) below.
Suppose that in 2010 data were collected on the percent of people in Canada who had no employer pension plan. Summary statistics and a histogram for these data are shown below.
What is the most appropriate measure to describe the centre of these data?
A) Range
B) Mean
C) Standard Deviation
D) Median
E) IQR
Question
Question
Use the following to answer the question(s) below.
Boxplots of earnings per share (EPS) data for a sample of retail company stocks and a sample of energy company stocks are shown below.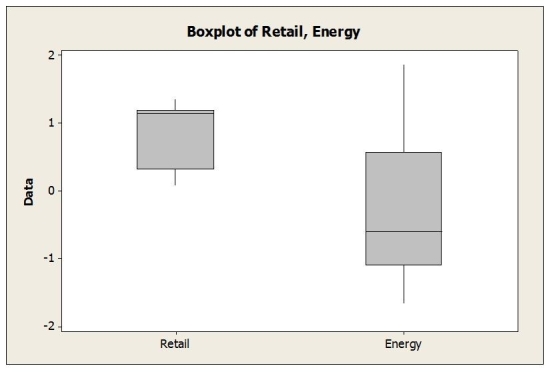
Which of the following statements is correct?
A) The median EPS is higher for energy stocks compared to retail stocks.
B) The median EPS is higher for retail stocks compared to energy stocks.
C) The IQR for the EPS data is larger for retail stocks than for energy stocks.
D) The EPS data are more variable for retail stocks than for energy stocks.
E) The mean is higher for energy stocks compared to retail stocks.
Question
Use the following to answer the question(s) below.
A consumer magazine evaluated the price and performance of 23 models of cordless phones. Computer output gives these summaries for the prices ($):

Based on the summary statistics, which of the following is true?
A) The distribution is symmetric.
B) The distribution is skewed to the right.
C) The distribution is skewed to the left.
D) The mean is a better measure of centre for these data than the median.
E) The standard deviation is larger than the range.
A consumer magazine evaluated the price and performance of 23 models of cordless phones. Computer output gives these summaries for the prices ($):
Based on the summary statistics, which of the following is true?
A) The distribution is symmetric.
B) The distribution is skewed to the right.
C) The distribution is skewed to the left.
D) The mean is a better measure of centre for these data than the median.
E) The standard deviation is larger than the range.
Question
Which is true for the data shown in the histogram? 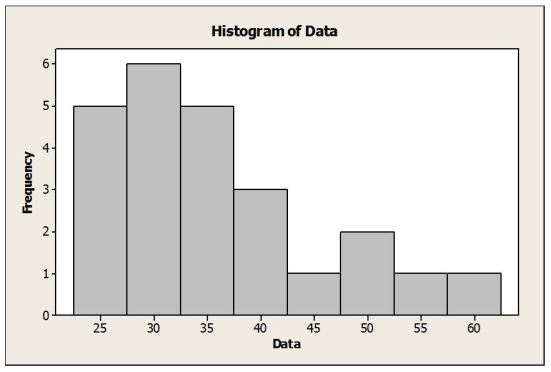 I. The distribution is skewed to the right.
II) The mean is probably smaller than the median.
III) It is appropriate to summarize these data with the mean and standard deviation.
A) I only
B) II only
C) I and II
D) I and III
E) I, II and III
I. The distribution is skewed to the right.II) The mean is probably smaller than the median.
III) It is appropriate to summarize these data with the mean and standard deviation.
A) I only
B) II only
C) I and II
D) I and III
E) I, II and III
Question
Use the following to answer the question(s) below.
A consumer magazine evaluated the price and performance of 23 models of cordless phones. Computer output gives these summaries for the prices ($):
The IQR for these data is
A) $80
B) $185
C) $55
D) $90
E) $52.08
A consumer magazine evaluated the price and performance of 23 models of cordless phones. Computer output gives these summaries for the prices ($):
The IQR for these data is
A) $80
B) $185
C) $55
D) $90
E) $52.08
Question
Use the following to answer the question(s) below.
Boxplots of earnings per share (EPS) data for a sample of retail company stocks and a sample of energy company stocks are shown below.
Which of the following statements is true about the distributions of EPS for retail and energy stocks?
A) The distribution of EPS for retail stocks is skewed to the right.
B) The distribution of EPS for energy stocks is symmetric.
C) Both distributions of EPS are symmetric.
D) The distribution of EPS for retail stocks is skewed to the left.
E) The distribution of EPS for energy stocks is skewed to the left.
Question
Use the following to answer the question(s) below.
A recent survey of online shoppers asked them to indicate the primary reason they shop via the Internet. The table summarizes responses by reason and gender.
What percent of respondents who cited Greater Selection as the primary reason they shop online were females?
A) 53%
B) 27%
C) 50%
D) 84%
E) 42%
Question
Use the following to answer the question(s) below.
A recent survey of online shoppers asked them to indicate the primary reason they shop via the Internet. The table summarizes responses by reason and gender.
What percent of males cite Convenience as the primary reason they shop online?
A) 42%
B) 73%
C) 62%
D) 31%
E) 50%
A recent survey of online shoppers asked them to indicate the primary reason they shop via the Internet. The table summarizes responses by reason and gender.
What percent of males cite Convenience as the primary reason they shop online?
A) 42%
B) 73%
C) 62%
D) 31%
E) 50%
Question

Unlock Deck
Sign up to unlock the cards in this deck!
Unlock Deck
Unlock Deck
1/28
Play
Full screen (f)
Deck 25: Exploring and Collecting Data
1
Use the following to answer the question(s) below.
Suppose that in 2010 data were collected on the percent of people in Canada who had no employer pension plan. Summary statistics and a histogram for these data are shown below.
The IQR for these data is
A) 16.7 %
B) 5.9 %
C) 17.9 %
D) 3.6 %
E) 13.4 %
Suppose that in 2010 data were collected on the percent of people in Canada who had no employer pension plan. Summary statistics and a histogram for these data are shown below.
The IQR for these data is
A) 16.7 %
B) 5.9 %
C) 17.9 %
D) 3.6 %
E) 13.4 %
B
2
In listing a property, real estate agencies provides information on a number of variables. Which of the following variables related to property listings is categorical?
A) Real Estate Tax
B) Number of Bedrooms
C) Style of Home
D) Asking Price
E) Number of Bathrooms
A) Real Estate Tax
B) Number of Bedrooms
C) Style of Home
D) Asking Price
E) Number of Bathrooms
C
3
A researcher is conducting a study on eating disorders. Using a list of recent participants in the online Weight Watchers program, she randomly selects a name from the alphabetized list. She then chooses every tenth person from that point on to include in her study. This sampling strategy is called
A) Systematic
B) Cluster
C) Random
D) Stratified
E) Judgmental
A) Systematic
B) Cluster
C) Random
D) Stratified
E) Judgmental
A
4
Suppose a sample of 60 business majors revealed that the average time spent studying per week is 22 hours with a standard deviation of 4 hours. For one student reporting that he studies 16 hours per week, the corresponding z score is
A) -1.5
B) 1.5
C) 2.2
D) -2.2
E) -3.0
A) -1.5
B) 1.5
C) 2.2
D) -2.2
E) -3.0
Unlock Deck
Unlock for access to all 28 flashcards in this deck.
Unlock Deck
k this deck
5
Statscan publishes the monthly CPI (consumer price index). This index shows the change in prices paid by urban consumers for a market basket of goods and services. These data are
A) Cross-sectional
B) Nominal
C) Categorical
D) Time Series
E) Ordinal
A) Cross-sectional
B) Nominal
C) Categorical
D) Time Series
E) Ordinal
Unlock Deck
Unlock for access to all 28 flashcards in this deck.
Unlock Deck
k this deck
6
Below is a stem-and-leaf display of prices for a sample homes recently sold in a metropolitan area in Canada. Which of the following statements is true?
A) The mean would be more appropriate than the median to describe the centre of this distribution.
B) This distribution is fairly symmetric.
C) This distribution is right skewed.
D) This distribution is left skewed.
E) Both A and C
Which of the following statements is true?A) The mean would be more appropriate than the median to describe the centre of this distribution.
B) This distribution is fairly symmetric.
C) This distribution is right skewed.
D) This distribution is left skewed.
E) Both A and C
Unlock Deck
Unlock for access to all 28 flashcards in this deck.
Unlock Deck
k this deck
7
Statscan compiles data on a number of variables. Which of the following Statscan variables is categorical?
A) Consumer expenditures
B) Type of workplace injuries
C) Wages by occupation
D) Employment costs
E) Productivity by industry
A) Consumer expenditures
B) Type of workplace injuries
C) Wages by occupation
D) Employment costs
E) Productivity by industry
Unlock Deck
Unlock for access to all 28 flashcards in this deck.
Unlock Deck
k this deck
8
Use the following to answer the question(s) below.
A magazine that publishes product reviews conducted a survey of teenagers' preferences for cell phones. Three brands of cell phone designed specifically with teens in mind were the focus of the study. The table summarizes responses by brand and gender.
What percent of teenagers preferred LG Rumour?
A) 50%
B) 41%
C) 25%
D) 16%
E) 20%
Unlock Deck
Unlock for access to all 28 flashcards in this deck.
Unlock Deck
k this deck
9
A researcher is conducting a study on Internet use. He decides to first categorize the population by education level (high school, college graduate, advanced degree, etc.) and then survey a select number from each category. This sampling strategy is called
A) Systematic
B) Cluster
C) Random
D) Judgmental
E) Stratified
A) Systematic
B) Cluster
C) Random
D) Judgmental
E) Stratified
Unlock Deck
Unlock for access to all 28 flashcards in this deck.
Unlock Deck
k this deck
10
Use the following to answer the question(s) below.
A magazine that publishes product reviews conducted a survey of teenagers' preferences for cell phones. Three brands of cell phone designed specifically with teens in mind were the focus of the study. The table summarizes responses by brand and gender.
Which of the following charts would be appropriate for displaying the marginal distribution of brands?
A) Histogram
B) Boxplot
C) Pie Chart
D) Line Graph
E) Stem-and-Leaf Display
Unlock Deck
Unlock for access to all 28 flashcards in this deck.
Unlock Deck
k this deck
11
Which is true of the data shown in the histogram? I. The distribution is approximately symmetric.
II) The mean and median are approximately equal.
III) The median and IQR to summarize these data summarize the data better than the mean and standard deviation.
A) I only
B) III only
C) I and II
D) I and III
E) I, II and III
I. The distribution is approximately symmetric.II) The mean and median are approximately equal.
III) The median and IQR to summarize these data summarize the data better than the mean and standard deviation.
A) I only
B) III only
C) I and II
D) I and III
E) I, II and III
Unlock Deck
Unlock for access to all 28 flashcards in this deck.
Unlock Deck
k this deck
12
Real estate agencies also keep track of housing prices in a given area. Suppose they also provide their clients with quarterly median selling prices for homes in a given area for the past three year period. These data are
A) Cross-sectional
B) Time Series
C) Categorical
D) Nominal
E) Ordinal
A) Cross-sectional
B) Time Series
C) Categorical
D) Nominal
E) Ordinal
Unlock Deck
Unlock for access to all 28 flashcards in this deck.
Unlock Deck
k this deck
13
An office supply chain has stores in two locations, Toronto and Vancouver. One of these stores is to be closed within the coming year, and to help make the decision, management reviews sales data. Below are boxplots for monthly unit sales for both locations. Which of the following statements is not correct?
A) Monthly sales are higher in Toronto compared to Vancouver.
B) The IQR for sales in Toronto is larger than that for Vancouver.
C) Monthly sales are less variable in Vancouver compared to Toronto.
D) Both distributions are fairly symmetric.
E) Monthly sales are more variable in Vancouver compared to Toronto.
Which of the following statements is not correct?A) Monthly sales are higher in Toronto compared to Vancouver.
B) The IQR for sales in Toronto is larger than that for Vancouver.
C) Monthly sales are less variable in Vancouver compared to Toronto.
D) Both distributions are fairly symmetric.
E) Monthly sales are more variable in Vancouver compared to Toronto.
Unlock Deck
Unlock for access to all 28 flashcards in this deck.
Unlock Deck
k this deck
14
What type of variable is the style of a home (bungalow, split level, ranch etc)?
A) Nominal
B) Interval
C) Quantitative
D) Ordinal
E) Numerical
A) Nominal
B) Interval
C) Quantitative
D) Ordinal
E) Numerical
Unlock Deck
Unlock for access to all 28 flashcards in this deck.
Unlock Deck
k this deck
15
If a parameter is computed from a set of data, which of the following statements is true?
A) The data are obtained from a census.
B) The data are obtained from a random sample.
C) The data is from a sample that is representative of the population.
D) The data are obtained from a stratified sample.
E) The data must be quantitative.
A) The data are obtained from a census.
B) The data are obtained from a random sample.
C) The data is from a sample that is representative of the population.
D) The data are obtained from a stratified sample.
E) The data must be quantitative.
Unlock Deck
Unlock for access to all 28 flashcards in this deck.
Unlock Deck
k this deck
16
Use the following to answer the question(s) below.
A recent survey of online shoppers asked them to indicate the primary reason they shop via the Internet. The table summarizes responses by reason and gender.
What percent of respondents cite Convenience as the primary reason they shop online?
A) 42%
B) 23%
C) 62%
D) 85%
E) 33%
A recent survey of online shoppers asked them to indicate the primary reason they shop via the Internet. The table summarizes responses by reason and gender.
What percent of respondents cite Convenience as the primary reason they shop online?
A) 42%
B) 23%
C) 62%
D) 85%
E) 33%
Unlock Deck
Unlock for access to all 28 flashcards in this deck.
Unlock Deck
k this deck
17
Use the following to answer the question(s) below.
A magazine that publishes product reviews conducted a survey of teenagers' preferences for cell phones. Three brands of cell phone designed specifically with teens in mind were the focus of the study. The table summarizes responses by brand and gender.
What percent of teenagers who preferred the BlackJack II were males?
A) 63%
B) 32%
C) 16%
D) 50%
E) 41%
Unlock Deck
Unlock for access to all 28 flashcards in this deck.
Unlock Deck
k this deck
18
Use the following to answer the question(s) below.
A magazine that publishes product reviews conducted a survey of teenagers' preferences for cell phones. Three brands of cell phone designed specifically with teens in mind were the focus of the study. The table summarizes responses by brand and gender.
What percent of female teenagers preferred the Sidekick LX?
A) 43%
B) 60%
C) 21%
D) 50%
E) 16%
Unlock Deck
Unlock for access to all 28 flashcards in this deck.
Unlock Deck
k this deck
19
Use the following to answer the question(s) below.
Suppose that in 2010 data were collected on the percent of people in Canada who had no employer pension plan. Summary statistics and a histogram for these data are shown below.
What is the most appropriate measure to describe the centre of these data?
A) Range
B) Mean
C) Standard Deviation
D) Median
E) IQR
Unlock Deck
Unlock for access to all 28 flashcards in this deck.
Unlock Deck
k this deck
20
What type of variable is category of workplace injuries (slip and fall, stress related, etc.)?
A) Quantitative
B) Interval
C) Nominal
D) Ordinal
E) Numerical
A) Quantitative
B) Interval
C) Nominal
D) Ordinal
E) Numerical
Unlock Deck
Unlock for access to all 28 flashcards in this deck.
Unlock Deck
k this deck
21
Use the following to answer the question(s) below.
Boxplots of earnings per share (EPS) data for a sample of retail company stocks and a sample of energy company stocks are shown below.
Which of the following statements is correct?
A) The median EPS is higher for energy stocks compared to retail stocks.
B) The median EPS is higher for retail stocks compared to energy stocks.
C) The IQR for the EPS data is larger for retail stocks than for energy stocks.
D) The EPS data are more variable for retail stocks than for energy stocks.
E) The mean is higher for energy stocks compared to retail stocks.
Unlock Deck
Unlock for access to all 28 flashcards in this deck.
Unlock Deck
k this deck
22
Use the following to answer the question(s) below.
A consumer magazine evaluated the price and performance of 23 models of cordless phones. Computer output gives these summaries for the prices ($):
Based on the summary statistics, which of the following is true?
A) The distribution is symmetric.
B) The distribution is skewed to the right.
C) The distribution is skewed to the left.
D) The mean is a better measure of centre for these data than the median.
E) The standard deviation is larger than the range.
Unlock Deck
Unlock for access to all 28 flashcards in this deck.
Unlock Deck
k this deck
23
Which is true for the data shown in the histogram? I. The distribution is skewed to the right.
II) The mean is probably smaller than the median.
III) It is appropriate to summarize these data with the mean and standard deviation.
A) I only
B) II only
C) I and II
D) I and III
E) I, II and III
I. The distribution is skewed to the right.II) The mean is probably smaller than the median.
III) It is appropriate to summarize these data with the mean and standard deviation.
A) I only
B) II only
C) I and II
D) I and III
E) I, II and III
Unlock Deck
Unlock for access to all 28 flashcards in this deck.
Unlock Deck
k this deck
24
Use the following to answer the question(s) below.
A consumer magazine evaluated the price and performance of 23 models of cordless phones. Computer output gives these summaries for the prices ($):
The IQR for these data is
A) $80
B) $185
C) $55
D) $90
E) $52.08
A consumer magazine evaluated the price and performance of 23 models of cordless phones. Computer output gives these summaries for the prices ($):
The IQR for these data is
A) $80
B) $185
C) $55
D) $90
E) $52.08
Unlock Deck
Unlock for access to all 28 flashcards in this deck.
Unlock Deck
k this deck
25
Use the following to answer the question(s) below.
Boxplots of earnings per share (EPS) data for a sample of retail company stocks and a sample of energy company stocks are shown below.
Which of the following statements is true about the distributions of EPS for retail and energy stocks?
A) The distribution of EPS for retail stocks is skewed to the right.
B) The distribution of EPS for energy stocks is symmetric.
C) Both distributions of EPS are symmetric.
D) The distribution of EPS for retail stocks is skewed to the left.
E) The distribution of EPS for energy stocks is skewed to the left.
Unlock Deck
Unlock for access to all 28 flashcards in this deck.
Unlock Deck
k this deck
26
Use the following to answer the question(s) below.
A recent survey of online shoppers asked them to indicate the primary reason they shop via the Internet. The table summarizes responses by reason and gender.
What percent of respondents who cited Greater Selection as the primary reason they shop online were females?
A) 53%
B) 27%
C) 50%
D) 84%
E) 42%
Unlock Deck
Unlock for access to all 28 flashcards in this deck.
Unlock Deck
k this deck
27
Use the following to answer the question(s) below.
A recent survey of online shoppers asked them to indicate the primary reason they shop via the Internet. The table summarizes responses by reason and gender.
What percent of males cite Convenience as the primary reason they shop online?
A) 42%
B) 73%
C) 62%
D) 31%
E) 50%
A recent survey of online shoppers asked them to indicate the primary reason they shop via the Internet. The table summarizes responses by reason and gender.
What percent of males cite Convenience as the primary reason they shop online?
A) 42%
B) 73%
C) 62%
D) 31%
E) 50%
Unlock Deck
Unlock for access to all 28 flashcards in this deck.
Unlock Deck
k this deck
28
Suppose a sample of 60 crates has a mean of 12.1 kilograms and a standard deviation of 0.05 kilograms. If a crate has 12 kilograms, what is its corresponding z score?
A) 2.0
B) -2.0
C) 1.8
D) -3.0
E) -1.8
A) 2.0
B) -2.0
C) 1.8
D) -3.0
E) -1.8
Unlock Deck
Unlock for access to all 28 flashcards in this deck.
Unlock Deck
k this deck
Unlock Deck
Unlock for access to all 28 flashcards in this deck.


